
Abstract
Zirconium conversion coatings prepared in a 200 ppm H2ZrF6 bath for optimal conversion times, were applied on aluminium alloys starting from AA1xxx up to AA7xxx series. The electrochemical behaviour and self-sealing abilities of the coatings were studied by electrochemical impedance spectroscopy during their immersion in 0.5 M NaCl for five days. Microstructural and surface characterization were carried out using scanning electron microscopy with energy dispersive X-ray spectroscopy, X-ray photoelectron spectroscopy and time-of-flight secondary ion mass spectrometry techniques. All zirconium conversion coatings had a bi-layer structure, with average thickness in the range of 30–60 nm, except for the coating applied on alloy AA2024 which exhibited a single-layer structure with a thickness of 12 nm. The coatings provided excellent corrosion protection and self-sealing behaviour when applied on AA3005, AAA356.0, and very good corrosion protection for AA380.0, AA5754 and AA1050A. On the other hand, these coatings did not provide adequate corrosion protection for AA2024 and AA7075. The results were discussed in terms of the role of intermetallic particles on the properties of the conversion coating.
Export citation and abstract BibTeX RIS

This is an open access article distributed under the terms of the Creative Commons Attribution 4.0 License (CC BY, http://creativecommons.org/licenses/by/4.0/), which permits unrestricted reuse of the work in any medium, provided the original work is properly cited.
Aluminium alloys (AAs) are one of the most important structural materials. They possess excellent strength-to-weight ratios, electrical and thermal conductivity and corrosion resistance.1 Depending on their composition and type of fabrication (cast or wrought), these alloys differ in corrosion resistance and mechanical properties. AA2024 and AA7075 are used mainly in the aerospace industry, due to their excellent strength-to-weight ratios; however, they are the most susceptible to corrosion. AA1050A and AA3005 have excellent corrosion resistance and medium strength and are used in the packaging, appliance, architectural and chemical industries. AA5754 has excellent corrosion resistance and high strength, on account of which it is used in shipbuilding and marine industries and for crafting mechanical parts. It gains a metallic blue colour when anodized and is a preferable choice for use in the architectural industry. Due to its high strength-to-weight ratio and excellent corrosion resistance, cast AAA356.0 is used in the shipbuilding, marine and automotive industries, and for crafting aircraft engine parts. Cast AA380.0 has excellent mechanical properties but lower corrosion resistance than AAA356.0; it is used in automotive industries and in crafting mechanical parts.
In the presence of Cl− ions or harsh environments, aluminium alloys are subject to localized corrosion and require additional protection.2,3 The best possible protection for aluminium alloys is the application of coatings. The coating system is complex and consists of conversion coatings/anodization, primers and topcoat.4 The first step is the application of a conversion coating or anodization. The anodized layer is thicker and provides better corrosion protection than do conversion coatings. It is used mainly when excellent corrosion protection is required, as in the aircraft industry. When a simple and economical process is required, conversion coating is the preferred choice, for example, in the automotive and appliance industries.
The primary role of conversion coatings is to promote adhesion of topcoats and reduce the rate of cathodic delamination and filiform corrosion. For the last 90 years, chromate conversion coatings have been the best conversion coatings for the protection of aluminium alloys. However, they are forbidden as constituting health and environmental hazards.5 Currently, the only viable chromium-free conversion coatings on the market are zirconium conversion coatings (ZrCCs).6 Conversion coatings are generally formed by conversion from soluble salt to a slightly soluble or insoluble oxide/hydroxide which precipitates on the metal surface. ZrCCs are applied mainly by immersion of the metal sample in an H2ZrF6 conversion bath. In addition to H2ZrF6, a conversion bath can contain various inorganic and organic components.6,7 Organic components promote adhesion and improve corrosion resistance while inorganic components mainly accelerate the conversion process. A zirconium conversion coating is a nano-coating with a thickness of 30 to 100 nm. Typically, it has a bi-layer structure, of which the outer layer is composed of hydrated zirconium oxide, and the inner layer of a mixture of aluminium oxyfluoride, zirconium oxide and aluminium oxide.6,7
Since the discovery of ZrCCs in the late 1980s and pioneering researches in the early 1990s, zirconium conversion technology has developed quickly.8–11 Over the last 30 years there have been more than one hundred scientific papers concerning zirconium conversion coatings applied on aluminium alloys,8–44 magnesium alloys,45,46 zinc47,48 and steel.7,49–59 ZrCC is formed in three stages: initiation, growth and overgrowth.6,16 It can be monitored by measuring the open circuit potential of a substrate during formation of the conversion coating. The latter is driven by the difference in Volta potentials between cathodic (more noble) areas at the surface, like intermetallic particles and grain boundaries, and the anodic (less noble) aluminium alloy matrix. The process is initiated by chemical attack, by free fluoride ions, that removes natural aluminium oxide and activates aluminium alloy.60,61 At the same time, the surface is activated by hydrogen evolution, and by oxygen reduction reactions at more noble areas that lead to local alkalization up to pH = 8.5.29 In such an alkaline environment zirconium oxide/hydroxide is precipitated, and conversion coating is formed, first at more noble areas and then continues to grow in the lateral direction, to cover the whole aluminium alloy surface.13,14,16 The final zirconium conversion coating is thus much thicker at initiation sites than on the aluminium alloy matrix.
Several studies have shown that zirconium conversion coatings increase the adhesiveness of substrate and the interfacial bond strength between substrate/topcoats.15,54,62–67 They also reduce the rate of cathodic delamination/filiform corrosion.42,58,59,64,68 Surface cleaning or pre-treatment before application of ZrCC has an essential effect on the rate of the conversion process and the final properties of coatings. Thus, pre-treatments that produce more cathodic sites (e.g. immersion in conversion baths containing copper or other noble metal ions) will increase the rate of the conversion, while pre-treatments that produce more hydroxylated surface have been reported to be more prone to interactions with F− ions, thus stimulating chemical dissolution of the metal surface in the first stage of the process, allowing faster deposition rate and thicker final coating.25,27 It has been reported that the rate of conversion is increased by increasing the concentration of free fluoride ions in the conversion bath. Introduction of inorganic corrosion inhibitors (such as cerium-based compounds) in conversion bath formulas was shown to be beneficial for the final coatings, thus providing a certain level of active corrosion protection, i.e. ability to react to the coating damage.43,69 Addition of phosphate compounds increases the thickness and corrosion resistance of ZrCCs, while sealing of anodized AA7075 showed promising results and outperformed hot water sealing.44,70
ZrCCs improve both dry/wet adhesion and the interfacial bond strength of organic coats.64 It is commonly accepted that ZrCCs provide only barrier protection to aluminium alloys, i.e. act as a physical layer preventing corrosion of the substrate without possibility of self-healing, i.e., active corrosion protection. However, our last studies showed that the magnitude of the impedance of ZrCCs applied on wrought alloys AA3003 and AA3005 and on cast alloy AAA356.0 increased during immersion in 0.5 M NaCl.38–40 This effect was more pronounced with ZrCC applied on AA3005 than with that applied on AAA356.0.39 We introduced the term self-sealing to describe the improved corrosion resistance of ZrCCs; it is based on the transformation of the coating composition from ZrF4/ZrOxFy to ZrO2·xH2O(s) and formation of Al(OH)3.39,40 Electrochemically, self-sealing is demonstrated as a progressive increase in impedance at low frequency (∣Z∣3mHz) with immersion time, or a shift of potentiodynamic curves to reduced current densities and positive potentials.38–40 In terms of composition, self-sealing is demonstrated as increase in Zr and O and decrease in F contents with time.39,40 Once the coating is self-sealed, it is able to react to the corrosion damage occurring upon prolonged immersion in NaCl, i.e. when the pitting starts to occur accompanied by a decrease in ∣Z∣3mHz, the coating is able to temporarily self-heal as reflected in the increase in ∣Z∣3mHz. It appears that the self-sealing and self-healing effects are dependent on the composition of the aluminium alloy.
The aim of the present work was, therefore, to evaluate the corrosion resistance and the extent of the self-sealing effect of ZrCC applied on seven aluminium alloys of different series and different fabrication processes (wrought and cast), i.e. AA1050A (Al, 1xxx), AA2024 (Al−Cu−Mn−Mg, 2xxx), AA3005 (Al−Mn−Mg, 3xxx), AAA356.0 (Al−Si−Mg, 3xx.x), AA380.0 (Al−Si−Cu, 3xx.x), AA5754 (Al−Mg−Mn, 5xxx) and AA7075 (Al−Zn−Mg−Cu, 7xxx). Self-healing, as described above, was not studied in details herein, as not all of the studied alloys show this effect. The results of this investigation should thus provide more insight into the influence of specific alloying elements on the performance of ZrCC. The composition of the latter was selected, based on our previous studies, to give good anti-corrosion performance: 200 ppm H2ZrF6 bath, pH 4.5, stirring rate 450 rpm and room temperature;39,40 the appropriate conversion time was then determined for each alloy individually. Microstructure and surface composition of ZrCCs were investigated with scanning electron microscopy, with energy-dispersive X-ray spectroscopy (SEM-EDS), X-ray photoelectron spectroscopy (XPS) and time-of-flight secondary ion mass spectrometry (ToF-SIMS) methods. The electrochemical behaviour of ZrCCs was investigated by measuring the open circuit potential (OCP) vs time curves, potentiodynamic polarization curves and electrochemical impedance spectra (EIS) in 0.5 M NaCl solution.
Experimental
Materials, sample preparation and chemicals
The following aluminium alloys were used as substrates:
- (1)1050A-Oa/EN AWb-1050A/EN AW-Al99.5/UNSc-A91050 with composition: Al 99.50 wt.%, Fe 0–0.4 wt.%, Si 0–0.25 wt.%, Zn 0–0.07 wt.%, Mn 0–0.05 wt.%, Ti 0–0.05 wt.%, Cu 0–0.05 wt.%, Mg 0–0.05 wt.%. It was produced by Impol 2000 d.d. (Slovenska Bistrica, Slovenia) in the form of a 1.5 mm thick sheet. Samples used in experiments were cut in a square shape with dimensions 3 cm × 3 cm, unless stated otherwise.
- (2)2024-T3/EN AW-2024/EN AW-AlCu4Mg1/UNS-A92024 alloy with composition: Cu 4.35 wt.%, Mg 1.33 wt.%, Fe 0.25 wt.%, Mn 0.53 wt.%, Zn 0.1 wt.%, other 0.07 wt.%, Al remainder. It was produced by Kaiser Aluminum in the form of 1 mm thick sheet.
- (3)3005-O/EN AW-3005/EN AW-AlMn1Mg0.5/UNS-A93005 alloy with composition: Mn 1–1.5 wt.%, Mg 0.2–0.6 wt.%, Fe 0–0.7 wt.%, Si 0–0.6 wt.%, Cu 0–0.3, Zn 0–0.25 wt.%, Cr 0–0.1 wt.%, Ti 0–0.1 wt.%, residuals 0.15 wt.%. It was produced by Impol 2000 d.d. (Slovenska Bistrica, Slovenia) in the form of 70 micrometres thick foil.
- (4)A356.0-T6/EN ACd 42100/EN AC-AlSi7Mg0.3/UNS-A13560 alloy with composition: Si 6.5–7.5 wt.%, Fe 0.15 wt.%, Cu 0.03 wt.%, Mn 0.10 wt.%, Mg 0.30–0.45 wt.%, Zn 0.07 wt.%, Ti 0.18 wt.%. It was produced by TALUM d.d. (Kidričevo, Slovenia). Samples used in experiments were cut in a rectangular shape with dimensions 2.5 cm × 4 cm × 0.3 cm.
- (5)380.0-T6/EN AC 46000/EN AC-AlSi9Cu3(Fe)/UNS-A03800 alloy with composition: Si 8.0–11.0 wt.%, Cu 2.0–4.0 wt.%, Fe 0.6–1.1 wt.%, Zn 1.2 wt.%, Mn 0.55 wt.%, Mg 0.15–0.55 wt.%, Cr 0.15 wt.%, Ni 0.55 wt.%, Pb 0.35 wt.%, Sn 0.25 wt.%, Ti 0.20 wt.%. It was produced by TALUM d.d. (Kidričevo, Slovenia). Samples used in experiments were cut in a rectangular shape with dimensions 2.5 cm × 4 cm × 0.3 cm.
- (6)5754-H18/EN AW-5754/EN AW-AlMg3/UNS-A95754 alloy with composition: Mg 2.6–3.6 wt.%, Mn 0–0.5 wt.%, Si 0–0.4 wt.%, Fe 0–0.4 wt.%, Cr 0–0.3 wt.%, Zn 0–0.2 wt.%, Ti 0–0.15 wt.%, Cu 0–0.1 wt.%. It was produced by Impol 2000 d.d. (Slovenska Bistrica, Slovenia) in the form of a 1.5 mm thick sheet.
- (7)7075-T6/EN AW-7075/EN AW-AlZn5,5MgCu/UNS-A97075 alloy with composition: Zn 5.81 wt.%, Mg 2.55 wt.%, Fe 0.21 wt.%, Si 0.08 wt.%, Cu 1.67 wt.%, Al remainder. It was produced by Kaiser Aluminum in the form of a 1 mm thick sheet.
The following chemicals were used for experiments: NaCl (for analysis, Fischer Scientific, Leicestershire), H2ZrF6 (50 wt.% in water, Sigma-Aldrich, Saint Louis, USA), NH4HCO3 (reagent grade, Sigma-Aldrich, Steinheim, Germany) and Metaclean® (alkaline cleaner, Amity International, Barnsley, United Kingdom). Metaclean® is composed of: sodium silicate (5–15 wt.%), sodium metasilicate (5–15 wt.%), tetrasodium E.D.T.A (1–5 wt.%), amino-tris (metylenphosphonic) acid (1–5 wt.%), benzotriazol (0.1–0.3 wt.%), non-ionic surfactant (5–15 wt.%). 5 wt.% of Metaclean® solution has pH = 12.5. Milli-Q Direct water with a resistivity of 18.2 MΩ·cm at 25 °C (Merck, Darmstadt, Germany) was used for rinsing and for solution preparation.
pH was measured using a pH meter 827 pH-lab equipped with Unitrode/Pt1000 (Metrohm AG, Herisau, Switzerland). Teflon beakers (V = 1 l) were used for conversion baths, while glass beakers (V = 600 ml) were used for alkaline cleaner and rinsing baths. Sample holders were made of Teflon and conversion coating solutions were stored in polyethylene bottles.
Preparation of conversion coatings
Before immersing in a conversion coating bath, samples were ground on SiC papers ranging from 320- to 4000-grit using a grinding/polishing machine LaboPol-20 (Struers, Ballerup, Denmark). Immediately after grinding, samples were ultrasonicated in absolute ethanol for 5 min using an ultrasonic bath Elmasonic P (Elma, Germany) at 37 kHz and 100% power. After cleaning, samples were dried with N2 and conserved in a desiccator until the chemical cleaning step. Samples were chemically cleaned by immersion in 5 wt.% Metaclean solution (T = 57 °C, stirring rate 150 rpm) for 3 min. Immediately afterwards, samples were first washed off with Milli-Q Direct water, then dipped in a Milli-Q Direct water bath for 45 s. The sample was then immediately dipped in a conversion coating bath (T = 25 °C, stirring rate 450 rpm). The concentration of the conversion bath was 200 ppm of H2ZrF6. pH was set to 4.8 with 15 wt.% NH4HCO3. Following the conversion bath step, the sample was immediately rinsed with Milli-Q Direct water and then dipped in a Milli-Q Direct water bath for 1 min. Samples were then dried with an N2 stream and left to dry in air for 24 h.
Mechanically ground/polished samples are denoted MP, mechanically ground/polished and chemically pre-treated samples are denoted CP, and zirconium conversion coated CP samples are denoted ZrCC-xxxx or ZrCC-xxx.x, where xxxx and xxx.x stand for the four digits used to designate wrought and cast aluminium alloys, respectively. Note that, for AAs 1050A and A356.0, the designations ZrCC-10150A and ZrCC-A356.0 are used, respectively.
Electrochemical characterization
Electrochemical experiments were carried out with a Multi Autolab/M204 (Metrohm Autolab, Utrecht, Netherlands) potentiostat/galvanostat controlled by Nova 2.1 software. Measurements were conducted in a standard three-electrode flat cell with a volume of 250 ml. The sample was the working electrode pressed against an o-ring, a carbon rod was the counter electrode, and a saturated Ag/AgCl(sat) electrode the reference electrode (ESHE = 0.198 V). All potentials in the text refer to the Ag/AgCl(sat) scale. The electrolyte was freshly prepared 0.5 M NaCl. The area of the working electrode was 1 cm2 and the temperature of electrolyte 25 °C.
Prior to electrochemical measurements, the sample was allowed to rest at open circuit potential (OCP) for 1 h. Electrochemical measurements were conducted in the following sequence from least destructive to more destructive: (i) measurement of the OCP as a function of resting time, (ii) recording of linear polarization resistance curves, and (iii) recording of potentiodynamic polarization curves. The system was allowed to rest for 10 s before switching to the next electrochemical technique.
Linear polarization resistance curves (LPR) were run in the range –10 to 10 mV vs OCP using a 0.1 mV s−1 scan rate. Polarization resistance (Rp,LPR) was determined as the slope of the fitted potential (E) vs current density (j) curve, using Nova 2.1 software.
Potentiodynamic polarization curves were recorded in the potential range starting at −250 mV vs the OCP in an anodic direction until current density reached 0.1 mA cm−2. The scan rate was 1 mV s−1.
Corrosion current density and corrosion potential were determined using Nova 2.1 software based on the Tafel extrapolation method.71 Polarization resistance was calculated from parameters obtained with the Tafel extrapolation (Rp,Tafel) method, using Nova 2.1 software based on Eq. 1 in accordance with standard ASTM G59-97.72

where B is the Stern-Geary constant.
Electrochemical impedance spectroscopy (EIS) spectra were recorded from 100 kHz to 3 mHz frequency using an AC potential amplitude of 10 mV (rms). Spectra were recorded at the OCP, every day up to 5 d of immersion.
Electrochemical measurements were repeated for each condition for at least three different samples. Representative measurements are presented in plots, and average values with standard deviation are given. Where indicated, average values are also given in plots (e.g. for ∣Z∣3mHz and OCP).
Microstructural characterization
SEM images were taken in secondary electron (SE) and back-scattered (BSE) modes, using an FEI Helios Nanolab 650 microscope, and EDS spectra were taken using an Oxford Instruments AZtec system with X-max SDD (50 mm2) detector. The analysed area was 100 nm2 with an analysis depth of 100 nm (near-surface condition) at 3 kV beam energy. EDS mapping was recorded with 3 kV beam energy and resolution of 1024 lines. Prior to analysis, samples were coated with a thin carbon layer to reduce the charging effect.
ToF-SIMS ion depth profiles were made using the ToF-SIMS V spectrometer (ION TOF GmbH—Munster, Germany). The analysis chamber was operated at a pressure below ∼10−9 mbar. Depth profiles for negative ions were recorded by interlacing a pulsed 30 keV Bi+ primary ion source delivering 1.2 pA target current over a 100 × 100 μm2 area with sputtering using a 2 keV Cs+ source beam delivering 523 nA target current over a 400 × 400 μm2 area. The sputtering rate for ToF-SIMS depth profiling was determined by depth profiling of a thin film of Al2O3 of known thickness (50 nm) on Si substrate under the same conditions as those applied for other samples. The sputtering rate was 0.30 nm s−1 (±0.02 nm s−1).
XPS was carried out using a PHI-TFA XPS spectrometer (Physical Electronics Inc.). The vacuum during the XPS analysis was in the range of 10−9 mbar. The analysed area was 0.4 mm in diameter and the depth 3–5 nm; X-rays were provided from a monochromatic Al Kα source at a photon energy of 1486.6 eV. The XPS spectrometer was nominally operated at an energy resolution of 0.6 eV measured on the Ag 3d5/2 peak. XPS spectra were analysed by Multipack software, version 8.0 (Physical Electronics Inc.). The position of binding energies of the experimental spectra was aligned relative to the position of C 1s peak at 284.8 eV.
Results and Discussion
OCP measurements during the formation of conversion coating
The conversion coating process was followed by measuring the open circuit potential of aluminium alloys immersed in a conversion bath of 200 ppm H2ZrF6 (Fig. 1). Initial decay in the potential in the OCP vs time curves represents the phase of surface activation and the initiation of coating formation (Fig. 1). During this phase, natural aluminium oxide is removed by an attack by free F− ions and surface is activated for coating formation.60,61 Immediately after the removal of natural aluminium oxide, hydrogen evolution and oxygen reduction reactions start at intermetallic particles (IMPs). These reactions increase the local pH up to 8.5, causing precipitation of ZrCC.29 The minimum in the OCP curve represents the point at which the rate of precipitation starts to prevail over metal dissolution.6,16,39,40 Afterwards, the rate of conversion coating formation is greater, leading to coating growth in the lateral direction (Fig. 1). The maximum or plateau in the OCP diagram (Fig. 1, asterisk marks) was taken as the optimal (or appropriate) conversion time, i.e. the time at which the coating is fully formed. The position of optimal conversion time was checked previously by measuring electrochemical properties and analysing the surface by SEM/EDS of selected samples prepared at different conversion times.38,40 At shorter time, the coating does not cover the surface completely and shows inadequate corrosion protection.38,40 At longer times, the coating tends to grow further but, due to internal stress and formation of hydrogen microbubbles, it will crack and lose barrier properties (Fig. 1).40,55,73

Figure 1. Open circuit potential during the formation of zirconium conversion coatings (ZrCCs) on aluminium alloys. The curves indicate mean values of three measurements. Stars indicate the conversion time selected as optimal for each concentration.
Download figure:
Standard image High-resolution imageThe rates of activation, coating formation and optimal conversion depend on aluminium alloy microstructure and conversion bath composition. The presence of more noble areas (IMPs, grain boundaries or phases) than there are in the aluminium alloy matrix will increase the rate of conversion coating growth, leading to a shorter optimal time of conversion. At the same time, the less stable natural aluminium oxide film will be easier to remove by the action of free F− ions, giving a faster rate of surface activation and, consequently, a shorter optimal conversion time. Optimal conversion times for ZrCC formation in the 200 ppm H2ZrF6 conversion bath, as a function of aluminium alloy substrates, are given in Table I.
Table I. Optimal conversion times for the formation of ZrCC on different aluminium alloys in 200 ppm H2ZrF6 conversion bath.
| Aluminium alloy | Optimal conversion time, minutes |
|---|---|
| 1050A | 15 |
| 2024 | 3 |
| 3005 | 10 |
| A356.0 | 10 |
| 380.0 | 10 |
| 5754 | 10 |
| 7075 | 10 |
AA2024 required the shortest conversion time due to the presence of a large amount of Cu containing IMPs. In contrast, AA1050A required the longest optimal conversion time due to the small number of IMPs. Optimal conversion times listed in Table I were used in the following experiments.
Electrochemical potentiodynamic curves
Potentiodynamic polarization curves of MP, CP and ZrCC aluminium alloys immersed in 0.5 M NaCl are presented in Figs. 2–3. Before measurements, samples were rested for 1 h at the OCP. Electrochemical data deduced from the potentiodynamic polarization curves are presented in Tables II, SI–SIII. The corrosion resistances of mechanically pre-treated aluminium alloys, based on electrochemical data (small jcorr, large Rp), were in the following order: 380.0 ≤ 2024 ≤ 7075 ≤ 1050A ≤ 5754 ≤ A356.0 ≤ 3005 (Figs. 2–3, Tables SI, SIII). AAs 380.0, 2024 and 7075 had corrosion current densities in range 5·10−7 A·cm−2 to 7·10−7 A·cm−2 and did not show any passivity. This result indicates their low corrosion resistance and high susceptibility to pitting due to the presence of a large amount of noble Cu containing IMPs in AA380.0 and AA2024 and less noble Zn containing IMPs in AA7075. The AA1050A showed high resistance to pitting corrosion due to the absence of more noble IMPs, that resulted in passivity window (ΔE = ∣Epit − Ecorr∣) of ≈0.13 V and current density of 7·10−7 A·cm−2 (pitting potential is denoted as Epit). Thanks to the presence of Si and Mg, AAs A356.0 and 5754 exhibited better corrosion resistance, with ΔEs of 0.07 V and 0.05 V and jcorr of 1.7·10−7 A·cm−2 and 1.2·10−7 A·cm−2, respectively. AA3005, which contains Mn, showed the highest corrosion resistance, with ΔE = 0.15 V and jcorr of 3.9·10−8 A·cm−2. These results were expected and in good agreement with those published.74

Figure 2. Potentiodynamic polarization curves, recorded in 0.5 M NaCl, for mechanically pre-treated (MP), chemically pre-treated (CP) and ZrCC-coated aluminium alloys. Zirconium conversion coatings were prepared in a 200 ppm conversion bath for optimal conversion time (Table I). Samples were rested at the OCP for 1 h before electrochemical measurement. Electrochemical data deduced from polarization curves presented are given in Table SIII. Electrochemical data deduced from several repetitions at different samples and presented as average value ± standard deviation are given in Tables SI–SII (MP and CP substrates) and Table II (ZrCC coated substrates).
Download figure:
Standard image High-resolution image
Figure 3. Potentiodynamic polarization curves, recorded in 0.5 M NaCl, for mechanically pre-treated (MP), chemically pre-treated (CP) and ZrCC-coated aluminium alloys. Zirconium conversion coatings were prepared in a 200 ppm conversion bath for optimal conversion time (Table I). Samples were rested at the OCP for 1 h before electrochemical measurement. Electrochemical data deduced from polarization curves presented are given in Table SIII. Electrochemical data deduced from several repetitions at different samples and presented as average value ± standard deviation are given in Tables SI–SII (MP and CP substrates) and Table II (ZrCC coated substrates).
Download figure:
Standard image High-resolution imageTable II. Electrochemical data deduced from measurements of potentiodynamic polarization curves recorded in 0.5 M NaCl for ZrCCs coatings applied on aluminium alloys. ZrCCs were prepared in a 200 ppm conversion bath for optimal conversion time (Table I). Samples were allowed to rest at OCP for 1 h before electrochemical measurement. In the table, average values deduced from several repetitions at different samples are given (SD-standard deviation). Representative curves are presented in Figs. 2 and 3.
| Sample | jcorr, A cm−2 | OCP, V | Ecorr, V | Epit, V | ΔE*, V | βa mV dec−1 | −βc, mV dec−1 | RP,LPR, Ω cm2 | RP,tafel, Ω cm2 |
|---|---|---|---|---|---|---|---|---|---|
| 1050A | 9.1E-07 | −1.02 | −1.06 | −0.64 | 0.42 | 402 | 159 | 5.0E + 04 | 5.8E + 04 |
| SD | 1.9E-07 | 0.04 | 0.04 | 0.01 | 0.04 | 4 | 3 | 1.1E + 04 | 1.2E + 04 |
| 2024 | 1.6E-07 | −0.72 | −0.74 | −0.53 | 0.21 | 239 | 186 | 3.2E + 05 | 2.9E + 05 |
| SD | 2.1E-08 | 0.02 | 0.00 | 0.01 | 0.01 | 12 | 49 | 2.2E + 04 | 2.7E + 04 |
| 3005 | 2.3E-07 | −0.93 | −0.94 | −0.63 | 0.31 | 416 | 177 | 2.6E + 05 | 2.4E + 05 |
| SD | 4.4E-08 | 0.01 | 0.03 | 0.02 | 0.02 | 56 | 30 | 3.3E + 04 | 3.8E + 04 |
| A356.0 | 7.3E-08 | −0.98 | −0.99 | −0.54 | 0.44 | 264 | 206 | 5.9E + 05 | 6.6E + 05 |
| SD | 8.8E-09 | 0.11 | 0.10 | 0.08 | 0.12 | 24 | 13 | 1.7E + 05 | 9.7E + 04 |
| 380.0 | 4.9E-08 | −0.66 | −0.67 | −0.53 | 0.13 | 221 | 147 | 6.7E + 05 | 8.1E + 05 |
| SD | 7.6E-09 | 0.01 | 0.01 | 0.00 | 0.01 | 13 | 9 | 3.8E + 04 | 1.3E + 05 |
| 5754 | 5.4E-07 | −0.97 | −1.01 | −0.66 | 0.35 | 400 | 168 | 1.2E + 05 | 1.0E + 05 |
| SD | 3.7E-08 | 0.02 | 0.01 | 0.01 | 0.01 | 11 | 10 | 1.4E + 04 | 1.5E + 04 |
| 7075 | 1.8E-07 | −0.80 | −0.83 | −0.66 | 0.17 | 188 | 179 | 2.8E + 05 | 2.9E + 05 |
| SD | 1.2E-07 | 0.09 | 0.08 | 0.07 | 0.08 | 29 | 57 | 1.4E + 05 | 1.8E + 05 |
Chemical pre-treatment differently affected the surfaces of the alloys. For most of the alloys the pre-treatment induced reduction of the passivity window and of jcorr values (Figs. 2–3, Tables SII–SIII). In addition to jcorr, current densities at 0.1 V more negative and more positive in respect to Ecorr in cathodic and anodic branches (jc and ja, respectively) were given as well in Table SIII. In other words, chemical pre-treatment cleaned and activated the surfaces of aluminium alloys by removing the aluminium oxide layer from IMPs. The only exception was AAA356.0 which was passivated after chemical pre-treatment, exhibiting jcorr of 6.1·10−8 A·cm−2 and ΔE of 0.05 V (Figs. 2–3, Tables SII–SIII). This was probably due to the production of a more uniform aluminium oxide passive layer and passivation of Mg-rich IMPs in the alkaline environment. For AA1050A, AA5754 and AA380.0 the jcorr remained similar as for the MP surface indicating that that the surface was not activated.
The zirconium conversion coating process improved the corrosion resistance of all aluminium alloys investigated; this is reflected in increased ΔE and reduced jcorr (Figs. 2–3, Tables II, SIII). The corrosion potential of ZrCC coated alloys was shifted towards more negative values, thus causing the broadening of ΔE in comparison with MP and CP and indicating cathodic inhibition. Breakdown of passivity at the Epit is related to the pitting at the IMPs that are not sufficiently protected by the conversion coating; it occurred at similar or slightly more positive values as for the CP samples. Therefore, increase of the ΔE is primarily related to the negative shift in Ecorr.
Protection provided by ZrCCs based on the ΔE values was in the following order: A356.0 ≥ 1050A ≥ 5754 ≥ 3005 ≥ 2024 ≥ 7075 ≥ 380.0 while, in the following order based on the jcorr values, (from the lowest to the highest): 380.0 ≤ A356.0 ≤ 2024 ≤ 7075 ≤ 3005 ≤ 5754 ≤ 1050A.
To summarize, regardless the aluminium substrate, after 1 h immersion in 0.5 M NaCl zirconium conversion coating acted as a cathodic inhibitor, judging from the shift of Ecorr to negative direction; concomitantly an extended passive plateau is established on the anodic side due to progressive precipitation of Zr oxide/hydroxide which provided barrier protection. Further evaluation of corrosion protection level requires examination of the electrochemical behaviour of ZrCC during prolonged immersion in chloride solution by EIS measurements. Namely, after pre- and conversion treatment, the jc at −0.1 V vs Ecorr was still somewhat larger than ja at 0.1 V vs Ecorr (Figs. 2 and 3, Table SIII) indicating that ZrCC did not passivate the IMPs completely and that oxygen was able to reach the substrate through pores and cracks in the coating and becomes involved in cathodic reaction. Our previous studies show that the corrosion characteristics of ZrCCs, including the reduction of jcorr, jc and ja, improve by immersion time in the period of several days in NaCl due to progressive release of F− from the coating and formation of ZrO2·2H2O(s) and Al(OH)3.39,40 Herein, potentiodynamic measurements were made after only 1 h immersion which is still not sufficient to achieve the best protective properties of the coating and to confirm the self-sealing effect. This will be shown below by EIS measurements.
Electrochemical impedance spectroscopy
The electrochemical behaviour of ZrCCs applied on aluminium alloys was studied using EIS during five days of immersion in 0.5 M NaCl (Figs. 4, S1–S6 (available online at stacks.iop.org/JES/167/111506/mmedia) and Tables III, SIV–SV). Corrosion resistance, the self-sealing effect and active corrosion protection of zirconium conversion coatings can be estimated with the impedance modulus at low frequencies (3 mHz) which is approximately equal to total polarization resistance (│Z│3mHz ≈ Rp).75,76 Values of │Z│3mHz for ZrCC applied on aluminium alloys during prolonged immersion in 0.5 M NaCl solution are presented in Figs. 4g–4i and Tables III and SIV–SV. ZrCC-3005 showed the best corrosion resistance, with values of │Z│3mHz increasing during five days of immersion, from 2.9·105 Ω·cm2 to 7·106 Ω·cm2 (Fig. 4g). ZrCC-A356.0 also showed excellent corrosion resistance, with the value of │Z│3mHz increasing up to three days of immersion, reaching 2.6·106 Ω·cm2. At longer times it decreased slowly, reaching values of 1.4·106 Ω·cm2, indicating that pitting had started. Values of │Z│3mHz for ZrCC-380.0 and ZrCC-5754 increased after one day of immersion but then slowly decreased, reaching steady values of 7.6·105 Ω·cm2 and 1.1·105 Ω·cm2, respectively. This indicated behaviour similar to that of ZrCC-A356.0 but with smaller values of│Z│3mHz. ZrCC-1050A exhibited a similar trend, with values increasing up to three days and then decreasing, reaching 2·105 Ω·cm2 on the fifth day of immersion (Fig. 4h).

Figure 4. (a), (b), (d), (e), (g), (h) The average impedance modulus at 3 mHz (∣Z∣3mHz) and (c), (f), (i) the average open circuit potential (OCP) as a function of immersion time in 0.5 M NaCl solution for: mechanically pre-treated (MP), chemically pre-treated (CP) and zirconium conversion coated aluminium alloys. ZrCCs were prepared in a 200 ppm H2ZrF6 conversion bath for optimal conversion time (Table I). Note that the y-scale is less extended in middle column (b), (e), (h) than in left column (a), (d), (g). Lines were drawn to guide the eye. Original EIS spectra (three repetitions) are given in Supplemental material for MP (Figs. S1, S2), CP (Figs. S3, S4) and ZrCCs coated alloys (Figs. S5, S6). Average data of ∣Z∣3mHz and OCP, together with standard deviations, are given in Tables III, SIV–SV.
Download figure:
Standard image High-resolution imageTable III. The impedance modulus at 3 mHz (∣Z∣3mHz) and the average open circuit potential (OCP) as a function of immersion time in 0.5 M NaCl solution for ZrCCs applied on aluminium alloys. ZrCCs were prepared in a 200 ppm H2ZrF6 conversion bath for optimal conversion times (Table I). In the table, average values deduced from several repetitions on different samples are given (SD-standard deviation).
| │Z│3mHz/Ω·cm2 | ||||||
|---|---|---|---|---|---|---|
| Sample | 1 h | 1 d | 2 d | 3 d | 4 d | 5 d |
| 1050A | 5.3E + 04 | 2.6E + 05 | 3.3E + 05 | 3.2E + 05 | 2.1E + 05 | 2.0E + 05 |
| SD | 1.7E + 04 | 6.4E + 04 | 1.1E + 05 | 1.1E + 05 | 6.5E + 04 | 3.5E + 04 |
| 2024 | 5.2E + 05 | 2.6E + 05 | 1.5E + 05 | 9.1E + 04 | 7.4E + 04 | 5.3E + 04 |
| SD | 2.1E + 05 | 1.1E + 05 | 5.90E + 04 | 2.7E + 04 | 2.5E + 04 | 1.3E + 04 |
| 3005 | 2.9E + 05 | 2.7E + 06 | 4.7E + 06 | 5.7E + 06 | 6.4E + 06 | 6.7E + 06 |
| SD | 1.4E + 03 | 4.2E + 05 | 6.9E + 05 | 9.5E + 05 | 8.5E + 05 | 9.5E + 05 |
| A356.0 | 2.0E + 05 | 1.8E + 06 | 2.3E + 06 | 2.6E + 06 | 1.9E + 06 | 1.4E + 06 |
| SD | 1.6E + 04 | 7.5E + 04 | 1.5E + 05 | 1.9E + 05 | 1.3E + 06 | 1.1E + 06 |
| 380.0 | 4.1E + 05 | 2.4E + 06 | 1.9E + 06 | 1.1E + 06 | 1.1E + 06 | 1.1E + 06 |
| SD | 2.1E + 05 | 5.2E + 05 | 4.5E + 05 | 2.3E + 05 | 5.3E + 05 | 5.2E + 05 |
| 5754 | 1.7E + 05 | 2.0E + 06 | 1.8E + 06 | 1.1E + 06 | 1.1E + 06 | 7.6E + 05 |
| SD | 1.0E + 04 | 7.4E + 04 | 1.4E + 05 | 2.9E + 05 | 2.5E + 05 | 3.3E + 05 |
| 7075 | 5.6E + 05 | 1.6E + 05 | 1.1E + 05 | 8.2E + 04 | 7.2E + 04 | 7.2E + 04 |
| SD | 1.5E + 05 | 3.0E + 04 | 1.7E + 04 | 5.4E + 03 | 1.4E + 04 | 1.4E + 04 |
| OCPvs Ag/AgCl(sat.)/V | ||||||
| 1050A | −1.01 | −0.74 | −0.74 | −0.74 | −0.77 | −0.77 |
| SD | 0.01 | 0.02 | 0.03 | 0.04 | 0.01 | 0.01 |
| 2024 | −0.58 | −0.56 | −0.58 | −0.58 | −0.61 | −0.63 |
| SD | 0.02 | 0.03 | 0.04 | 0.03 | 0.02 | 0.03 |
| 3005 | −0.89 | −0.70 | −0.67 | −0.68 | −0.66 | −0.65 |
| SD | 0.02 | 0.01 | 0.02 | 0.01 | 0.00 | 0.01 |
| A356.0 | −1.11 | −0.77 | −0.71 | −0.65 | −0.63 | −0.66 |
| SD | 0.02 | 0.04 | 0.03 | 0.02 | 0.02 | 0.05 |
| 380.0 | −0.63 | −0.60 | −0.61 | −0.59 | −0.60 | −0.60 |
| SD | 0.06 | 0.03 | 0.04 | 0.04 | 0.04 | 0.04 |
| 5754 | −0.81 | −0.65 | −0.68 | −0.67 | −0.69 | −0.69 |
| SD | 0.03 | 0.01 | 0.01 | 0.01 | 0.02 | 0.01 |
| 7075 | −0.71 | −0.66 | −0.69 | −0.70 | −0.70 | −0.70 |
| SD | 0.08 | 0.02 | 0.02 | 0.02 | 0.02 | 0.01 |
In contrast, values of │Z│3mHz for ZrCC-2024 and ZrCC-7075 decreased sharply from starting values of 5.2·105 Ω·cm2 and 5.6·105 Ω·cm2 down to 2.6·105 Ω·cm2 and 1.6·105 Ω·cm2 after one day of immersion, indicating the initiation of localized pitting corrosion. The values of │Z│ continued to decrease until the end of the test (Fig. 4h).
The increasing values of │Z│3mHz for ZrCCs during immersion in 0.5 M NaCl were related to the self-sealing effect. These results show that this effect is closely related to the chemical composition and microstructure of the aluminium alloy substrates and occurred in the following order: 3005 ≥ A356.0 ≥ 5754 ≈ 380.0 ≥ 1050A. Self-sealing did not occur for ZrCC-2024 and ZrCC-7075, probably due to the presence of large amounts of Cu- and Zn-rich IMPs, respectively. Mechanically and chemically pre-treated aluminium alloys exhibited much lower values of │Z│3mHz during immersion (Figs. 4a–4f). The only exception was mechanically and chemically pre-treated AA3005, which showed improvement of corrosion resistance during immersion for up to 1–2 d (Figs. 4a, 4d). This trend was probably caused by the presence of Mn, which improved the barrier properties and stability of the natural aluminium oxide film during immersion.39
The trend of increasing │Z│3mHz values is accompanied by the progressive shift in OCP to more positive values for all ZrCCs coated alloys except AA2024 and AA7075 which do not show the self-sealing effect (Fig. 4i). For the best performing ZrCC-3005, this shift was about 400 mV.
To summarize, EIS results show that ZrCCs provide excellent corrosion protection of AAs 3005 and A356.0, good corrosion protection of AAs 380.0, 5754 and 1050A, but inadequate corrosion protection of 2024 and 7075 aluminium alloys.
SEM-EDS characterization of aluminium alloys
SEM secondary electron (SE) and backscattered (BSE) images of chemically pre-treated aluminium alloys are presented in Fig. 5. The corresponding EDS analyses of the numbered spots are given in Table IV (spot 1) and SVI–SXII (spots 1–3). EDS analysis was performed with 3 kV beam energy, corresponding to 100 nm analysis depth (near-surface condition). EDS analysis was carried out to obtain the basic composition of the surface. It was not so detailed because the microstructure of these alloys is already well known (vide infra).

Figure 5. SEM SE and BSE images and EDS mapping of chemically pre-treated (CP) aluminium alloys. (a) 1050A, (b) 5754, (c) 3005, (d) A356.0, (e) 380.0, (f) 2024 and (g) 7075. For each alloy, three SEM images are given: SE and BSE images at lower magnification and SE image at the spot denoted by black circle recorded at higher magnification (inset). EDS analysis was carried out at the larger area (1, rectangle) and smaller area (2, 3, circles). The EDS results are presented in Tables IV and SVI–SXII.
Download figure:
Standard image High-resolution imageTable IV. EDS analysis of chemically pre-treated and zirconium coated aluminium alloys 1050A, 2024, 3005, A356.0, 380.0, 5754 and 7075. ZrCCs were prepared in a 200 ppm H2ZrF6 conversion bath for the optimal conversion time (Table I). spots 1 in SEM BSE images in Figs. 4–6. The electron beam voltage of the analysed spots was 3 kV, corresponding to an analysis depth of ca. 100 nm.
| Aluminium Alloy | at.% Al | at.% O | at.% Zr | at.% F | at.% Si | at.% Mg | at.% Zn | at.% Cu | at.% Fe |
|---|---|---|---|---|---|---|---|---|---|
| CP | |||||||||
| 1050A | 71.7 | 27.8 | / | / | 0.5 | / | / | / | / |
| 2024 | 84.0 | 11.8 | / | / | / | 1.2 | / | 2.4 | 0.5 |
| 3005 | 88.8 | 10.6 | / | / | / | 0.6 | / | / | / |
| A356.0 | 67.8 | 20.9 | / | / | 10.8 | 0.5 | / | / | / |
| 380.0 | 62.4 | 27.0 | / | / | 8.9 | / | / | 1.9 | / |
| 5754 | 71.4 | 25.1 | / | / | / | 2.1 | / | / | 1.0 |
| 7075 | 83.1 | 10.4 | / | / | / | 2.1 | 2.6 | 1.1 | 0.6 |
| ZrCC as-prepared | |||||||||
| 1050A | 25.7 | 43.3 | 18.2 | 12.0 | 0.8 | / | / | / | / |
| 2024 | 72.2 | 16.9 | 5.3 | 2.0 | / | 1.0 | / | 2.6 | / |
| 3005 | 54.7 | 25.5 | 13.2 | 6.6 | / | / | / | / | / |
| A356.0 | 37.1 | 35.7 | 14.3 | 7.7 | 5.2 | / | / | / | / |
| 380.0 | 32.1 | 38.1 | 16.0 | 9.7 | 3.4 | / | / | 0.7 | / |
| 5754 | 39.4 | 34.8 | 14.8 | 9.7 | / | 1.4 | / | / | / |
| 7075 | 42.1 | 27.7 | 16.1 | 9.2 | / | 1.3 | 2.5 | 1.1 | / |
| ZrCC-1d | |||||||||
| 1050A | 23.6 | 57.4 | 16.1 | 2.3 | 0.5 | / | / | / | / |
| 2024 | 37.2 | 53.9 | 4.9 | 0.9 | / | 0.9 | / | 3.1 | / |
| 3005 | 53.1 | 33.5 | 11.9 | 1.6 | / | / | / | / | / |
| A356.0 | 25.6 | 55.1 | 13.3 | 1.5 | 4.5 | / | / | / | / |
| 380.0 | 27.6 | 49.6 | 15.0 | 1.7 | 5.4 | / | / | 0.7 | / |
| 5754 | 30.9 | 49.7 | 16.6 | 1.7 | / | 1.0 | / | / | / |
| 7075 | 37.1 | 41.8 | 14.8 | 1.8 | / | 1.0 | 2.3 | 1.2 | / |
| ZrCC-3d | |||||||||
| 1050A | 22.0 | 59.4 | 16.2 | 1.9 | 0.5 | / | / | / | / |
| 2024 | 31.6 | 61.0 | 3.3 | 0.6 | / | 0.6 | / | 3.0 | / |
| 3005 | 54.2 | 33.4 | 11.2 | 1.2 | / | / | / | / | / |
| A356.0 | 32.5 | 48.4 | 13.1 | 1.1 | 5.1 | / | / | / | / |
| 380.0 | 27.4 | 51.1 | 15.0 | 1.0 | 4.3 | / | 0.6 | 0.7 | / |
| 5754 | 35.9 | 46.3 | 15.0 | 1.7 | / | 1.1 | / | / | / |
| 7075 | 40.9 | 43.1 | 10.3 | 1.8 | / | 1.1 | 2.0 | 0.8 | 1.9 |
The surfaces of chemically pre-treated alloys consisted, predominantly, of spontaneously formed aluminium oxide (Table IV). Depending on the substrate, other elements were also detected, ranging from 0.6 at% up to 10.8 at% at spot 1 (larger area). When IMPs were analysed, the concentration of individual elements was larger (Tables SVI–SXII), in accordance with the predominant type of IMP in alloys. Due to the presence of a relatively high amount of Fe and Si, IMPs in AA1050A are AlFe3 and α-AlFeSi. Both of these IMPs are more noble compared to the alloy matrix.77 The microstructures for AA3005 and AAA356.0 have been reported in more detail.39,40
Based on chemical composition, AA2024 has two main groups of IMPs. The first group represents round-shaped S-phase (Al–Cu–Mg) IMPs that are more active electrochemically and susceptible to anodic dissolution but, due to dealloying, become local cathodes. Larger, irregularly shaped Al–Cu–Mn–Fe (Al7Cu2Fe, Al20Cu2Mn3, and Al2Cu) IMPs belong to the second group.78–82 These IMPs are more noble compared to the AA2024-matrix and represent local cathodes in the corrosion process.78
AA3005 and AA5754 contain the same IMPs: (MnFe)Al6 or α-(MnFe)3SiAl12.83 However, AA3005 contains larger IMPs, and a higher number of IMPs than AA5754. Further, AA3005 contains a significant amount of α-(MnFe)3SiAl12, while AA5754 contains, mainly, (MnFe)Al6 with a much higher ratio of Fe/Mn = 7.8 than AA3005 which has an Fe/Mn ratio of 0.8.83 Also, AA3005 contains more small IMPs (dispersoids) than AA5754. Dispersoids are (MnFe)Al6 and α-Al(Fe,Mn)Si IMPs. AA5754 also contain AlFe3, Mg2Si and, sporadically, Al6CuMg4.84 Both of these IMPs are noble relative to the alloy's matrix and act as local cathodes.
The microstructure of AAA356.0 consists of an α-Al matrix (grains), eutectic Si grain boundaries, and IMPs.40,78,85–92 Typical IMPs in AAA356.0 are Al–Si–Fe, Mg–Si and Al–Si–Fe–Mg IMPs (β-Al5FeSi-needles, π-Al8FeMg3Si6, Mg2Si); if there is a higher amount of Mn in alloy composition, α–Al–Si–Fe–Mn IMPs and α-Al15(FeMn)3Si2—Chinese script or skeleton formations will be found. Sporadically, it is possible to find Al5Cu2Mg8Si6. All these IMPs and eutectic-Si are noble to the α-Al matrix except Mg2Si, which is less noble.
The main AA380.0 microstructure components are α-Al matrix (grains), eutectic Si grain boundaries, and IMPs (β-Al5FeSi-needles, Al2Cu, Al(FeCuCr) and α–Al–Si–Fe–Mn, which are formed at grain boundaries.85,90,93–95 It is possible to find Al15(FeMn)3Si2—Chinese script as well if the content of Mn in the alloy is high enough. All these IMPs and eutectic-Si are noble relative to the α-Al matrix.
MgZn2 and Mg2Si are IMPs in AA7075 that are susceptible to anodic dissolution. Al2Cu, Al3Fe and Al7Cu2Fe can sustain high cathodic currents and S-phase (Al2CuMg)78,80,81,96–99 S-phase is susceptible to anodic dissolution. Once, when Mg is removed from S-phase, it reverses its corrosion potential (behaviour) and starts acting as a local cathode.
SEM-EDS characterization of zirconium conversion coatings applied on aluminium alloys
SEM secondary electron (SE) and backscattered (BSE) images of zirconium conversion coatings are presented in Figs. 6–7, and the corresponding EDS analysis of numbered spots is given in Table IV (spot 1), SVI–SXII (spots 1–5). Images are given for as-prepared coatings (i.e. prior to immersion in NaCl) (Figs. 6–7a-a3) and, further, after one day (Figs. 6–7b-b3) and three days (Figs. 6–7c-c3) immersion in 0.5 M NaCl. In SEM SE mode, the nodular structure of conversion coatings is visible only at higher magnification. On the other hand, the formation and lateral distribution of ZrCC throughout the surface is much more visible in SEM BSE mode, as indicated by the bright areas.40 These denote the spots where the formation of ZrCC was initiated and resulted in much thicker final ZrCC. Noble IMPs and eutectic Si grain boundaries of AAA356.0 and AA380.0 aluminium cast alloys were present beneath ZrCC (Figs. 6, 7). EDS analysis shows that as-prepared ZrCC contains ca. 13–18 at.% Zr, 7–12 at.% F, 27–44 at.% O and a minor amount of elements originating from the substrate and/or IMPs (Tables IV, SVI–SXII). The only exception was ZrCC-2024 that contained a much smaller amount of Zr (5.3 at.%), F (2.0 at.%), O (16.9 at.%) and a much higher amount of Al (72.2 at.%) than other as-prepared ZrCCs. On the other hand, it had a higher concentration of Zr (24.6 at.%), F (6.2 at.%) and O (54.6 at.%) at bright spots (Fig. 7a1). Based on these results it can be stated that ZrCC-2024, prepared after 3 min conversion time, was formed non-uniformly across the AA2024 surface and was much thicker at bright spots (IMPs) and much thinner at the matrix. These bright spots were noble, Cu containing IMPs that led to this unequal formation of ZrCC-2024. The overall result was that the mean thickness of ZrCC-2024 is much smaller than that of the other ZrCCs and, according to EIS measurements, does not provide adequate corrosion protection (Fig. 4).

Figure 6. SEM SE and BSE images of ZrCCs applied on aluminium alloys 1050A, 5754, 3005 and A356.0. (a) as-prepared ZrCCs, (b) ZrCCs immersed in 0.5 M NaCl for 1 d and (c) ZrCCs immersed in 0.5 M NaCl for 3 d. ZrCCs were prepared in 200 ppm H2ZrF6 baths for optimal conversion times (Table I). For each alloy, three SEM images are given: SE and BSE images at lower magnification and SE image at the spot denoted by a black circle recorded at higher magnification (inset). EDS analysis was carried out at the larger area (1, rectangle, Table IV) and a smaller area (2–4, circles, Tables SVI–SXII).
Download figure:
Standard image High-resolution image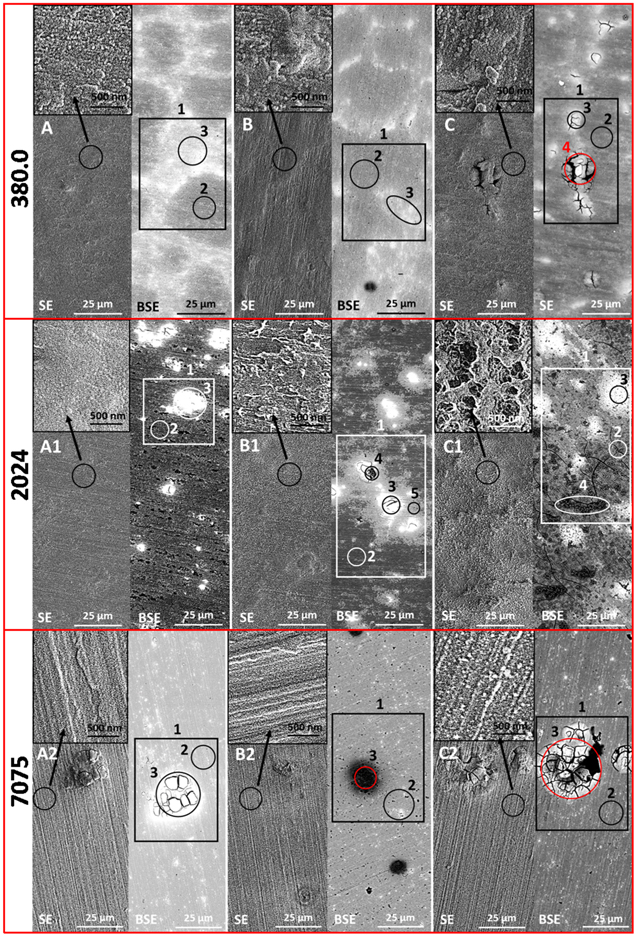
Figure 7. SEM SE and BSE images of ZrCCs applied on aluminium alloys 380.0, 2024 and 7075. (a) as-prepared ZrCCs, (b) ZrCCs immersed in 0.5 M NaCl for 1 d and (c) ZrCCs immersed in 0.5 M NaCl for 3 d. ZrCCs were prepared in 200 ppm H2ZrF6 baths for optimal conversion times (Table I). Three SEM images are given for each alloy: SE and BSE images at lower magnification and SE image at the spot denoted by black circle recorded at higher magnification (inset). EDS analysis was carried out at the larger area (1, rectangle, Table IV) and a smaller area (2–4, circles, Tables SVI–SXII).
Download figure:
Standard image High-resolution imageThe general trend during immersion of ZrCC in 0.5 M NaCl solution was a decrease of F concentration, indicating its leaching from the conversion coating (Table IV). After three days of immersion, the concentration of Zr remained at approximately the same level, while that of O increased by 10 to 15 at.% for ZrCC-1050A, ZrCC-5754, ZrCC-3005, ZrCC-A356.0 and ZrCC-380.0. The surfaces of ZrCC-1050A, ZrCC-5754 and ZrCC-3005 showed no signs of corrosion (Fig. 6c-c2), in good agreement with EIS measurements (Fig. 4), indicating that these ZrCCs were self-sealed. For ZrCC-A356.0 and ZrCC-380.0 there was no corrosion damage after one day of immersion (Figs. 6b3, 7b); however, after three days, corrosion damage appeared in the form of cracks/pits in both alloys (Figs. 6c3, 7c). In these areas, increased concentrations of Zn were detected, indicating that the presence of Zn caused pitting (Tables SIX, SX). The extent of corrosion damage in both alloys was low although corrosion damage was less for ZrCC-A356.0 than for ZrCC-380.0, probably due to higher concentrations of Zn and Cu in the latter.
ZrCC-2024 and ZrCC-7075 exhibited different behaviour during immersion in 0.5 M NaCl. After only one day of immersion, corrosion products appeared on ZrCC-2024, especially around IMPs (Fig. 7b1). The concentration of O was increased by ca. 30 at.%, and that of Zr and F decreased relative to as-prepared coatings (Tables IV, SXI). After three days, severe corrosion damage was visible in the form of cracks (Fig. 7c1). An even higher concentration of O (61.0 at.%) and a lower concentration of Zr (3.0 at.%) and F (0.9 at.%) were detected. These results reflect the extensive coverage of the surface with Al(OH)3 corrosion products and the dissolution of ZrCC during the immersion, indicating that ZrCC was not able to provide proper corrosion protection for AA2024.
The corrosion of ZrCC-7075 was also initiated after one day of immersion in 0.5 M NaCl (Fig. 7b2, dark spots). At these spots, the concentrations of Zn and Cu were larger, indicating the presence of CuZn-rich IMPs under the corrosion products in the form of aluminium oxide/hydroxide (Tables IV, SXII). After three days of immersion, corrosion damage was more severe in the form of a large crack and pits. At these spots, the concentrations of Cu, Zn, Fe were increased, correlating with the presence of CuZnFe IMPs (Fig. 7c2, Tables IV, SXII). At the same time, the formation of corrosion products in the form of Al(OH)3 is indicated. The concentration of Zr was significantly decreased at this spot due to the dissolution of ZrCC and coverage with corrosion products. The general trend during immersion of ZrCC-7075 in 0.5 M NaCl was that the concentration of F decreased 5-fold, indicating leaching of fluorine, and the concentration of O increased. However, the most interesting feature is that the concentration of Zr decreased by 30% after three days of immersion, proving severe dissolution of the coating and its coverage with corrosion products. These results correlate well with EIS measurements (Fig. 4) and show that ZrCC is not able to provide proper corrosion protection to AA7075.
XPS characterization
Chemically pre-treated aluminium alloys, as-prepared ZrCCs and ZrCCs immersed in 0.5 M NaCl solution for three days were all characterized with XPS. The XPS method, with an analysis depth of ca. 10 nm, provides information from the top-most surface of the ZrCC. The composition of the surface obtained from the XPS survey spectra is presented in Table V.
Table V. The concentration of elements obtained by XPS analysis of chemically pre-treated (CP) and zirconium conversion coated aluminium alloys: as-prepared and immersed in 0.5 M NaCl solution for 3 d.
| Aluminium Alloys | at.% Al | at.% O | at.% Zr | at.% F | at.% Si | at.% Mg | at.% Cu | at.% Zn | at.% P | at.% Na | at.% Cl |
|---|---|---|---|---|---|---|---|---|---|---|---|
| CP | |||||||||||
| 1050A | 22.1 | 73.4 | / | / | / | / | / | / | 3.9 | 0.4 | / |
| 2024 | 22.1 | 73.2 | / | / | / | / | / | / | 4.6 | / | / |
| 3005 | 12.8 | 75.1 | / | / | / | / | / | / | 7.2 | 4.9 | / |
| A356.0 | 24.6 | 67.8 | / | / | 1.8 | / | / | / | 5.8 | / | / |
| 380.0 | 23.0 | 72.8 | / | / | 1.8 | / | 0.3 | / | 2.1 | / | / |
| 5754 | 16.4 | 71.3 | / | / | / | 6.9 | / | / | 5.4 | / | / |
| 7075 | 20.5 | 67.7 | / | / | / | 7.5 | / | / | 4.3 | / | / |
| ZrCC as-prepared | |||||||||||
| 1050A | 1.5 | 65.8 | 22.5 | 10.1 | / | / | / | / | / | / | / |
| 2024 | 7.1 | 68.7 | 18.3 | 5.9 | / | / | / | / | / | / | / |
| 3005 | 1.0 | 67.2 | 23.4 | 8.4 | / | / | / | / | / | / | / |
| A356.0 | / | 64.4 | 24.4 | 11.3 | / | / | / | / | / | / | / |
| 380.0 | 1.1 | 66.3 | 23.3 | 9.3 | / | / | / | / | / | / | / |
| 5754 | 2.4 | 64.4 | 22.8 | 10.4 | / | / | / | / | / | / | / |
| 7075 | 7.0 | 67.7 | 18.0 | 5.8 | / | 1.5 | / | / | / | / | / |
| ZrCC-3d | |||||||||||
| 1050A | 5.0 | 74.4 | 19.7 | 0.8 | / | / | / | / | / | / | / |
| 2024 | 23.8 | 69.3 | 2.7 | / | / | / | 1.4 | / | 1.3 | / | 1.5 |
| 3005 | 4.9 | 73.6 | 17.2 | 1.5 | 2.9 | / | / | / | / | / | / |
| A356.0 | 7.2 | 75.3 | 15.5 | 1.6 | 1.9 | / | / | / | / | / | / |
| 380.0 | 4.3 | 75.9 | 19.2 | 0.6 | / | / | / | / | / | / | / |
| 5754 | 6.8 | 72.9 | 15.9 | 1.3 | / | / | / | / | / | / | / |
| 7075 | 16.4 | 69.5 | 7.7 | / | / | 2.9 | 0.4 | 0.7 | 1.6 | / | 8.3 |
The general characteristic of all the aluminium alloys is that the surface was composed of Al, O and P. In addition, AA5754 and AA7075 contained Mg at the surface, cast AAA356.0 and AA380.0 contained Si and AA2024 contained a small amount of Cu. Phosphorus originates from the Metaclean alkaline cleaner used in chemical pre-treatment of the aluminium alloys. Aluminium and oxygen originate from the aluminium oxide/hydroxide. Metaclean alkaline cleaner contains NaSiO3 and P-based corrosion inhibitor/surfactant. After the conversion coating process, most of the ZrCC contained 20–23 at.% Zr, 8–10 at.% F and around 1 at.% Al. ZrCC-2024 and ZrCC-7075 contained less Zr and more Al. The latter indicates that ZrCC-2024 and ZrCC-7075 coatings were thinner than those of other alloys, as was also shown by SEM/EDS (Figs. 6, 7).
After three days of immersion in NaCl solution, the concentration of F was reduced in all ZrCCs. The concentration of Zr remained high in all ZrCCs other than ZrCC-2024 and ZrCC-7075, in which it decreased to 3 at.%. At the same time, the concentrations of O and Al increased for all aluminium alloys, the amount of Al being much higher for ZrCC-2024 and ZrCC-7075. The latter two also contained a significant amount of Cl. These results indicate that ZrCC-2024 and ZrCC-7075 dissolved and were covered by large amounts of corrosion products of aluminium hydroxide/oxide. In contrast, ZrCCs applied on other aluminium alloys were very stable and did not corrode.
High energy resolution XPS spectra for elements of interest are presented in Figs. 8–14. For most alloys, two peaks appeared in the Al 2p spectrum for CP substrates at binding energies (Eb) of 72.5 eV and 74.5 eV (Figs. 8–14), corresponding to Al metal and Al(OH)3, respectively.100,101 For CP-1050A and CP-380.0, only one peak appeared at 74.5 eV, corresponding to Al(OH)3. This indicates that the surfaces of CP-1050A and CP-380.0 were covered with a thicker layer of Al(OH)3, while the hydroxide layer was thinner on other aluminium alloys, thus allowing the detection of Al metal underneath.

Figure 8. High energy resolution XPS spectra (a) Al 2p, (b) O 1s, (c) Zr 3d and (d) F 1s for chemically pre-treated AA1050A and zirconium conversion coated AA1050A, as-prepared and then immersed in 0.5 M NaCl solution for 3 d. ZrCCs were prepared in a 200 ppm H2ZrF6 conversion bath for 15 min. Spectra were not normalized on the intensity scale.
Download figure:
Standard image High-resolution image
Figure 9. High energy resolution XPS spectra (a) Al 2p, (b) O 1s, (c) Zr 3d and (d) F 1s for chemically pre-treated AA5754 and for zirconium conversion coated AA5754, as-prepared, then immersed in 0.5 M NaCl solution for 3 d. ZrCCs were prepared in a 200 ppm H2ZrF6 conversion bath for 10 min. Spectra were not normalized on the intensity scale.
Download figure:
Standard image High-resolution image
Figure 10. High energy resolution XPS spectra (a) Al 2p, (b) O 1s, (c) Zr 3d and (d) F 1s for chemically pre-treated AA3005 and for zirconium conversion coated AA3005, as-prepared, then immersed in 0.5 M NaCl solution for 3 d. ZrCCs were prepared in a 200 ppm H2ZrF6 conversion bath for 10 min. Spectra were not normalized on the intensity scale.
Download figure:
Standard image High-resolution image
Figure 11. High energy resolution XPS spectra (a) Al 2p, (b) O 1s, (c) Zr 3d and (d) F 1s for chemically pre-treated AAA356.0 and zirconium conversion coated AAA356.0, as-prepared, then immersed in 0.5 M NaCl solution for 3 d. ZrCCs were prepared in a 200 ppm H2ZrF6 conversion bath for 10 min. Spectra were not normalized on the intensity scale.
Download figure:
Standard image High-resolution image
Figure 12. High energy resolution XPS spectra (a) Al 2p, (b) O 1s, (c) Zr 3d and (d) F 1s for chemically pre-treated AA380.0 and zirconium conversion coated AA380.0, as-prepared, then immersed in 0.5 M NaCl solution for 3 d. ZrCCs were prepared in a 200 ppm H2ZrF6 conversion bath for 10 min. Spectra were not normalized on the intensity scale.
Download figure:
Standard image High-resolution image
Figure 13. High energy resolution XPS spectra (a) Al 2p, (b) O 1s, (c) Zr 3d and (d) F 1s for chemically pre-treated AA2024 and zirconium conversion coated AA2024—as-prepared, and then immersed in 0.5 M NaCl solution for 3 d. ZrCCs were prepared from a 200 ppm H2ZrF6 conversion bath for 3 min. Spectra were not normalized on the intensity scale.
Download figure:
Standard image High-resolution image
Figure 14. High energy resolution XPS spectra (a) Al 2p, (b) O 1s, (c) Zr 3d and (d) F 1s for chemically pre-treated AA7075 and zirconium conversion coated AA7075—as-prepared, and then immersed in 0.5 M NaCl solution for 3 d. ZrCCs were prepared in a 200 ppm H2ZrF6 conversion bath for 10 min. Spectra were not normalized on the intensity scale.
Download figure:
Standard image High-resolution imageAs shown in Table V, Al peaks were not detected for most of the as-prepared ZrCC coated substrates, proving complete coverage with the coating. Only for ZrCC-2024 was an Al peak detected at a binding energy of 75.5 eV, suggesting that ZrCC was very thin, and could be related to aluminium fluoride compounds.
After three days of immersion, for most of the ZrCCs, the peak at 74.4–74.8 eV re-appeared, indicating the formation of Al(OH)3 in the top layer of coating, or the formation of corrosion products. However, in the case of 2024-ZrCC, a broad peak, related to pure Al appeared at 72.8 eV.
For all chemically pre-treated aluminium alloys, the O 1s peaks were centred at 531.7–531.9 eVs, indicating the prevalence of hydroxide over oxide (Figs. 8–14). Qualitatively, three peaks for bound H2O, Al(OH)3 and ZrO2·xH2O, at binding energies at 533 eV, 532 (531.9) eV and 530.5 eV, respectively,101,102 could be identified. After the conversion coating process, the centre of the O 1s peak shifted to Eb 530.8–531.7 eV, depending on the aluminium alloy, and showed a shoulder at 530.5 eV that corresponds to hydrated Zr oxide and oxyfluoride (ZrO2·xH2O/ZrFxOy).
In general, after immersion of ZrCC in NaCl solution, the centre of the O 1s peak shifted back to slightly higher binding energy 531.5–531.7 eV, corresponding to ZrO2·xH2O and Al(OH)3, the only exception being ZrCC-2024. In the latter, the centre shifted from 531.7 eV to 530.5 eV, corresponding to aluminium oxide.
The F 1s peak was centred at Eb 684.6–685.2 eV and was present only for the as-prepared ZrCC, suggesting the presence of ZrF4/ZrFxOy in the top layer (Figs. 8–14). After three days immersion, the F 1s peak disappeared, indicating leaching of fluorine from the conversion coating and transformation of ZrF4/ZrFxOy to ZrO2·xH2O, in accordance with the O 1s peak (Figs. 8–14).
After the conversion coating process, high energy resolution Zr 3d spectra were detected for all aluminium alloys. (Figs. 8–14). The Zr 3d5/2 and 3d3/2 peaks for the as-prepared conversion coatings were centred at 185.0–185.6 eV and 182.7–183.3 eV respectively, depending on the aluminium alloy. This spectrum was related to a mixture of ZrF4/ZrFxOy and ZrO2·xH2O,103 since the coating contained a relatively high fluorine and oxygen concentration (Table V).
After immersion in NaCl solution, the peaks shifted to lower binding energies of 184.5–185.0 eV and 182.1–182.6 eV, respectively, indicating the transformation of Zr-fluoride/oxyfluoride to ZrO2·xH2O. These results correlate with the disappearance of the fluorine peak in the F 1s spectrum. The changes were especially pronounced for ZrCC-2024 and ZrCC-7075, with significantly reduced intensities of the Zr 3d peaks related to the dissolution of ZrCC.
ToF-SIMS characterization
To check the thickness of ZrCCs and their structure, we recorded ToF-SIMS negative ion profiles for as-prepared conditions and for after-immersion in 0.5 M NaCl solution for three days (Figs. 15–16). The sputtering rate was 0.30 nm s−1 (±0.02 nm s−1). The ToF-SIMS ion depth profiles, recorded on areas of 500 μm2, provide a mean conversion coating thickness, determined as based on depth profiles (as described in Experimental), given in Table VI. The boundary between the outer and inner layers was determined as the depth at which the intensity of ZrO− dropped to a half of its value at the layer surface. The depth at which the AlOF− intensity dropped to half its maximum value was taken as marking the boundary between the inner layer and substrate.

Figure 15. ToF-SIMS negative ion depth profiles of zirconium conversion coatings applied on aluminium alloys. The conversion time was 10 min. Full lines—as-prepared ZrCC; dotted lines—ZrCC after 3 d of immersion in 0.5 M NaCl solution. Black vertical dash line — the border between conversion coating and substrate.
Download figure:
Standard image High-resolution image
Figure 16. ToF-SIMS negative ion depth profiles of zirconium conversion coatings applied on aluminium alloys. The conversion time was 10 min. Full lines—as-prepared ZrCC; dotted lines–ZrCC after 3 d of immersion in 0.5 M NaCl solution. Black vertical dash line—the border between conversion coating and substrate; Red vertical dash line—the border between the outer layer and the inner layer.
Download figure:
Standard image High-resolution image
Table VI. The average thickness of zirconium conversion coatings applied on aluminium alloys. ZrCCs were prepared in a 200 ppm H2ZrF6 conversion bath for optimal conversion times (Table I). Coating thickness was determined by the ToF-SIMS method (Fig. 16).
| Aluminium alloy | Thickness, nm |
|---|---|
| 1050A | 60 |
| 2024 | 12 |
| 3005 | 30 |
| A356.0 | 60 |
| 380.0 | 60 |
| 5754 | 60 |
| 7075 | 36 |
The general feature of ZrCCs applied on aluminium alloys was a bi-layer structure with its outer layer having a higher concentration of ZrO− (it could be ZrO2·xH2O/ZrOxFy species) and a lower concentration of AlOF−. Compared to the outer layer, the inner layer had a higher concentration of AlOF− ions and a lower concentration of ZrO− ions. The ToF-SIMS profiles of AlOF− ions were accompanied by profiles for AlO−, MgO− and SiO− ions (Fig. 16). The only exception to this behaviour was ZrCC-2024, which was much thinner than other conversion coatings and had a single-layer structure. An interesting detail to note is that, for all ZrCCs, the intensity of the ZrO− ions profile was higher or the same as that of the AlOF− ions profile. However, in the case ZrCC-3005, the intensity of the AlOF− ions profile was higher than that of the intensity of the ZrO− ions profile.
After three days of immersion in 0.5 M NaCl, the general features of ZrCC-1050A, ZrCC-3005, ZrCC-A356.0, ZrCC-380.0 and ZrCC-5754, which showed adequate corrosion protection, were as follows. The profiles of ZrO− ions were similar, having a maximum in the outer layer (Fig. 16). The intensities of F− and AlOF− ion profiles decreased significantly, while that of Cl− ions increased. The latter followed the same shape as that of F− ions. This suggests that Cl− ions were exchanged with F− ions and incorporated within the ZrCC structure. Compared to as-prepared coatings, the intensity of the AlO− profile was larger in the outer layer, reaching a maximum (most pronounced for ZrCC-3005) and then forming a plateau in the inner part of ZrCC. This trend indicates that, on immersion in NaCl solution, the coatings, especially the outer layers, become enriched in aluminium oxide/hydroxide. For the ZrCC-3005 the enrichment in AlO− was also pronounced at the inner layer/substrate interface, which could be the reason for the excellent performance of this particular coating. On immersion in NaCl, the AlOF− profile follows the opposite trend to that of AlO−, and becomes strongly diminished in the outer layers, suggesting that it is gradually transformed to AlO−. These transformations could be one of the reasons for the improved corrosion resistance of ZrCCs. The MgO− profile decreased and shifted more deeply toward the interface with the substrate. For the majority of alloys containing Si the intensity of SiO− profiles shifted towards the surface, possibly indicating incorporation of Si into the coating structure.
ZrCC-2024 and ZrCC-7075 displayed different trends in their negative ion profiles after immersion in NaCl. The intensities of the ion profiles for ZrO−, AlOF−, AlO− decreased significantly for both alloys and was much lower compared to other aluminium alloys. The intensity of Cl− profiles increased significantly for both alloys, however in case of ZrCC-7075 was much higher compared to other profiles. These results indicate that ZrCC-2024 and ZrCC-7075 dissolved and were covered with corrosion products. For ZrCC-2024, the intensity of CuO− ion profiles increased while, for ZrCC-7075, that of FeO− increased. Based on these results, ZrCC-2024 and ZrCC-7075 were not stable and, thus, did not provide proper corrosion protection during immersion in 0.5 M NaCl.
Discussion
Electrochemical impedance spectroscopy measurements showed that the corrosion resistance of ZrCC-3005 increased continuously over five days of immersion in 0.5 M NaCl solution. That of ZrCC-1050A and ZrCC-A356.0 increased for up to three days but, on the fourth day of immersion, the average impedance modulus at low frequency decreased, indicating that pitting had occurred. The same trend was noted for ZrCC-5754 and ZrCC-380.0, but to a lesser extent. The impedance moduli for these two alloys showed similar trends at the beginning but then decreased slowly, reaching values of ca. 1 MΩ·cm2 on the fifth day of immersion. On the other hand, after 1 h immersion, ZrCC-2024 and ZrCC-7075 showed the highest impedance moduli of all ZrCCs, which then decreased significantly, indicating that pitting had already occurred and that ZrCC-2024 and ZrCC-7075 did not provide proper corrosion protection.
SEM-EDS and XPS analyses showed that, during the immersion of ZrCC-1050A, ZrCC-3005, ZrCC-A356.0, ZrCC-380.0 and ZrCC-5754 in 0.5 M NaCl fluorine leached out of the coating. The concentration of oxygen increased while that of Zr remained at approximately the same level. High-resolution XPS spectra showed that, in the top parts of the coatings, ZrF4/ZrOxFy were transformed into ZrO2·xH2O which was accompanied by the formation of Al(OH)3.
ToF-SIMS depth profiles of ZrCC-1050A, ZrCC-3005, ZrCC-A356.0, ZrCC-380.0 and ZrCC-5754 had similar shapes and showed similar trends during immersion in chloride solution. Fluorine was leached out from ZrCCs, but zirconium oxide was stable after three days of immersion. At the same time, the AlO− profile increased, indicating an increased concentration of aluminium oxide/hydroxide in the ZrCCs. Transformation of ZrF4/ZrOxFy into ZrO2·xH2O and incorporation of Al(OH)3 was responsible for the self-sealing of ZrCCs that provided increased corrosion resistance during immersion in 0.5 M NaCl solution. However, ZrCC-A356.0 and ZrCC-380.0 were pitted at Zn-rich IMPs/spots during immersion in 0.5 M NaCl.
For ZrCC-2024 and ZrCC-7075, the SEM-EDS, XPS, and ToF-SIMS analyses showed that the coatings were not stable during immersion in chloride solution. Fluorine leached out but, at the same time, ZrO2 dissolved and was covered with corrosion products of Al(OH)3, indicating that ZrCC did not provide proper corrosion protection for these two alloys. ZrCC-2024 had a small average thickness of 12 nm, but SEM-EDS analysis showed that it was significantly thicker at Cu-rich IMPs than at the matrix. The small and unbalanced thickness of ZrCC-2024 was the main reason for the inadequate corrosion protection. We assume that, with adequate surface pretreatment that will dissolve large Cu-rich IMPs and redeposit Cu in the form of small cathodic sites, ZrCC-2024 would perform much better. In the case of ZrCC-7075, the average coating thickness (36 nm) was significantly greater than that of ZrCC-2024 (12 nm) and uniform across the substrate surface. Our opinion, based on microstructural analysis and electrochemical data, is that the main reason for the corrosion protection of ZrCC-7075 being poor was that the content of Zn in the matrix was too high (5.81 wt.%). Even for ZrCC-A356.0 and ZrCC-380.0, which contain substantially lower contents of Zn in the matrix (0.07 and 1.2 wt.%, respectively), the pitting was initiated at Zn-rich areas. Proper surface pretreatment for AA7075 before applying ZrCC could improve the performance of ZrCC significantly. Optimal pretreatment for AA7075 should remove or passivate Zn-rich IMPs at the alloy surface before the application of ZrCC.
Conclusions
- 1.Zirconium conversion coatings (ZrCCs) provided excellent corrosion protection for aluminium alloys 3005 and A356.0 and very good corrosion protection for aluminium alloys 1050A, 380.0 and 5754.
- 2.Zirconium conversion coatings did not provide adequate corrosion protection for aluminium alloys 2024 and 7075 due to the detrimental effect of Cu- and Zn-based intermetallics.
- 3.The coating had a bi-layer structure and a thickness in the range of 30 nm to 60 nm. The exception was ZrCC-2024, which had a single-layer structure and was, on average, only 12 nm thick with a very unbalanced thickness between IMPs and matrix.
- 4.During immersion in 0.5 M NaCl, the average impedance modulus ∣Z∣3mHz of ZrCC-3005 increased continuously for up to five days: that for ZrCC-1050A and ZrCC-A356.0 increased for up to three days and those for ZrCC-380.0 and ZrCC-5754 for up to 1 d. The increase in ∣Z∣3mHz indicates self-sealing of the coating.
- 5.ZrCC-2024 and ZrCC-7075 had the highest impedance modulus at the beginning of the immersion but, after only one day, the values dropped, indicating inadequate corrosion protection.
- 6.During immersion in 0.5 M NaCl, fluorine leached out of the ZrCC, ZrF4/ZrFxOy was transformed into ZrO2·xH2O, and aluminium oxide/hydroxide was incorporated into a coating structure leading to self-sealing of ZrCC.
- 7.Corrosion damage and pitting were initiated at Zn-rich areas in ZrCC-A356.0, ZrCC-380.0 and ZrCC-7075.
Acknowledgments
The authors thank Tatjana Filipič, MSc, for XPS and ToF-SIMS measurements (Department of Surface Engineering and Optoelectronics, Jožef Stefan Institute). We acknowledge the Centre of Excellence Nanocenter for allowing us to use the FEI Helios Nanolab 650 microscope. The editing of the manuscript by prof. R.H. Pain is kindly acknowledged.
Funding
This research was funded by the Slovenian Research Agency, research core funding grant number PR-07023, P2-0393 and P2-0082.
Footnotes
- a
Aluminum Association designation.
- b
EN AW = European standard (Euronorm) Aluminium Wrought.
- c
UNS = Unified numbering system.
- d
EN AC = European standard (Euronorm) Aluminium Cast.