Abstract
We report a model of the cathode catalyst layer (CCL) impedance, which includes impedances due to oxygen transport in the Nafion film covering Pt/C agglomerates, and due to oxygen transport through the CCL depth. In the case of small cell current density, analytical solutions for the CCL impedance Zccl are derived; for larger currents, we analyze numerical solution for Zccl. The characteristic frequencies of the oxygen transport through the Nafion film and through the CCL depth are close to each other, and the contribution of the Nafion film impedance ZN to Zccl is small up to the current densities ≃ 100 mA cm− 2. This makes it difficult reliable determination of ZN from experimental spectra of a standard 10 μm–thick CCL. However, with the decrease in the CCL thickness, the relative contribution of ZN to Zccl increases. It gives us a chance to determine ZN by fitting the models of this work to measured spectra of a low–loaded MEA with a thin CCL. An example of fitting the model to a synthetic numerical impedance is given.
Export citation and abstract BibTeX RIS

This is an open access article distributed under the terms of the Creative Commons Attribution 4.0 License (CC BY, http://creativecommons.org/licenses/by/4.0/), which permits unrestricted reuse of the work in any medium, provided the original work is properly cited.
Polymer electrolyte membrane fuel cells are ready to take their place in the spectrum of electrochemical sources powering the future society. Still, however, a lot needs to be done to improve stability and reduce the cost of these cells. Development of simple and robust ex situ characterization techniques for the fuel cell research and applications (cars, home appliances etc.) is an urgent task.
It is generally accepted that the impedance technique gives much more information on a PEM fuel cell, than the DC methods.1,2 One of the key problems in understanding impedance spectra is development of physics–based impedance models, which are fast enough to be used in numerical algorithms for fitting experimental spectra. In spite of numerous efforts in this field,3–19 some important questions remain unresolved.
PEMFC impedance is determined mainly by the cathode catalyst layer (CCL). The kinetics of oxygen reduction reaction (ORR) are sluggish and the oxygen transport through the catalyst layer is slow; thus, the CCL gives the major contribution to the cell impedance. SEM pictures show that a typical CCL is a porous structure formed by numerous spherical agglomerates of Pt/C particles covered by Nafion film.20,21 Recent experiments of Singh et al.22 have shown that the addition of Nafion significantly changes the catalyst layer impedance. At medium and large overpotentials, the presence of Nafion leads to formation of the second, low–frequency arc in the impedance spectrum of the electrode, which is associated by the authors with the oxygen transport in Nafion film covering Pt/C agglomerates.22
The nature of the oxygen transport loss in the CCL is still controversial. Basically, this loss can be associated with the oxygen transport in agglomerates, and with the oxygen transport through the CCL depth. What is the contribution of each mechanism into the total transport loss in the CCL, and how can we separate and quantify each mechanism? Answering these questions is a challenge for the fuel cell modeling community.
Numerous papers have been devoted to static polarization curve modeling, taking into account Nafion–covered Pt/C agglomerates; references can be found in a recent work.23 One of the first physics–based models for PEMFC cathode impedance has been developed by Springer et al.3 The underlying transient model for the CCL performance was based on standard macro–homogeneous equations for the charge and oxygen mass conservation; no explicit account of the oxygen transport in agglomerates was done. A first attempt to incorporate the effect of oxygen transport in Pt/C agglomerates has seemingly been done by Raistrick.24 He considered a planar agglomerate at the surface of a pore having a form of a slit. An equation for the perturbed oxygen concentration in the agglomerate has been derived; the solution for the pore impedance was obtained numerically. Recent SEM pictures show, however, that the agglomerates are spherical rather than the planar structures.20,21 Jaouen and Lindbergh5 considered oxygen transport in spherical agglomerates in their impedance model of the CCL; however, they neglected oxygen transport through the electrode depth. The electrode impedance was calculated numerically in their work. Similar numerical impedance model with neglect of the oxygen transport through the CCL depth has been developed by Gerteisen et al.8 It is worth noting that Gerteisen et al. assumed that the agglomerates are fully filled with Nafion. In a recent paper, Gerteisen developed a numerical impedance model of the CCL, which includes oxygen transport through the CCL depth and through the Nafion film covering agglomerate.25 However, the transport in the Nafion film/agglomerate was assumed to be infinitely fast, and hence this transport contributes to the real component of impedance only, i.e., it merely shifts the impedance spectrum as a whole along the real axis.
In this work, we report a model of the CCL impedance, which includes transient oxygen transport equations in the spherical Pt/C agglomerates and through the CCL depth. The agglomerate is assumed to be covered by a thin spherical Nafion film, while the agglomerate interior volume is filled with water. First, we construct a system of transient equations for the CCL performance; this system is then linearized and Fourier–transformed to yield a system of equations for the AC perturbation amplitudes. In the case of small cell current density, this system is solved and the analytical expression for the CCL impedance is derived. For larger currents (see below), we analyze numerical solution for the CCL impedance.
Impedance Model
A conceptual picture of the CCL structure suggested by Liu et al.26 is depicted in Figure 1. Spherical agglomerates of Pt/C particles covered by Nafion film form a contiguous cluster, which provides proton transport to the catalyst sites. The void space between agglomerates serves as a pathway for oxygen transport through the CCL depth. To reach Pt particles, oxygen must be dissolved and transported through the Nafion film.
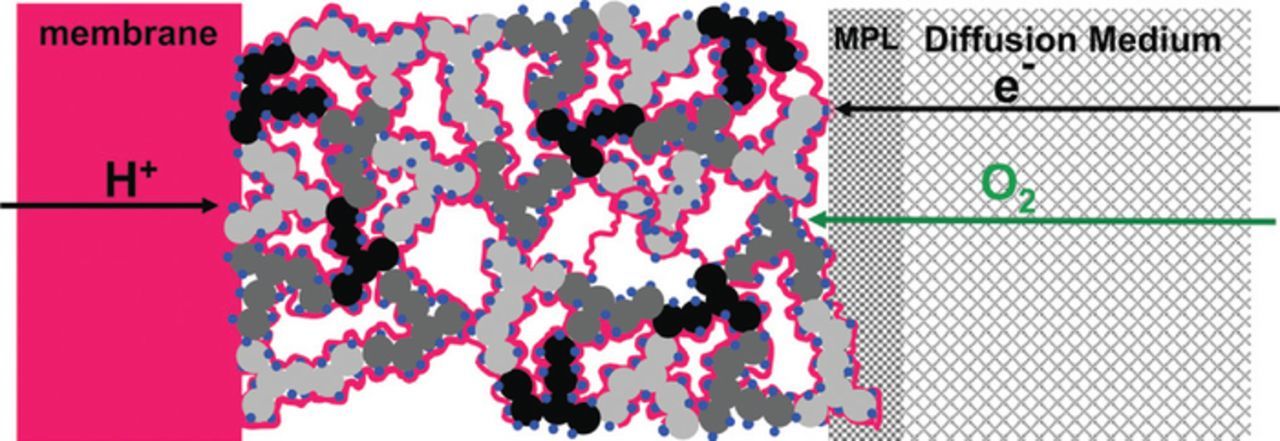
Figure 1. Conceptual sketch of a PEMFC electrode composed of catalyzed high-surface area high-structure carbon-support and proton-conducting ionomer. Gray- and black-shaded structures: primary carbon- support agglomerates with high electronic conductivity; blue dots: catalytically active platinum or platinum-alloy nanoparticles; red lines and red block: proton-conducting ionomer films on the carbon-support and ionomeric membrane; gray-shaded blocks: electron and gas-conducting gas diffusion medium and micro-porous layer (MPL). Reprinted with permission from Ref. 21.
Transient equations
An elementary unit of the structure in Figure 1 providing electrochemical conversion is a single agglomerate. Below, we will consider a spherical agglomerate of Pt/C particles, covered by a thin Nafion film. Let the agglomerate radius, including Nafion film be Ra, and the thickness of the Nafion film be dN (Figure 2).

Figure 2. Cartoon of the spherical agglomerate of Pt/C particles covered by a Nafion film of the thickness dN.
To derive a model for the CCL impedance, we need transient conservation equations for oxygen in agglomerate and a transient performance model for the whole CCL. The oxygen transport equations in the Nafion film and in the agglomerate read
![Equation ([1])](https://content.cld.iop.org/journals/1945-7111/164/4/F379/revision1/d0001.gif)
![Equation ([2])](https://content.cld.iop.org/journals/1945-7111/164/4/F379/revision1/d0002.gif)
where t is time, r is the radial coordinate, DN and Da are the oxygen diffusion coefficients in the Nafion film and in the agglomerate, respectively, cN, ca are the oxygen concentrations in the Nafion and agglomerate, respectively, cref is the reference oxygen concentration, i* is the electrode volumetric exchange current density (A cm− 3), η is the ORR overpotential, positive by convention, and b is the ORR Tafel slope. Note that Eq. 1 contains the ORR rate on the right side, which means that the reaction runs also in the Nafion film (see discussion below).
To link the CCL and agglomerate models, consider a cylindrical pore of the radius Rp in the catalyst layer, with the pore walls formed by agglomerates (Figure 3). The oxygen mass transport equation along the pore reads
![Equation ([3])](https://content.cld.iop.org/journals/1945-7111/164/4/F379/revision1/d0003.gif)
where x is directed along the pore axis, and ρ is the radial position in cylindrical coordinates (ρ, x). The right side of Eq. 3 is the divergence of the oxygen flux through the unit surface of the pore cylinder.
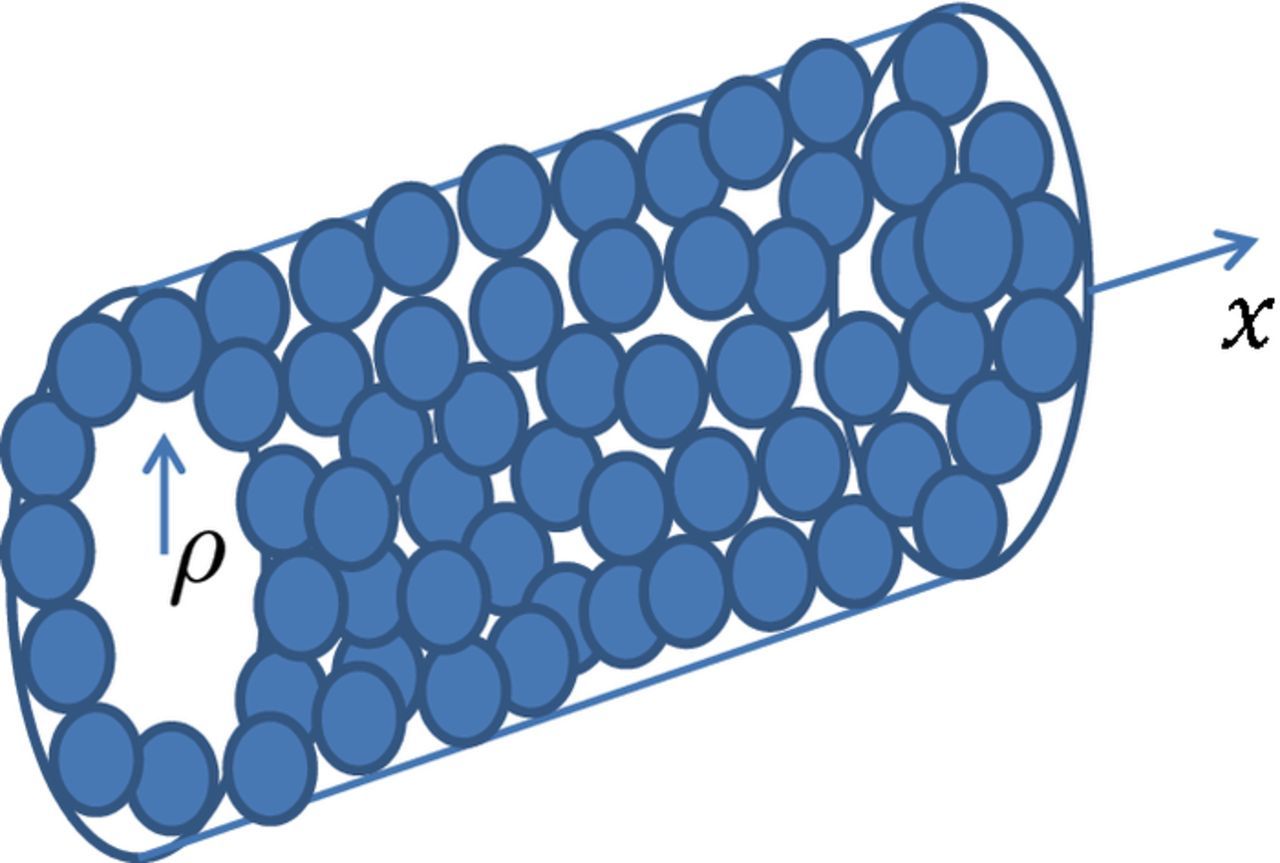
Figure 3. Schematic of a CCL pore; the pore walls are formed by Pt/C agglomerates.
The meaning of the divergence operator in Eq. 3 needs to be specified. This operator represents a divergence of the oxygen flux through the side wall of the cylindrical pore formed by agglomerates partly penetrating into the pore volume (Figure 3). To calculate this divergence we note, that in the limit of Da = DN = ∞, the right side of Eq. 3 must transform to the standard macro–homogeneous ORR rate.27 This requirement leads to the following relation
![Equation ([4])](https://content.cld.iop.org/journals/1945-7111/164/4/F379/revision1/d0004.gif)
where
![Equation ([5])](https://content.cld.iop.org/journals/1945-7111/164/4/F379/revision1/d0005.gif)
is the oxygen flux through the unit agglomerate surface. With this, Eq. 3 transforms to
![Equation ([6])](https://content.cld.iop.org/journals/1945-7111/164/4/F379/revision1/d0006.gif)
Below, we will see that the right side of Eq. 6 depends on the local overpotential η, which varies with x. The proton charge balance equation, including Ohm's law for the proton transport is
![Equation ([7])](https://content.cld.iop.org/journals/1945-7111/164/4/F379/revision1/d0007.gif)
Here, the right side describes the "sink" of overpotential consistent with the sink of oxygen in Eq. 6. Physically, the rates of oxygen consumption and proton current conversion along the pore axis must be coupled by the Faraday law. The chain of Equations 1, 2, 6 and 7 describe oxygen transport along the void pore in the CCL, with the sink through the Nafion film to the water–filled agglomerates of Pt/C particles.
It is convenient to introduce dimensionless variables
![Equation ([8])](https://content.cld.iop.org/journals/1945-7111/164/4/F379/revision1/d0008.gif)
where the characteristic time t* is given by
![Equation ([9])](https://content.cld.iop.org/journals/1945-7111/164/4/F379/revision1/d0009.gif)
With the dimensionless variables 8, the system 1, 2, 6, 7 transforms to the agglomerate model
![Equation ([10])](https://content.cld.iop.org/journals/1945-7111/164/4/F379/revision1/d0010.gif)
![Equation ([11])](https://content.cld.iop.org/journals/1945-7111/164/4/F379/revision1/d0011.gif)
and the pore (CCL) model
![Equation ([12])](https://content.cld.iop.org/journals/1945-7111/164/4/F379/revision1/d0012.gif)
![Equation ([13])](https://content.cld.iop.org/journals/1945-7111/164/4/F379/revision1/d0013.gif)
where the parameters δ, β and ε are given by
![Equation ([14])](https://content.cld.iop.org/journals/1945-7111/164/4/F379/revision1/d0014.gif)
and the flux  is nondimensionalized according to
![Equation ([15])](https://content.cld.iop.org/journals/1945-7111/164/4/F379/revision1/d0015.gif)
The boundary conditions to the system 10, 11 express continuity of the oxygen concentration and flux at the Nafion/agglomerate interior interface ( ), and symmetry of the oxygen concentration profile at
  :
:
![Equation ([16])](https://content.cld.iop.org/journals/1945-7111/164/4/F379/revision1/d0016.gif)
![Equation ([17])](https://content.cld.iop.org/journals/1945-7111/164/4/F379/revision1/d0017.gif)
Here,
![Equation ([18])](https://content.cld.iop.org/journals/1945-7111/164/4/F379/revision1/d0018.gif)
is the dimensionless thickness of the Nafion film, and  is the dimensionless concentration of oxygen dissolved in Nafion at the film outer surface. This concentration is related to the gaseous oxygen concentration in the void pores of the CCL
  by the Henry's law with the constant Kox (mol/mol):
![Equation ([19])](https://content.cld.iop.org/journals/1945-7111/164/4/F379/revision1/d0019.gif)
The boundary conditions to Eqs. 12 and 13 are
![Equation ([20])](https://content.cld.iop.org/journals/1945-7111/164/4/F379/revision1/d0020.gif)
![Equation ([21])](https://content.cld.iop.org/journals/1945-7111/164/4/F379/revision1/d0021.gif)
The first of Eq. 20 means zero oxygen flux in the membrane, while the second fixes the oxygen concentration at the CCL/GDL interface. The first of Eq. 21 fixes the total ORR overpotential at the membrane interface, and the second expresses zero proton current to the GDL.
Linearization and Fourier transform
To obtain the CCL impedance, we apply a small–amplitude harmonic perturbation of potential to the CCL. Due to smallness of the AC signal, the response of the system is linear and harmonic, and we can write
![Equation ([22])](https://content.cld.iop.org/journals/1945-7111/164/4/F379/revision1/d0022.gif)
where  is the dimensionless angular frequency of the applied signal, and the superscripts 0 and 1 indicate the steady–state profile and the small–amplitude perturbation, respectively.
The equations for static shapes are obtained from Eqs. 10–13 by chalking out the time derivatives. Substituting 22 into the system 10–13, subtracting the static equations and neglecting the terms with the perturbation products, we get a system of linear equations for the perturbation amplitudes of the agglomerate model
![Equation ([23])](https://content.cld.iop.org/journals/1945-7111/164/4/F379/revision1/d0023.gif)
![Equation ([24])](https://content.cld.iop.org/journals/1945-7111/164/4/F379/revision1/d0024.gif)
and for these amplitudes of the CCL model
![Equation ([25])](https://content.cld.iop.org/journals/1945-7111/164/4/F379/revision1/d0025.gif)
![Equation ([26])](https://content.cld.iop.org/journals/1945-7111/164/4/F379/revision1/d0026.gif)
Here,
![Equation ([27])](https://content.cld.iop.org/journals/1945-7111/164/4/F379/revision1/d0027.gif)
is the flux of dissolved oxygen perturbation through the outer surface of Nafion film. The boundary conditions to the system 23–26 are
![Equation ([28])](https://content.cld.iop.org/journals/1945-7111/164/4/F379/revision1/d0028.gif)
![Equation ([29])](https://content.cld.iop.org/journals/1945-7111/164/4/F379/revision1/d0029.gif)
and
![Equation ([30])](https://content.cld.iop.org/journals/1945-7111/164/4/F379/revision1/d0030.gif)
![Equation ([31])](https://content.cld.iop.org/journals/1945-7111/164/4/F379/revision1/d0031.gif)
As can be seen, the problem 23–26 is split into the local problem for  and
and  in a single agglomerate and the global problem for the through–plane shapes of
  and
and  . The local problem is given by Eqs. 23, 24 with
  being a parameter. The global CCL problem is given by Eqs. 25, 26, with
  resulting from solution of the local problem.
Solution for the local oxygen flux
The static shapes of the oxygen concentration in the agglomerate and in Nafion film are
![Equation ([32])](https://content.cld.iop.org/journals/1945-7111/164/4/F379/revision1/d0032.gif)
![Equation ([33])](https://content.cld.iop.org/journals/1945-7111/164/4/F379/revision1/d0033.gif)
Due to agglomerate smallness, the overpotential  is assumed to be independent of
  . The expressions for coefficients in Eqs. 32, 33 are very cumbersome and not displayed here. Exact solution to the problem 23, 24 for the perturbation amplitudes
  and
and  can be obtained with the aid of mathematical software. For the CCL problem 25, 26 we need only an expression for the perturbation of the oxygen concentration flux
  trough the Nafion film outer surface, Eq. 27. This flux can be represented as
![Equation ([34])](https://content.cld.iop.org/journals/1945-7111/164/4/F379/revision1/d0034.gif)
Unfortunately, the exact expressions for the coefficients  and
and  are very cumbersome. However, in this problem,
  and
and  are large, while
  is small.Performing asymptotic expansion of the exact
  over
over  , Taylor series expansion over , and neglecting the terms on the order of
  ,
,  and O(2), we come to a compact result
![Equation ([35])](https://content.cld.iop.org/journals/1945-7111/164/4/F379/revision1/d0035.gif)
![Equation ([36])](https://content.cld.iop.org/journals/1945-7111/164/4/F379/revision1/d0036.gif)
Note that at leading order, the terms with  vanish, as
  . Note also that in the limit of
  , Eqs. 35, 36 simplify to
  ,
,  , and in Eqs. 25, 26 we get the standard macro–homogeneous expressions for the Tafel ORR rate.
Results and Discussion
Fast oxygen transport through the CCL depth
Before we proceed to numerical solution of the CCL system 25, 26, it is advisable to consider the limit of fast oxygen transport through the CCL depth. Note that considering this limit only makes sense if the cell current density is small; the respective criterium is given in the next section. In this case, in the system 25, 26 we can set  (fast oxygen transport), and
  ,
,  (small cell current density). With these changes,
  ,
,  is independent of
  parameter and Eq. 26 can easily be solved. By definition, the CCL impedance is
![Equation ([37])](https://content.cld.iop.org/journals/1945-7111/164/4/F379/revision1/d0037.gif)
Using here the solution to Eq. 26 we get
![Equation ([38])](https://content.cld.iop.org/journals/1945-7111/164/4/F379/revision1/d0038.gif)
The spectrum of impedance Eq. 38 is shown in Figure 4 together with the charge–transfer and proton transport impedance  corresponding to zero oxygen transport losses in the agglomerate. The spectrum of
  is obtained from Eq. 38 by passing to the limit
  . Noting that at small cell currents, the polarization curve of the CCL is given by the Tafel equation
![Equation ([39])](https://content.cld.iop.org/journals/1945-7111/164/4/F379/revision1/d0039.gif)
for the coupled charge–transfer and proton transport impedance  we find12
![Equation ([40])](https://content.cld.iop.org/journals/1945-7111/164/4/F379/revision1/d0040.gif)
In dimension form this impedance reads
![Equation ([41])](https://content.cld.iop.org/journals/1945-7111/164/4/F379/revision1/d0041.gif)
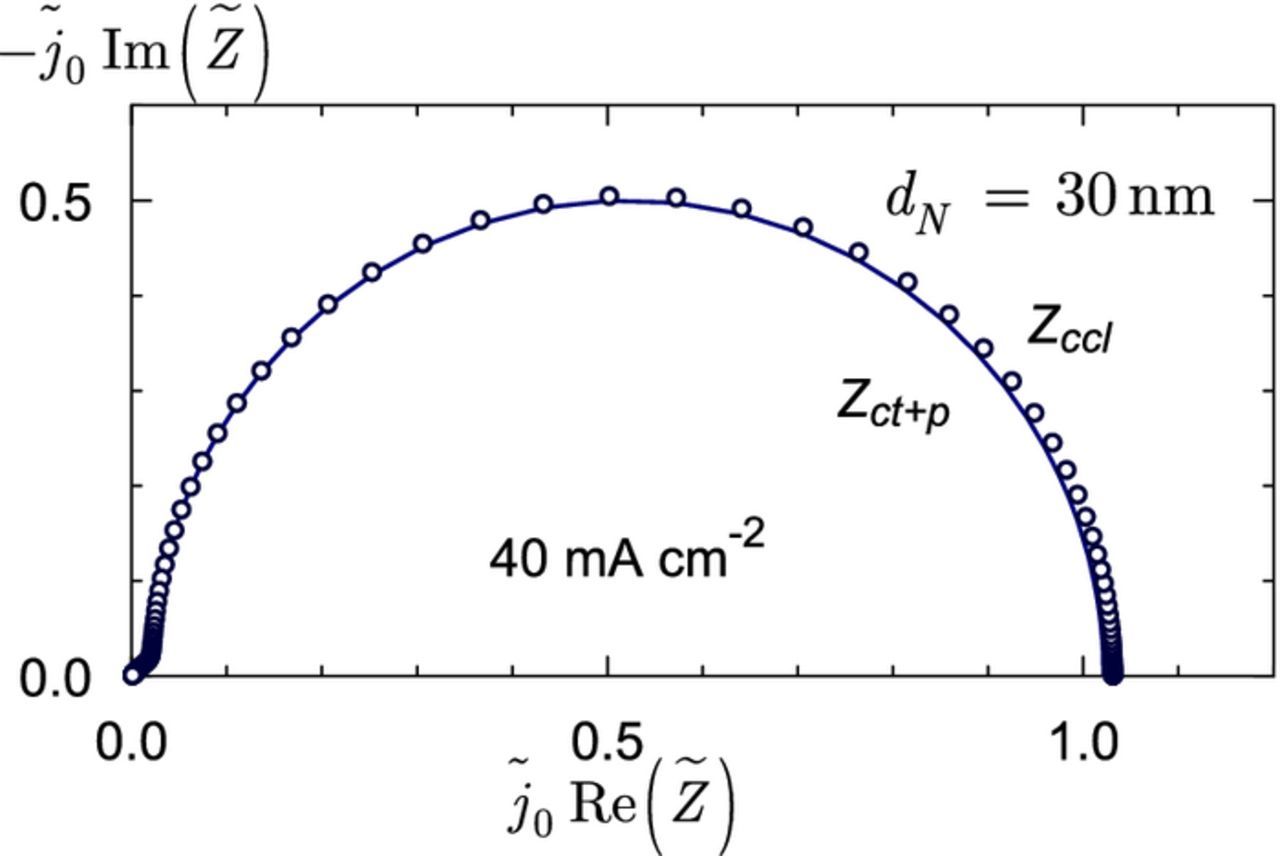
Figure 4. Line – the charge–transfer plus proton transport spectrum corresponding to zero transport losses in the agglomerate. Points – the spectrum including the Nafion film thickness of 30 nm. The ORR overpotential is 420 mV, which corresponds to the cell current density of 40 mA cm− 2 The other parameters are listed in Table I. Note the coordinates  .
.
The charge–transfer and the total Zccl spectra are very close to each other (Figure 4). Note that the difference is visible due to the upper estimate of the Nafion film thickness of 30 nm taken for the calculations; for a more realistic value of dN = 10 nm, the spectra in Figure 4 would be indistinguishable. Nonetheless, Figure 4 gives us a hope that for higher currents and lower oxygen concentrations, the effect of Nafion film could be measurable.
From Eq. 38 we can obtain the formula for the CCL static resistivity  . In PEMFCs, the parameter is large, typically ≃ 102–103. Setting in Eq. 38
  , expanding the result over and calculating asymptotic expansion over , at leading order we get
![Equation ([42])](https://content.cld.iop.org/journals/1945-7111/164/4/F379/revision1/d0042.gif)
In dimension form, Eq. 42 reads
![Equation ([43])](https://content.cld.iop.org/journals/1945-7111/164/4/F379/revision1/d0043.gif)
The first term on the right side is the CCL resistivity to proton transport. The second term is the Faraday charge–transfer resistivity. The third term represents the oxygen transport resistivity of the Nafion film.
Remarkably, the Nafion film resistivity is inversely proportional to the CCL thickness lt, Eq. 43. Figure 3 helps to understand this effect. Indeed, individual agglomerates are connected to the pore volume as parallel resistivities; thus, the longer the representative pore, the more agglomerates we have along the pore, and the smaller the total resistivity of the agglomerates ensemble.
Subtracting  from
from  , we get an explicit expression for the Nafion film impedance
![Equation ([44])](https://content.cld.iop.org/journals/1945-7111/164/4/F379/revision1/d0044.gif)
where ϕ and ϕ0 are given in Eqs. 38 and 40. Eq. 44 can be simplified: expanding the right side over small , and calculating asymptotic expansion of the result over large , at leading order we find
![Equation ([45])](https://content.cld.iop.org/journals/1945-7111/164/4/F379/revision1/d0045.gif)
In dimension form, Eq. 45 reads
![Equation ([46])](https://content.cld.iop.org/journals/1945-7111/164/4/F379/revision1/d0046.gif)
Figure 5 shows that Eq. 46 provides a good approximation of the exact expression 44.
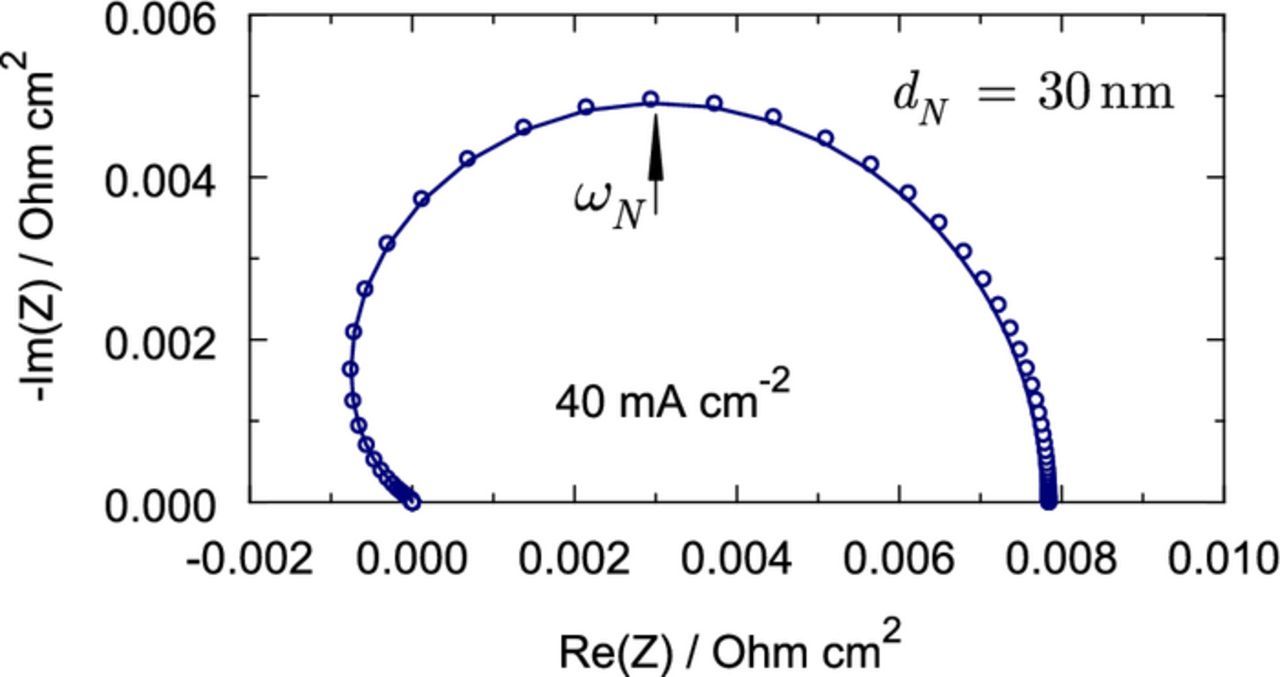
From Eq. 45 we can get the characteristic (summit) frequency ωN of the Nafion film impedance (Figure 5). Clearly, at this frequency the following relation holds:  . Calculating this derivative with Eq. 45, we come to
![Equation ([47])](https://content.cld.iop.org/journals/1945-7111/164/4/F379/revision1/d0047.gif)
where  . With the parameters in Table I and j0 = 40 mA cm− 2, for the regular frequency fN = ωN/(2π) we get fN ≃ 6 Hz.
Table I. Parameters used in calculations. To emphasize the effects of oxygen transport in the Nafion film, the film thickness is taken to be 30 nm.
| Agglomerate radius Ra, cm | 10− 5 |
| Nafion film thickness dN, cm | 3 · 10− 6 |
| Catalyst layer thickness lt, cm | 10− 3 |
| Oxygen diffusion coefficient in agglomerate | |
| (in water) Da, cm2 s− 1 (Ref. 30) | 4 · 10− 5 |
| Oxygen diffusion coefficient in Nafion film | |
| DN, cm2 s− 1 (Ref. 31) | 0.85 · 10− 6 |
| Oxygen diffusion coefficient through the | |
| CCL depth Dox, cm2 s− 1 (upper estimate) | 10− 4 |
| Exchange current density i*, A cm− 3 | 10− 2 |
| ORR Tafel slope b, V | 0.03 |
| CCL proton conductivity σp, Ω cm− 1 | 0.02 |
| Cell temperature T, K | 273 + 70 |
| Henry constant for oxygen solubility | |
| in water Kox, mol mol− 1 | 0.032 |
Finite rate of oxygen transport through the CCL depth
Small cell current density
The cell current density is small, if it obeys to19
![Equation ([48])](https://content.cld.iop.org/journals/1945-7111/164/4/F379/revision1/d0048.gif)
Physically, j0 must be much less than the characteristic current densities for the proton transport jp and the oxygen transport jox in the CCL. If Eq. 48 holds, the CCL impedance is well approximated by the sum of the three impedances:
![Equation ([49])](https://content.cld.iop.org/journals/1945-7111/164/4/F379/revision1/d0049.gif)
where Zct + p and ZN are given by Eqs. 41 and 46, respectively. The low–current oxygen transport impedance Zox is given by28
![Equation ([50])](https://content.cld.iop.org/journals/1945-7111/164/4/F379/revision1/d0050.gif)
where
![Equation ([51])](https://content.cld.iop.org/journals/1945-7111/164/4/F379/revision1/d0051.gif)
are the characteristic frequencies, and
![Equation ([52])](https://content.cld.iop.org/journals/1945-7111/164/4/F379/revision1/d0052.gif)
is the Warburg–like impedance. In Eq. 49, ZN is obtained as a solution of the CCL problem neglecting Zox, and Zox is obtained in Ref. 28 as a solution of the CCL problem neglecting ZN. In the limit of small j0, the total impedance is a sum of all the three impedances, Eq. 49. Figure 6 illustrates this statement.
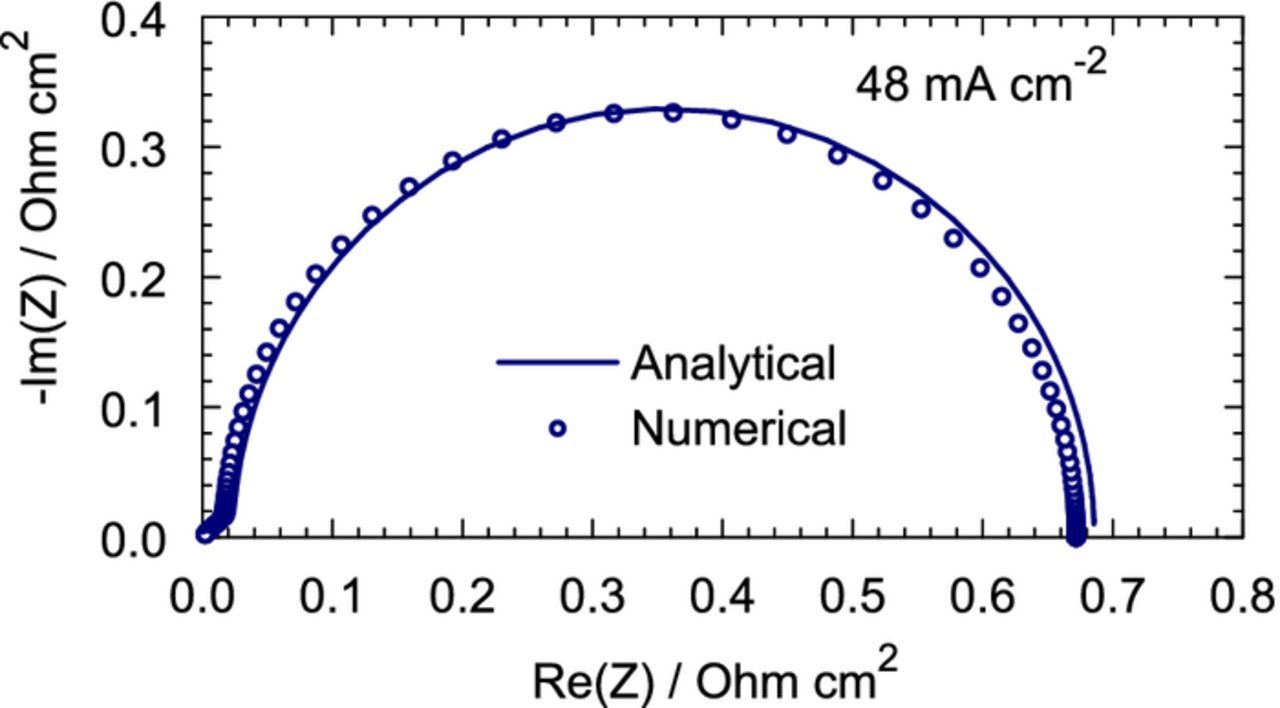
Figure 6. Analytical, Eq. 49 (solid line) and numerical (points) CCL impedance.
Further, if j0 is small, we can simply add to Eq. 43 the term describing the CCL resistivity due to oxygen transport through the CCL depth28, which yields
![Equation ([53])](https://content.cld.iop.org/journals/1945-7111/164/4/F379/revision1/d0053.gif)
This equation can also be obtained by passing to the limit ω = 0 in Eq. 49.
It is advisable to compare the third and fourth terms in Eq. 53. With the data from Table I, for these terms we get RN ≃ 8 mOhm cm2 and Rox ≃ 35 mOhm cm2, respectively. Thus, the Nafion film resistivity is more than four times lower, than the through–plane oxygen transport resistivity. Note that the through–plane oxygen difffusivity Dox taken for the estimate is an upper value; standard MEA may exhibit three to four times lower Dox.19 In this case, RN would be more than an order of magnitude lower than Rox.
It is useful to compare the characteristic summit frequencies of the oxygen transport in Nafion film, Eq. 47 and of the through–plane oxygen transport. The latter frequency is given by28
![Equation ([54])](https://content.cld.iop.org/journals/1945-7111/164/4/F379/revision1/d0054.gif)
With the data from Table I and the current density of 50 mA cm− 2, we get fox = ωox/(2π) ≃ 40 Hz. The value of fN estimated above is 6 Hz, i.e., the Nafion film and through–plane transport impedances are well separated in the frequency domain. However, the frequency gap between fN and fox would be zero for the oxygen diffusion coefficient Dox ≃ 1.5 · 10− 5 cm2 s− 1, which is quite a realistic value for standard Pt/C electrodes.19 In that case both the transport losses are indistinguishable by impedance methods.
Medium cell current density
Eqs. 35, 36 are derived assuming that  is large. In 32,
  appears in the combination
  . Thus, the approximation of large
  works as long as
  ; this limits the cell current density by the value of 250 mA cm− 2. For the currents just below this value, we have to solve the Equations 25, 26, taking into account that the expression for the flux
  , Eqs. 34 contains the
  –dependent static shapes of
  and
and  . These shapes obey to the static version of Eqs. 12, 13 with the right sides being the local ORR rate in the agglomerate:
![Equation ([55])](https://content.cld.iop.org/journals/1945-7111/164/4/F379/revision1/d0055.gif)
![Equation ([56])](https://content.cld.iop.org/journals/1945-7111/164/4/F379/revision1/d0056.gif)
Here, the right side is calculated as  with
with  given by Eq. 33.
The CCL impedance spectra resulting from solution of the general problem 25, 26 with the static shapes from Eqs. 55, 56 are shown in Figure 7. As can be seen, the Nafion film contribution to the CCL impedance is small but visible already at the cell current density on the order of 100 mA cm− 2, and it increases with the current (Figure 7).
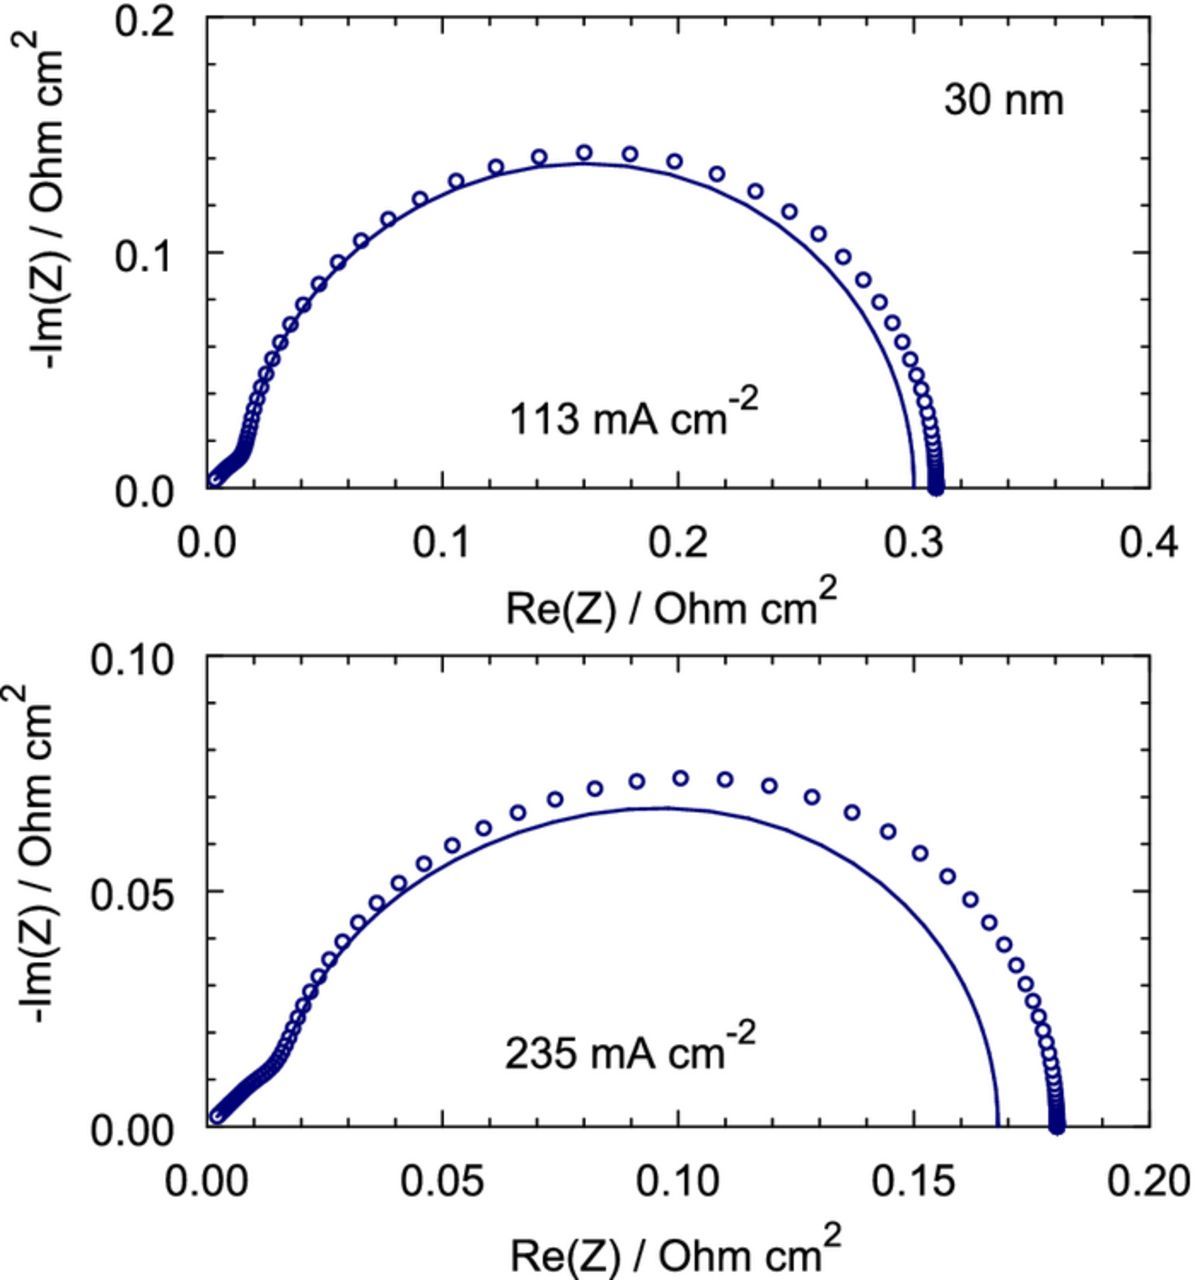
Figure 7. Lines – the spectra corresponding to zero transport losses in the Nafion film. Points – the spectra, which include the Nafion film impedance. The parameters for calculations are listed in Table I.
Figure 8 shows the components of the total CCL impedance at the current density of 235 mA cm− 2. The largest contribution gives the oxygen transport through the CCL depth; the contribution of the Nafion film impedance is about 10% (Figure 8). The impedances in Figure 8 are represented as separate arcs by shifting Zox and ZN to the right along the real axis by the resistivities Rct + p and Rct + p + Rox, respectively. This can be done using the model equations; however, separation of the impedances from the experimental spectrum is a much more difficult task. We note again, that the separation of ZN and Zox is only possible if the characteristic frequencies ωN and ωox are different.
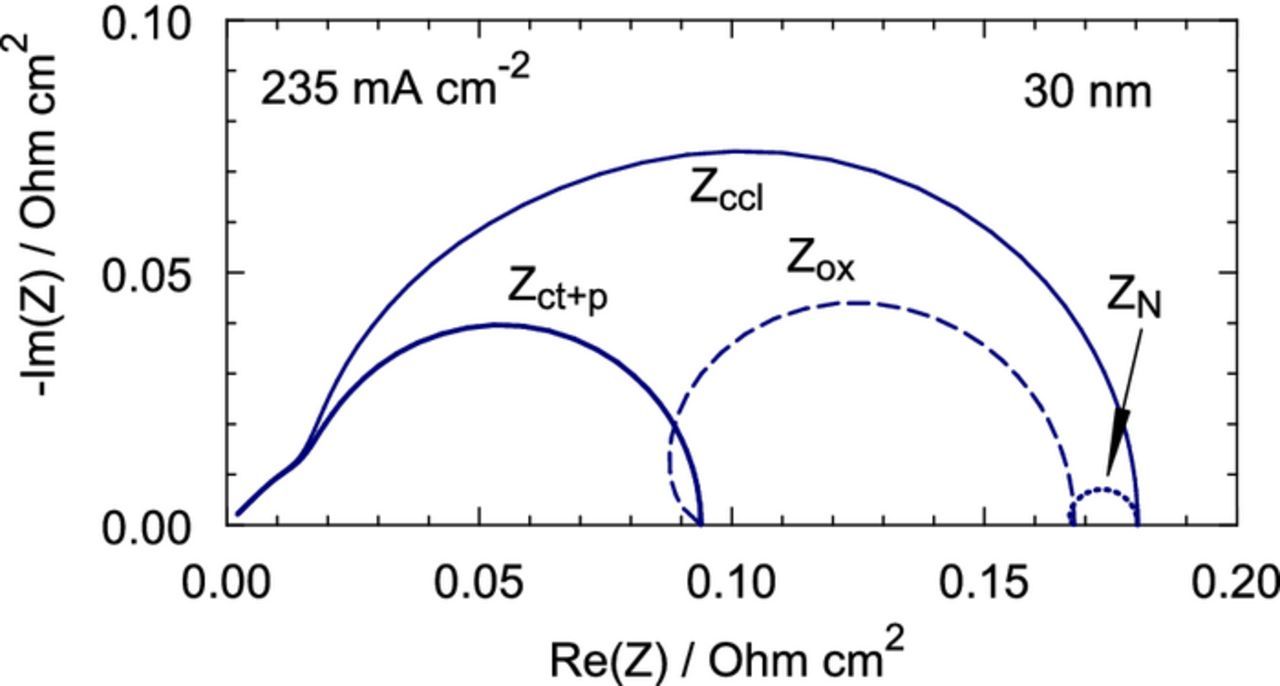
Figure 8. Solid line – the total CCL impedance, short–dashed line – the charge–transfer impedance, including proton transport impedance, long–dashed line – the through–plane oxygen transport impedance, dotted line – the Nafion film impedance. The cell current density is 240 mA cm− 2, the parameters for calculations are listed in Table I.
It should also be noted that the spectra in Figure 8 are plotted for the upper estimates of Dox and dN (Table I). For more realistic values of three to four times lower Dox and three times lower dN, the contribution of ZN to the total impedance would be less than 1%. The experimental impedance spectra becomes progressively noisy with the increase in the cell current density, and reliable determination of ZN with the standard 10 μm–thick CCL seems to be rather problematic. However, Eq. 53 shows that with the decrease in the CCL thickness lt, the contribution of Zox to the total CCL impedance decreases, while the contribution of ZN increases. This gives us a chance to determine ZN by fitting the impedance models above to experimental spectra from MEA with the thin, low–loaded catalyst layers.
Fitting
Finally, the following numerical experiment has been performed. An impedance spectrum for the current density j0 = 100 mA cm− 2 has been generated using Eq. 49 and the parameters indicated in brackets in Table II. The total spectrum and its components are shown in Figure 9a. Then, the imaginary part of the spectrum has been perturbed by adding a 3% random noise and the model of Eq. 49 has been fitted to the perturbed spectrum. The fitting has been performed using the Maple least–squares procedure NonlinearFit.
Table II. Fitted and prescribed (indicated in brackets) parameters. The other parameters are listed in Table I.
| The ratio dN/DN, s cm− 1 | 3.776 (3.529) |
| Oxygen diffusion coefficient through | |
| the CCL depth Dox, cm2 s− 1 | 4.03 · 10− 5 |
| (4.00 · 10− 5) | |
| ORR Tafel slope b, V | 0.0302 (0.0300) |
| CCL proton conductivity σp, Ω cm− 1 | 0.0221 (0.200) |
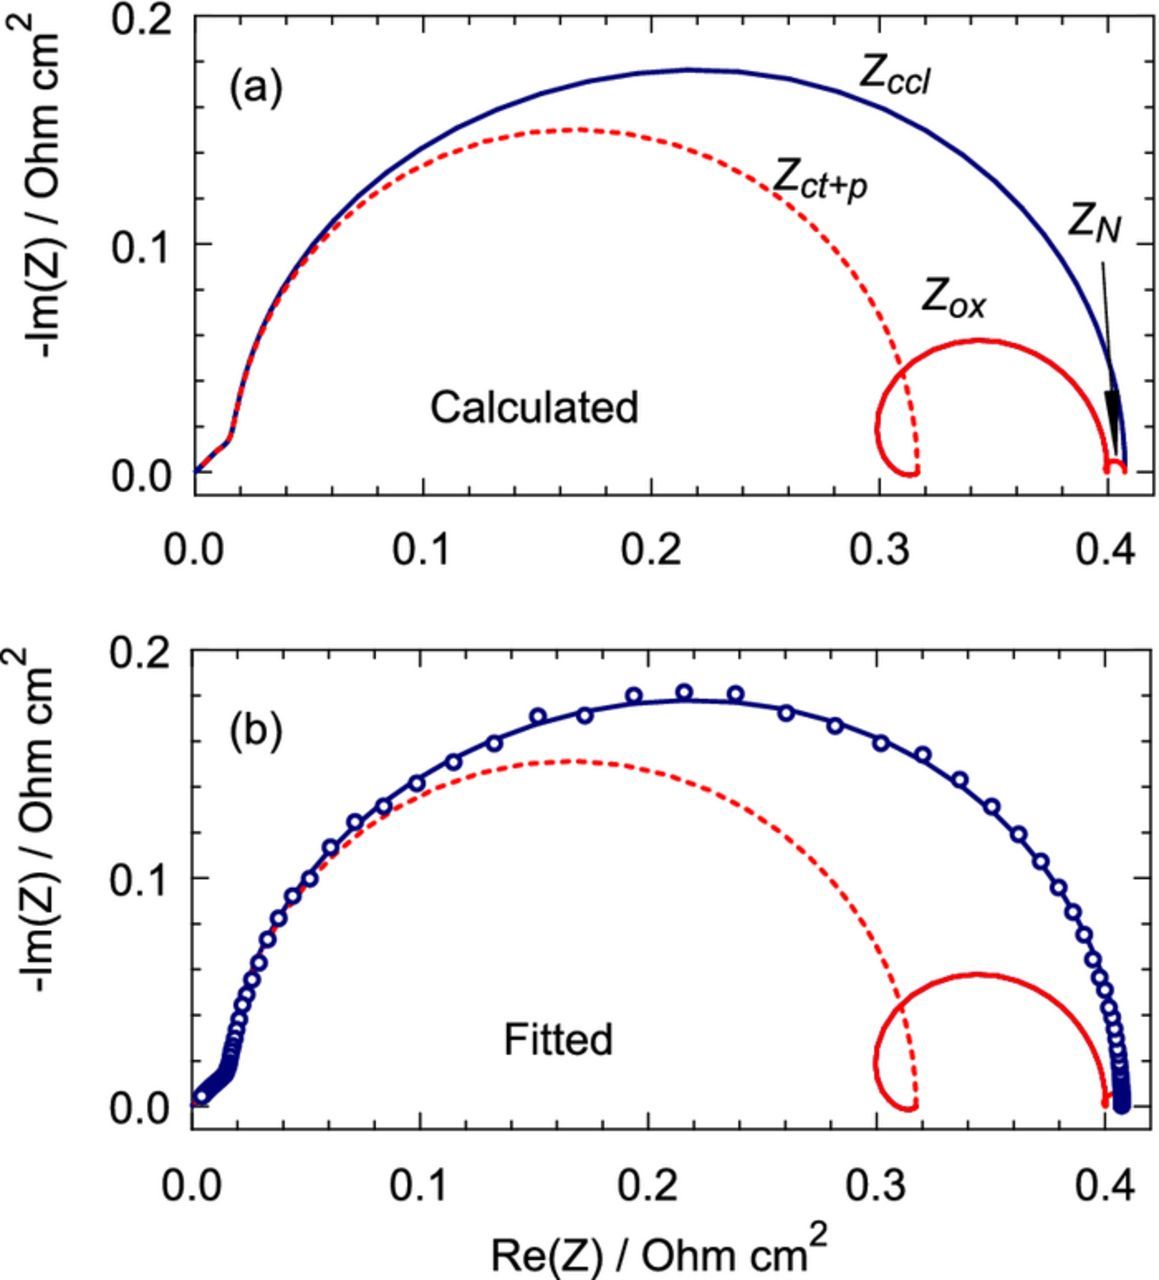
Figure 9. (a) Calculated "exact" spectrum of the CCL, Eq. 49, and its components Zct + p, Zox and ZN. (b) Points – perturbed spectrum in (a); lines – fitted spectrum and its components.
The perturbed and fitted spectra, and the components of the fitted spectrum are shown in Figure 9b. As can be seen, the fitted spectrum and its components are quite close to the "exact" spectra in Figure 9a. The fitting and prescribed parameters are listed in Table II. The Nafion film impedance, Eq. 46, depends on the ratio of the parameters dN/DN; hence the parameter KN = dN/DN has been introduced and claimed as a fitting parameter. Fitting nicely captures the Tafel slope, the through–plane oxygen diffisivity and the double layer capacitance (Table II). The fitted values of σp and KN are less accurate; nonetheless, these values are determined with 10% accuracy. Taking into account a very small value of ZN (Figure 9a), this "experiment" gives us a hope that even small ZN can be found from fitting real experimental spectra.
To conclude discussions, a following note should be made. The non–zero ORR rate in the Nafion film is justified by the following arguments. Formally, the "gap" in the ORR rate due to Nafion film would make it difficult to link the local agglomerate and the through–plane problems. In the present formulation, a simple equation for the divergence of the oxygen flux in Eq. 3 results from condition that in the limit of infinite Da and DN, this divergence should reduce to the macro–homogeneous expression i*(c/cref)exp (η/b). In the absence of ORR rate in the Nafion film, this condition does not hold, as the "gap" in the oxygen conversion inside the Nafion film contradicts to the macro–homogeneous paradigm. Second, in real fuel cells, Pt is dissolved during operation and it migrates to membrane, where it is re–deposited, sometimes forming quite a dense band.29 This process may lead to deposition of Pt in the Nafion film covering agglomerates. As this film is thin, Pt particles may have an electric contact with the main cluster of Pt/C particles, and hence ORR would run also in the film.
Conclusions
A physics–based model for impedance of the cathode catalyst layer is developed. The model takes into account oxygen transport through the CCL depth, and through the Nafion film covering agglomerates of Pt/C particles. Transient mass and charge conservation equations are linearized and Fourier–transformed to get a system of linear equations for small perturbation amplitudes. In the case of small cell current density and fast oxygen transport through the CCL, the system is solved and analytical expressions for the CCL impedance and static resistivity are derived. With typical CCL parameters, at small currents, the contribution of the Nafion film to the CCL impedance appears to be small. Furthermore, for the Nafion film thickness of 10 nm and through–plane oxygen diffusivity on the order of 10− 5 cm2 s− 1, the characteristic frequencies of the oxygen transport in the Nafion film and in the CCL pores are nearly the same, and the respective impedances cannot be separated. For larger current densities, the system of equations for perturbation amplitudes is solved numerically. With the growth of the cell current, the contribution of Nafion film impedance increases up to 10% of the total CCL impedance. The Nafion film impedance can best be measured by fitting the model equations of this work to impedance of a low–loaded, thin CCL, in which the effect of the though–plane oxygen transport is small.
List of Symbols
 |
Marks dimensionless variables |
 |
Marks dimensionless variables |
| b | ORR Tafel slope b = RT/αF, V |
| Cdl | Double layer volumetric capacitance, F cm− 3 |
| cox | Oxygen molar concentration in the CCL pores, mol cm− 3 |
| ca | Oxygen molar concentration in the agglomerate, mol cm− 3 |
| cN | Oxygen molar concentration in Nafion film, mol cm− 3 |
| cref | Reference oxygen molar concentration, mol cm− 3 |
| Dox | Effective oxygen diffusion coefficient in the CCL pores, cm2 s− 1 |
| Da | Oxygen diffusion coefficient in the agglomerate, cm2 s− 1 |
| DN | Oxygen diffusion coefficient in the Nafion film, cm2 s− 1 |
| dN | Nafion film thickness, cm |
| F | Faraday constant, C mol− 1 |
| f | Regular frequency, Hz |
| j | Local proton current density in the CCL, A cm− 2 |
| j0 | Cell current density, A cm− 2 |
| i | Imaginary unit |
| i* | Volumetric exchange current density, A cm− 3 |
| lt | Catalyst layer thickness, cm |
| NN | Oxygen flux through the outer side of Nafion film, mol cm− 2 s− 1 |
| N1η, Nox1 | Coefficients in Eq. 34 |
| Ra | Agglomerate radius, cm |
| Rccl | Static differential resistivity of the CCL, Ω cm2 |
| r | Radial coordinate in the agglomerate, cm |
| t | Time, s |
| t* | Characteristic time, s, Eq. 9 |
| x | Coordinate through the CCL, cm |
| Z | Total impedance of the cathode side, Ω cm2 |
| Zccl | CCL impedance, Ω cm2 |
| Zct + p | Charge–transfer and proton transport impedance, Ω cm2 |
| ZN | Nafion film impedance, Ω cm2 |
Greek
| αN, βN | Dimensionless coefficients in Eq. 33 |
| δ | Dimensionless ratio δ = Ra/lt, Eq. 14 |
|
Dimensionless ratio = lN/Ra |
|
Newman's dimensionless reaction penetration depth, Eq. 14 |
| η | Local ORR overpotential (positive by convention), V |
| β | Dimensionless parameter, Eq. 14 |
| σp | CCL ionic conductivity, Ω− 1 cm− 1 |
| ϕ | Dimensionless parameter, Eq. 38 |
| ω | Angular frequency (ω = 2πf), s− 1 |
| ωox | Characteristic frequency of oxygen transport in the CCL, s− 1, Eq. 54 |
| ωN | Characteristic frequency of oxygen transport in the Nafion film, s− 1, Eq. 47 |
Subscripts
| 0 | Membrane/CCL interface |
| 1 | CCL/GDL interface |
| a | agglomerate |
| N | Nafion film |
| ox | Oxygen in the CCL pores |
| t | Catalyst layer |
| * | Characteristic value |
Superscripts
| 0 | Steady–state value |
| 1 | Small–amplitude perturbation |