Abstract
Although polymer electrolyte water electrolyzers (PEWEs) have been used in small-scale (kW to tens of kW range) applications for several decades, PEWE technology for hydrogen production in energy applications (power-to-gas, power-to-fuel, etc.) requires significant improvements in the technology to address the challenges associated with cost, performance and durability. Systems with power of hundreds of kW or even MWs, corresponding to hydrogen production rates of around 10 to 20 kg/h, have started to appear in the past 5 years. The thin (∼0.2 mm) polymer electrolyte in the PEWE with low ohmic resistance, compared to the alkaline cell with liquid electrolyte, allows operation at high current densities of 1–3 A/cm2 and high differential pressure. This article, after an introductory overview of the operating principles of PEWE and state-of-the-art, discusses the state of understanding of key phenomena determining and limiting performance, durability, and commercial readiness, identifies important 'gaps' in understanding and essential development needs to bring PEWE science & engineering forward to prosper in the energy market as one of its future backbone technologies. For this to be successful, science, engineering, and process development as well as business and market development need to go hand in hand.
Export citation and abstract BibTeX RIS

This is an open access article distributed under the terms of the Creative Commons Attribution 4.0 License (CC BY, http://creativecommons.org/licenses/by/4.0/), which permits unrestricted reuse of the work in any medium, provided the original work is properly cited.
In 2015, the global primary energy consumption was 153 PWh,1 corresponding to an average rate of energy conversion of 17 TW. About 30% (∼6 TW) of this is used for electricity generation, which yields around 2.8 TW of electrical power (24 PWh per year). Around two thirds of the electricity is generated from fossil fuels, hydropower contributes 16%, nuclear power 11%, and other renewables (such as solar and wind) only 6.7%.1 Solar (photovoltaics) and wind power have a combined installed capacity of about 660 GW (in 2015).2 Electricity supply based on a significant share of these "new renewables" is associated with large discrepancies between supply and demand, owing to the intermittent nature of these primary energy sources. Hence, solutions for the grid-scale storage of electricity need to be developed and implemented. The electrochemical splitting of water (electrolysis) is a clean and efficient process offering interesting prospects to store large amounts of excess electricity in form of chemical energy ('power-to-gas' concept).3,4 The produced hydrogen and oxygen can be used to regenerate electricity in periods of low production and high demand or serve as clean transportation fuel for fuel cell electric vehicles. Therefore, water electrolysis is a key technology in future sustainable energy scenarios, since hydrogen as an energy 'vector', i.e., as a universal energy carrier, could promote the decarbonization of the energy economy, or even become its backbone in the context of a 'hydrogen economy'.5 Moreover, the produced hydrogen can be used to methanate CO2 from suitable sources, such as biogas plants, to produce synthetic natural gas (SNG), which can be injected and stored in the natural gas network.6
Water electrolyzers split water electrochemically into hydrogen and oxygen. There are different types of water electrolysis cells, differentiated by the temperature of operation and the type of electrolyte used: the alkaline cell, the polymer electrolyte cell, and the solid oxide cell.7 The alkaline electrolyzer is a mature technology and has been used for over a century in industrial hydrogen production. It is associated with relatively low investment costs (1000–1200 €/kW8,9), owing to the nickel-based catalysts used in the electrodes and low-cost electrolyte and structure materials. During the first half of the 20th century, commercial alkaline water electrolyzers of gradually increasing capacities were deployed, mainly for ammonia synthesis, e.g. by Norsk Hydro in 1927: 125 MW–2.4 t(H2)/h.10 However, the low current density (below 1 A/cm2) and the sensitivity to differential pressure are the major limitations today. An electrolyzer using a polymer electrolyte does not require the circulation of a liquid electrolyte. State-of-the-art membrane water electrolyzers use a proton exchange membrane and, owing to the thin polymer electrolyte (∼0.2 mm) with low ohmic resistance, can operate at current densities of 1–3 A/cm2. The stack is therefore considerably smaller as compared to the alkaline technology for a desired hydrogen production rate. However, noble metal catalyst and titanium structure materials contribute to higher investment costs (1900–2300 €/kW8,9) of the current technology. There is considerable interest to develop alkaline anion exchange membranes for use in electrolyzers to reduce cost, yet the chemical stability of the membrane in the presence of hydroxide ions is currently limiting technical viability.11 Therefore, this review predominantly focuses on the polymer electrolyte water electrolyzer (PEWE) using a proton exchange membrane (PEM)c, yet prospects of alkaline membrane electrolysis are given where deemed appropriate. Due to the use of a membrane electrolyte, the PEWE can be operated at differential pressures of 100 bar or more,12 which is of interest if hydrogen is the main product. Furthermore, oxygen production at low or ambient pressure reduces the constraints on the oxygen subsystem of the balance of plant components. However, the lifetime of the PEWE is, at the present time, lower than that of an alkaline electrolyzer with liquid electrolyte. The solid oxide electrolysis cell (SOEC) technology is at a comparably low technology readiness level of lab demonstrators. It operates above 600°C and thus provides advantages of high conversion efficiency and kinetics. Drawbacks are significant materials challenges related to limited stability to temperature and redox cycles.13,14 Therefore, the SOEC is considered for continuous operation in scenarios where waste heat at the required temperature level is readily available, rather than for intermittent operation.14
This review focuses on PEWE technology, as it offers the most promising prospects for hydrogen (and oxygen) generation for distributed as well as centralized operation, owing to its wide operational range of current densities, excellent dynamic response to variable electricity input and on/off cycling, and the possibility to operate at significant differential pressure. This article addresses and discusses critical gaps in the development of membrane water electrolysis cells for application in the energy sector, i.e. in the context of the grid-scale storage of electricity via power-to-gas, and the production of "green" hydrogen for mobility and industrial use. In general terms, the objectives of PEWE development for energy applications are the reduction of cost and the improvement of performance and durability. Specifically, the topics addressed here are, on the one hand, component related issues, such as choice of membrane, electrode and porous transport layer materials, and, on the other hand, limitations associated with desired operating conditions, e.g., temperature, pressure and current density. In the end, we will highlight prospects and requirements for research and development to tackle these "gaps" and move technology forward to allow PEWE to become a key element in future energy scenarios.
Working Principle and State of the Art
PEWE design and operating principle
The principal design of a PEWE is shown in the Figure 1. The catalyst coated membrane (CCM) comprises a polymer electrolyte, which ensures selective conduction of protons and separation of product gases while providing electrical insulation and gas separation between the electrodes. The CCM is compressed between two porous transport layers (PTLs), which provide mass transport pathways for the water and product gases and electrical and thermal conductivity between the bipolar plates (BPPs) and the catalyst layers of anode and cathode (CLa, CLc). The BPPs are often structured with flow channels to ensure an even flow of the water over the PTL and easy removal of product gases. Liquid water is generally introduced to the cell at the anode. During operation, water reaching the anodic CL through the anodic PTL is oxidized into protons, electrons and oxygen (Equation 1). The produced oxygen is transported through the anodic PTL and removed from the cell. Protons from the oxygen evolution reaction (OER) at the anode are transported through the membrane to the cathodic CL and are reduced to molecular hydrogen in the hydrogen evolution reaction (HER) (Equation 2). Movement of protons through the membrane is accompanied by a simultaneous transport of water as a result of the electro-osmotic drag. Produced hydrogen is then transported through the cathodic PTL and removed from the cell. PEWE designs often enable water recirculation through the anodic and cathodic cell compartments for product gas removal and temperature control. The overall reaction is the sum of the two half-cell reactions (Equation 3).
![Equation ([1])](https://content.cld.iop.org/journals/1945-7111/164/4/F387/revision1/d0001.gif)
![Equation ([2])](https://content.cld.iop.org/journals/1945-7111/164/4/F387/revision1/d0002.gif)
![Equation ([3])](https://content.cld.iop.org/journals/1945-7111/164/4/F387/revision1/d0003.gif)
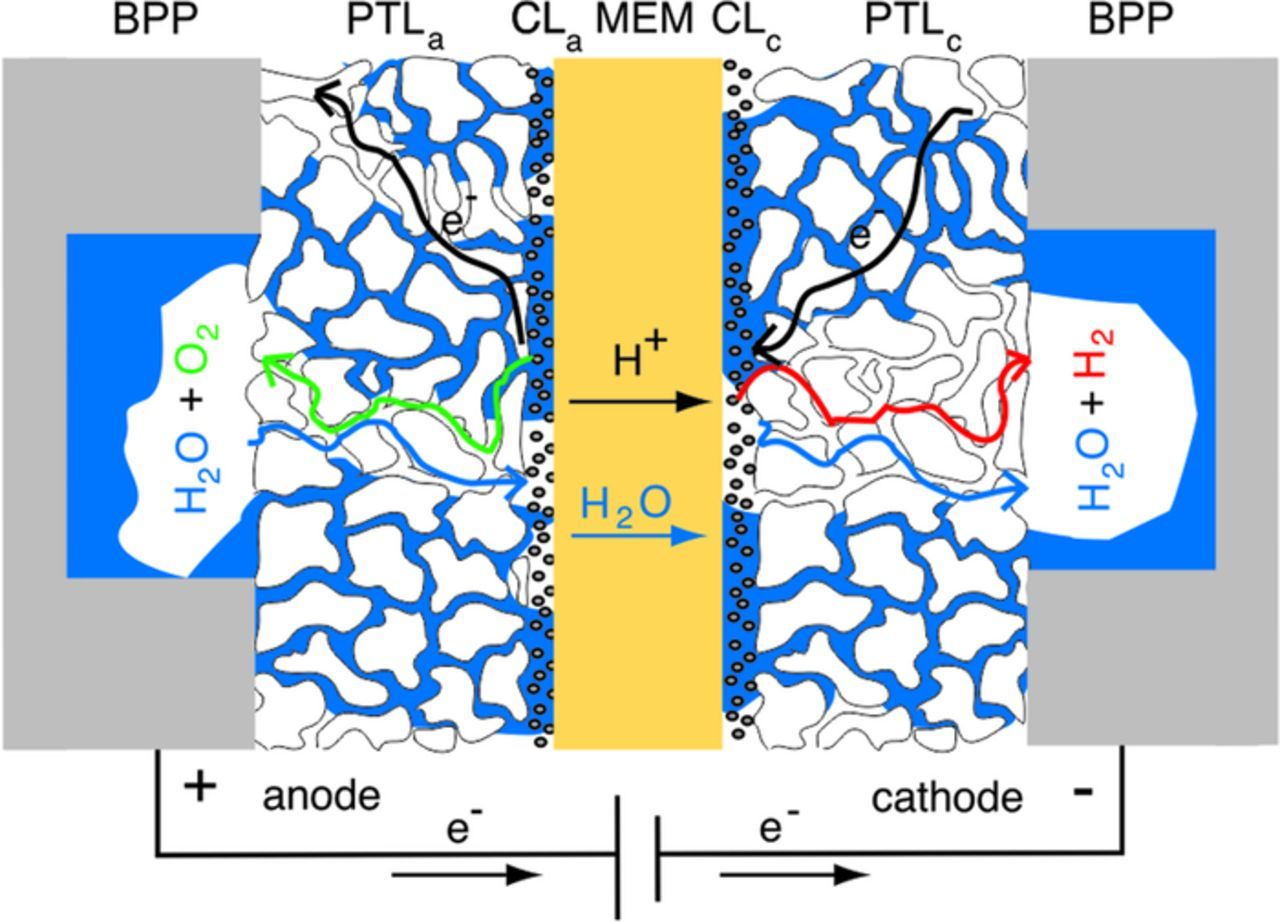
Figure 1. Schematic cross-section of an electrolysis cell, consisting of a membrane (MEM) coated with cathodic and anodic catalyst layer (CLc, CLa) sandwiched between two porous transport layers (PTLc, PTLa) and bipolar plates (BPPs).
Thermodynamics of PEWE
The electrochemical splitting of water from its liquid state has a standard free energy of reaction ΔRG*° of 237 kJ/mol at standard conditions (25°C, 1 bar). It represents the minimum electrical work needed for splitting water at the corresponding theoretical cell potential of E*0 = 1.23 V. If no external heat source is present, the total energy, corresponding to the reaction enthalpy ΔRH*° of 286 kJ/mol, needs to be provided through electricity for the reaction to take place. The associated potential is higher than E*0 and is called the thermoneutral potential Etn = 1.48 V. In practical systems the operating potential is higher at technically and economically viable reaction rates for hydrogen production. The excess energy in the form of overpotential is converted into heat during electrolysis, and needs to be properly managed. The electrical energy required to split water ΔRG*° decreases with increasing temperature, and a higher fraction of the total energy can be provided in the form of heat TΔS. Liquid water can still be fed to the electrolyzer at temperatures above 100°C at elevated system pressures (Figure 2).

Figure 2. The energy required to split water over the range of operating temperatures at 1 bar and 100 bar. Values at 1 bar calculated from the steam tables, values at 100 bar from Ref. 129.
Reversible anode and cathode potentials are estimated using the Nernst equation, as a function of temperature, pressure and the activities of hydrogen and oxygen at standard conditions (Equations 4 and 5).
![Equation ([4])](https://content.cld.iop.org/journals/1945-7111/164/4/F387/revision1/d0004.gif)
![Equation ([5])](https://content.cld.iop.org/journals/1945-7111/164/4/F387/revision1/d0005.gif)
The efficiency η of a PEWE cell is an important parameter to assess the energy costs of the process. The voltage efficiency ηV relates the theoretically required amount of energy for the reaction, i.e., the reaction enthalpy ΔRH*°, to the actual electrical energy input into the cell according to
![Equation ([6])](https://content.cld.iop.org/journals/1945-7111/164/4/F387/revision1/d0006.gif)
where Ecell is the operating cell voltage and ΔRH*° is the enthalpy of the water splitting reaction and the same as the heating value of hydrogen (cf. Table I). The faradaic efficiency ηF takes the losses of hydrogen (and, if of interest, oxygen) due to crossover through the membrane into consideration (cf. below). Conversion efficiency of the water electrolyzer can be referred to the lower heating value (LHV) or the higher heating value (HHV) of hydrogen. The LHV is typically used when the focus of the discussion is on the use of hydrogen, since many applications do not benefit from the condensing enthalpy of water (ΔHvap = 44 kJ/mol at 25°C). The HHV is a preferred reference when considering the heat balance of the electrolyzer, since it is fed with liquid water. The use of the specific electricity requirement in terms of kWh/Nm3(H2) or kWh/kg(H2) as a practical measure for efficiency is unambiguous in this respect, as it comprises overall energy input for a given output of H2 on the level of single cell, stack or system.d
Table I. Heating value of hydrogen, equivalent to the enthalpy ΔRH° of the water splitting reaction (Equation 3), expressed in different units, and the corresponding thermoneutral cell voltage Etn. Distinction is made between the water being in the liquid form (HHV = higher heating value) and in gaseous form (LHV = lower heating value).
| ΔRH*° | ||||
|---|---|---|---|---|
| State of water | (kJ/mol) | (kWh/Nm3) | (kWh/kg) | Etn (V) |
| liquid (HHV) | 286 | 3.54 | 39.7 | 1.48 |
| gaseous (LHV) | 242 | 3.00 | 33.6 | 1.25 |
On the system level, the specific energy requirement needs to include balance-of-plant (BoP) components. AC power needs to be converted to DC, produced hydrogen is humid, and has to be dried and eventually cleaned as the purity of gases depends on operating conditions and stack components. This requires recirculation and feed pumps, heaters, power electronics etc., and their energy consumption needs to be taken into account. The common measure of the stack as well as system efficiency in the electrolyzer community is the specific electricity demand given in kWh/kg or kWh/Nm3 of H2 produced, which encompasses all the losses on the cell level (voltaic, faradaic) and, if quoted on the system level, losses related to the BoP components.
Materials and Components
Catalyst coated membrane (CCM)
The use of commercially widespread perfluoroalkylsulfonic acid (PFSA) type membranes, such as Nafion, Flemion or Aquivion, limits the choice of electrocataysts and structure materials in the PEWE cell for stability reasons. Electrocatalysts with high activity and stability can only be selected from platinum-group-metals (PGM). At the cathode, usually platinum black or carbon supported platinum based catalysts are used for the HER, similar to the hydrogen oxidation reaction (HOR) catalysts in the polymer electrolyte fuel cell (PEFC).
Iridium oxide and/or iridium-ruthenium oxide blacks are well performing catalysts for the OER. Only iridium based catalyst seems to be sufficiently stable for long term operation. The high electrochemical potential on the anode side of >1.4 V precludes the use of carbon as a catalyst support material, since carbon readily oxidizes under these conditions.15 Ir and Ru oxides show the highest activity toward OER in acidic media.16 Although RuO2 shows lower overpotentials for the OER,17 IrO2 remains the material of choice for the PEWE anodic electrocatalyst, since the rate of RuO2 dissolution and corrosion is inacceptably high.18
The effort in the research community is targeting the reduction in the PGM loading of the anodic CL using high surface area supported catalysts or multi-metal oxide catalysts. Titanium or tin oxide supports are possible alternatives to lower the noble metal catalyst loading without impairing the performance significantly.19–21 Promising performance and stability were demonstrated using 0.1 mg/cm2 of Ir supported on tungsten-doped titanium oxide.22 There is a potential to increase the active catalyst surface area using improved catalyst manufacturing techniques. Recently, 0.1 mg/cm2 of IrOx loading on the anode and a measured cell potential with corresponding N117-based CCM of 2 V at 1.8 A/cm2 and 50°C were reported.23 3M's nanostructured thin film (NSTF) catalysts with extended surface area have been used for PEWE with an Ir loading of 0.25 mg/cm2.24 Additionally, new catalyst synthesis approaches for high surface area IrO2 reaching specific surface areas of 150 m²/g with significantly increased OER activity have been recently reported.25 Carmo et al. give a historic overview of achieved cathode and anode catalyst types and loadings, with the corresponding performance.26 A detailed overview of the state-of-the-art catalysts used in acidic electrolyzers and prospects are given in Ref. 27. Considering the relatively low contribution of the anode catalyst to the overall stack cost of 6% (cf. Figure 10), the argument for reducing the Ir-loading is not primarily the lowering of the stack cost, but the limited worldwide production of iridium metal, which is a secondary metal, to enable the deployment of electrolysis plants at the scale of GW per year (cf. Degradation phenomena section). Although recycling infrastructure for iridium will moderate issues of its abundance, the iridium loading still influences the overall amount of noble metal in circulation.
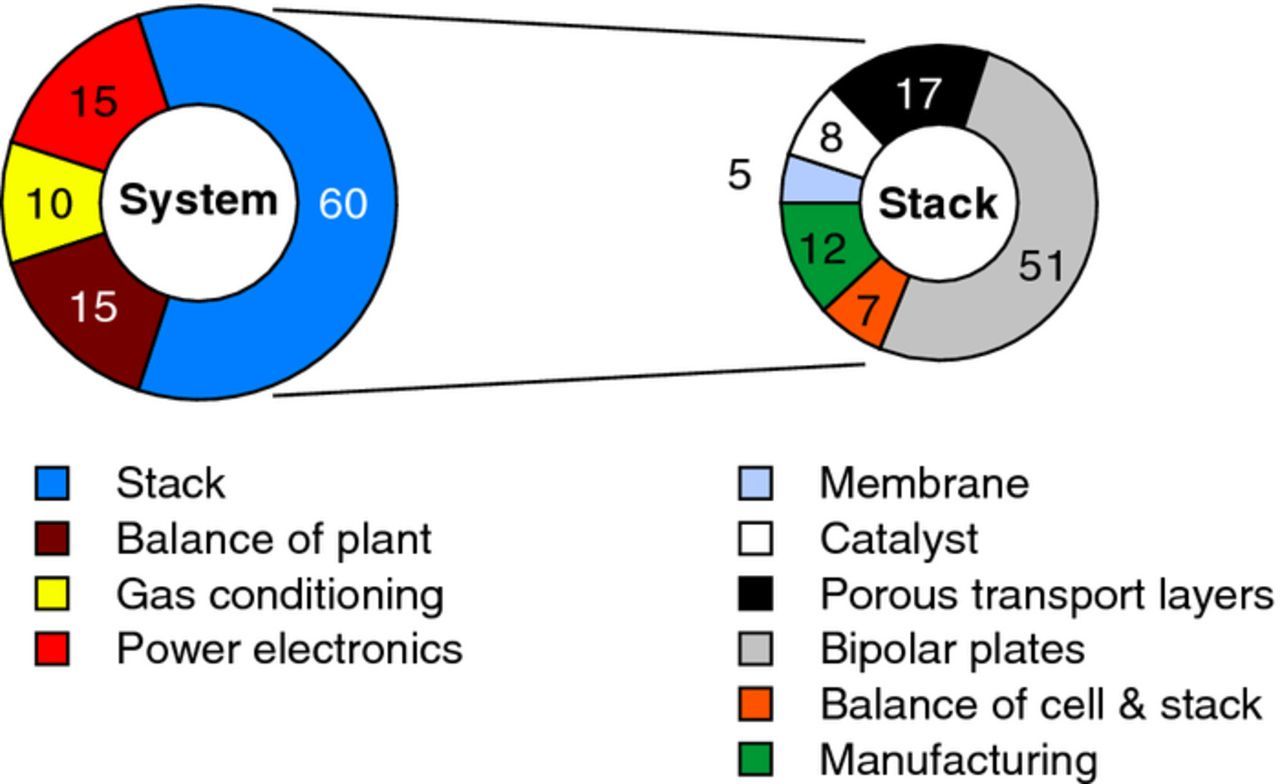
Figure 10. PEWE system and stack cost breakdown; redrawn based on the data presented in Ref. 9.
The membranes typically used in state-of-the-art PEWE cells are relatively thick (5–7 mil; 1 mil = 25.4 μm) PFSA membranes, such as Nafion 115 and 117. This is a compromise between area-specific resistance, low gas (H2, O2) crossover, and mechanical robustness.28 Also, chemical degradation of the membrane, resulting in thinning, is less critical in this case. A number of recent reports have highlighted the use of thinner PFSA membranes, yielding lower ohmic losses and thus enabling higher current densities at the same conversion efficiency.12,24 However, thin membranes are associated with higher gas crossover and susceptibility to mechanical failure.12,29,30 The latter can be alleviated using reinforced membranes.12 The higher gas crossover of thinner membranes can be addressed by incorporating a H2-O2 recombination catalyst, e.g. Pt or Pd, into the membrane.31,32 Although this reduces the safety hazard caused by excessive H2 in the O2 stream (O2 in the H2 product stream is less problematic, because cross-diffused O2 readily reacts with H2 on the Pt cathode catalyst), it does not tackle the faradaic loss associated with gas crossover. Alternative, non-PFSA membranes are being developed to tackle some of the issues associated with PFSA membranes. Hydrocarbon polyarylene type membranes, such as sulfonated poly(ether ketones), poly(ether sulfones), polybenzimidazoles, etc., and partially fluorinated membranes comprising a fluoropolymer backbone and grafted styrenic polyelectrolyte generally show a much lower gas permeability compared to PFSA membranes and, consequently, a more favorable combination of resistance and gas crossover characteristics.29,33 To improve mechanical robustness, in particular for thin membranes, and to improve the creep resistance of the material, mechanical reinforcements are introduced.34 Many of these alternative membranes offer the prospect of lower cost compared to PFSA membranes.35 However, both chemical and mechanical durability of alternative membranes need to be carefully assessed to judge their suitability for use in the electrolyzer.
The use of anion exchange membranes instead of a proton exchange membrane represents a promising approach in terms of combining advantageous features of a membrane electrolyzer (high current density due to small electrolyte gap, absence of liquid electrolyte, possibility to operate at high differential pressures) and an alkaline cell type (non-noble metal catalyst, low-cost structural materials), yet the current membrane technology suffers from stability issues of the anionic head groups, which limits the lifetime of the cell.36 However, with rapid progress in chemistry and stability of alkaline anion exchange membranes,37 it is worth keeping an eye on this technology for future developments.
Structural components
The major tasks of the porous transport layer (PTL) is the simultaneous transport of charge and heat between electrode and BPP in the solid structure and gas and water in the pore space. In case differential pressure is applied, the PTL has to furthermore provide mechanical support for the membrane. It is conceivable to combine BPP and a PTL into a single component at the expense of a well-designed flow field. At the cathode, carbon fiber based materials in the form of papers or cloths can be used. These materials have so far mainly been developed for fuel cells (e.g. Ref. 38). However, it should be noted that the conditions in electrolyzers and fuel cells in terms of flow directions for the two-phase flows are different and the fuel cell know-how is therefore not necessarily directly applicable.
At the anode, the choice of materials is usually limited to titanium based porous materials, in the form of sintered powders, fibers or meshes due to the high electrochemical potential. However, with suitable coatings, such as TiN, Pt or Au, also stainless steel materials may become viable. The use of an additional microporous layer on coarse PTLs, a concept adapted from PEFC technology, may improve performance by reduction of the interfacial contact resistance.39 In unitized reversible fuel cells (URFCs) typically also titanium PTLs are used at the oxygen electrode. PTFE-coatings of titanium felt40 or additional titanium powder at the PTL/CCM interface41 were investigated. However, in contrast to fuel cell operation, little/no improvement was observed in electrolysis mode.
Modern manufacturing approaches such as electron beam melting (EBM) can be used to fabricate 3-D porous structures from various grades of Ti with lower cost and more flexibility in the design. Mo et al. have demonstrated that a PTL produced this way can lead to a performance improvement as compared to woven mesh Ti PTLs, attributed to the better interfacial contact between the EBM parts and the catalyst layer.42 Another approach toward thin PTLs with tunable porosity is to use photochemical machining of Ti foils. PTLs fabricated using this technique have smaller pore openings compared to EBM PTLs. The improvement in performance is again attributed to lower interfacial contact resistance, as the Ti surface between the pores is flat.43
BPPs should have sufficient electrical and thermal conductivity. Often a flow field based on a channel structure, typically in the mm-range, is used to distribute the reactant water evenly over the active area and remove product gases and waste heat. Quite naturally, parallel channels seem to be preferred over serpentine patterns due to a better water and temperature distribution and a lower pressure drop.44 But also parallel channel structures may result in non-uniform water flow rate and temperature distributions over the active area.45 Considering that BPPs make up a significant share of the stack cost (cf. Figure 10), approaches to reduce the cost of BPP materials and processing should be given a high development priority. There are novel approaches reported in the literature to reduce cell costs by additive manufacturing of the PTLs and BPPs.42,46 The reported performance compared to the state-of-the-art components is promising, but it remains open if the stability of such components made from Ti and its alloys is comparable to that of the pure metal components.
Operating Conditions
The operating conditions are determinant for the PEWE performance. With increasing temperature less electric energy (given by ΔG in Figure 2) is needed to split water. Increasing the operating temperature above 100°C and maintaining the liquid state of water is possible by operating the electrolyzer at increased pressure. Pressurized PEWE could make subsequent compression of gases redundant or reduce the effort for drying with mechanical compression.47 However, it is important to address the safety issues related to operating with pressurized oxygen gas or large differential pressures. For pressurized operation two different modes are used: balanced (similar pressure on hydrogen and oxygen sides) and differential (significantly higher pressure at the cathode). Also, current density requires consideration, as at increased gas pressures the cross-over of both hydrogen and oxygen may become safety relevant at low production rates (cf. below 'Turndown ratio'). Finally degradation of components may also be related to the operating conditions.
Temperature
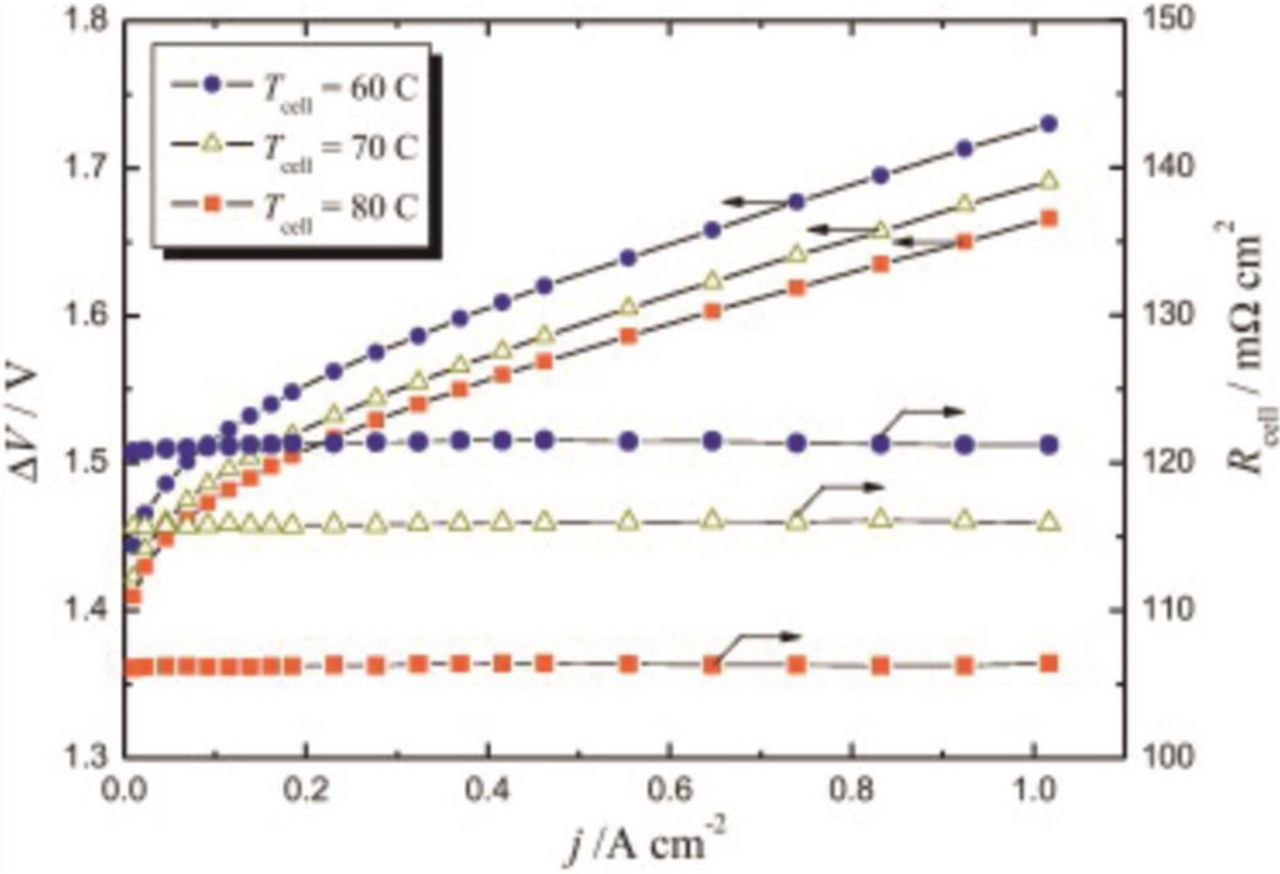
The increase in operating temperature leads to the reduction of the ohmic and activation losses in the cell, primarily with the membrane having higher ionic conductivity and to a lesser extent due to faster kinetics. The influence of temperature on the electrolyzer performance and the ohmic resistance is exemplarily shown in Figure 3.
The temperature limitation for conventional PEWE stems from material stability issues at temperatures above 100°C. The tradeoff between improved performance with increased temperature48 and the thermal limitations of the PFSA materials leads to maximum operation temperatures in the range between 70–90°C. The deterioration of mechanical stability of the polymer and higher hydrogen permeation at increased temperatures49,50 contribute to a safety risk in long-term operation. However, membranes exhibiting good mechanical and gas barrier properties at elevated temperatures and pressures could open a window for the reduction in the PGM-based catalyst loading if the cell performance can be kept at the same level of those operating below 90°C. PFSA membranes with short side-chains, owing to their higher crystallinity at given equivalent weight compared to long side-chain PFSA membranes, could be more suitable for operation and higher temperature.51,52 In today's commercial systems often the temperature is kept even lower (60–70°C) due to stability issues with ion-exchange resins used to maintain the purity of the process water.
Mechanical and electrochemical gas compression
The minimum compression work needed for an ideal isothermal or adiabatic compression can be calculated using Equations 7 and 8, respectively.
![Equation ([7])](https://content.cld.iop.org/journals/1945-7111/164/4/F387/revision1/d0007.gif)
![Equation ([8])](https://content.cld.iop.org/journals/1945-7111/164/4/F387/revision1/d0008.gif)
where n is the number of moles of gas, R is the ideal gas constant, T is the temperature, p is the pressure of the initial state 1 and the final state 2, and γ is the isentropic expansion factor equal to 1.41 for hydrogen at room temperature.
In Figure 4 ideal isothermal and adiabatic compression losses, normalized to the lower heating value (LHV) of hydrogen of 237 kJ/mol, are plotted against the final pressure. Generally, the isothermal compression is preferable to the adiabatic in terms of compression efficiency by more than an order of magnitude of pressure.
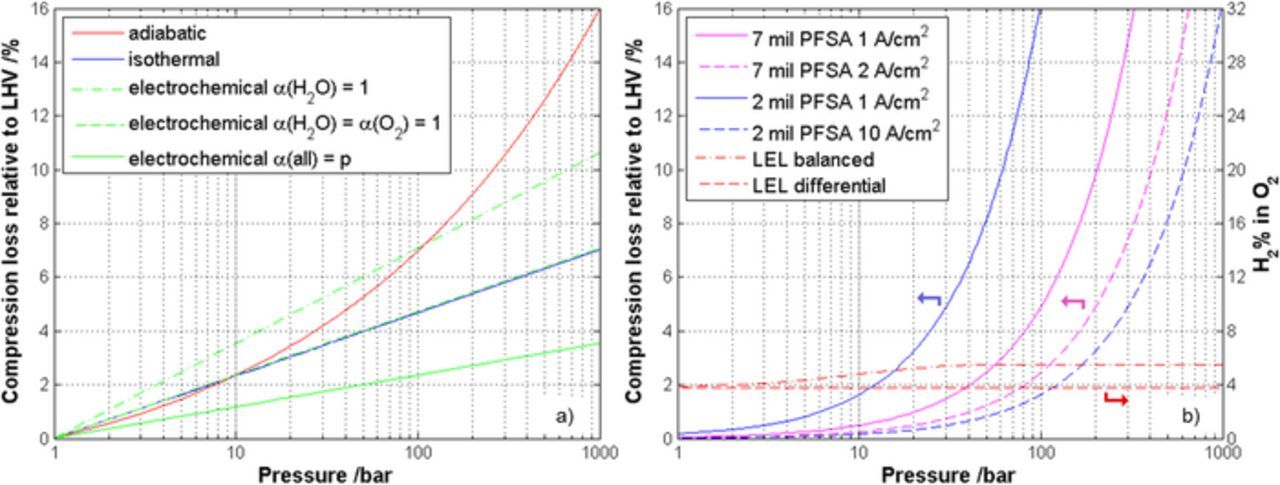
Figure 4. Comparison of theoretic compression losses (normalized to the LHV of hydrogen) as a function of pressure for a) adiabatic, isothermal and electrochemical compression and for b) four different PEWE cases considering only the hydrogen gas crossover; additionally the expected H2% in O2 as well as the expected lower explosion limit (LEL) for balanced and differential electrolysis is added.
Real compressors will have higher losses than the theoretical limits. New 5-stage ionic compressors of Linde53 are claimed to consume 2.7 kWh/kg for compression of hydrogen from 5 to 900 bar, which corresponds to a loss of about 8.1%, which is quite close to the theoretical loss of 5.3% for isothermal compression by a factor of 180.
For the electrochemical hydrogen compressor (EHC), in which hydrogen is concentrated and/or compressed from the anode to the cathode, an isothermal behavior is expected as well.54–56 For instance, for a single-stage EHC, for compression from 10 to 400 bar, an energy requirement of 3 kWh/kg was reported,57 which corresponds to a loss of about 9.0% compared to the theoretical isothermal loss of 3.8% at room temperature. However, with thinner and/or less hydrogen permeable membranes the efficiency of the EHC could improve, making it industrially viable.
Pressurized electrolysis
Today's commercial electrolyzers produce hydrogen (and oxygen) at gas pressures in the range of 30–50 bar. However, on the prototype level direct electrochemical compression in PEWEs up to 700 bar (differential) pressure has been demonstrated.12,58,59
Theoretically, the compression loss in a PEWE can be predicted by the Nernst equation (see Equations 4 and 5), where for the calculation of the equilibrium potential assumptions for the activity of gases and water need to be made. For the solubility of hydrogen and oxygen in water up to 100 bar ideal gas behavior for both H2 and O2 can be assumed,60–62 because at thermodynamic equilibrium conditions only the dissolved gas in the water is in contact with the electrodes. Consequently, the activities can be expressed by the partial pressures. The activity of water is assumed as unity.
According to the Nernst equation (see Equations 4 and 5), the thermodynamic cell voltage at 60°C increases by 33 mV per decade of pressure for differential pressure operation (O2 at atmospheric pressure) and by 50 mV per decade for balanced pressure operation (both gases at higher pressure). While the increasing thermodynamic cell voltage can largely be seen in the differential pressure operation, demonstrated up to 700 bar,12,58,59,63 as well as in electrochemical hydrogen compressors,56,57 in experimental data of pressurized PEWE with balanced gas pressures, at relevant current densities, the cell voltage increase with operating pressure is often not observed.64–66 In this case, processes with a negative overpotential vs. pressure relation are compensating the higher thermodynamic cell voltage. These processes may be kinetic phenomena due to a higher apparent exchange current density and/or improved two-phase flow in the porous structures due to lower gas volumes.64,67 Gas compression in the electrolyzer at balanced pressure seems energetically inexpensive. However, for efficiency considerations the gas crossover increasing with pressure and reducing the faradaic efficiency68 needs also to be taken into account.
The gas crossover can be expressed by a current density equivalent as defined in Equation 9:
![Equation ([9])](https://content.cld.iop.org/journals/1945-7111/164/4/F387/revision1/d0009.gif)
where P is the gas permeability, δ is the membrane thickness, z is the stoichiometric factor (z = 2 for H2, z = 4 for O2) and p is the partial pressure of the respective product gas. For operating pressures higher than 5 bara, the water vapor pressure is small compared to the partial pressure of the gas, hence the latter can be approximated by the total pressure.
According to Schalenbach et al.69 the gas permeability for PFSA membranes (e.g. Nafion) increases by about one order of magnitude from the dry to the wet state. Furthermore for wet Nafion, with a temperature increase from 40 to 80°C the gas permeability increases about threefold. With reported values for gas permeability for wet Nafion at 80°C of 5.32·10−11 mol·cm−1·s−1·bar−1, the hydrogen gas crossover current density equivalent (normalized to the partial pressure) for a 7 and a 2-mil thick Nafion membrane is about 0.49 and 1.63 mA·cm−2·bar−1, respectively. Finally, the faradaic losses due to crossover at elevated pressure, where only the hydrogen gas crossover is considered, can be calculated (with p2 as the hydrogen pressure), Eq. 10:
![Equation ([10])](https://content.cld.iop.org/journals/1945-7111/164/4/F387/revision1/d0010.gif)
The corresponding compression losses, including permeation, for four current density/membrane combinations (2 and 7 mil PFSA membrane at 1, 2 and 10 A/cm2) are compared in Figure 4b. Generally, the losses due to crossover decrease with increasing current density (assuming that the crossover is current density independent). Exemplarily, at 100 bar the losses for cells with a 7 mil PFSA membrane at 2 A/cm2 and a 2 mil PFSA membrane at 10 A/cm2 are around 2.5% and 1.6%, respectively. In case of balanced pressure operation, oxygen crossover of about half of the hydrogen value should be taken into account as well.70 Permeated oxygen recombines partly or completely at the cathodic platinum catalyst, reducing the faradaic efficiency further.
When assuming that hydrogen is produced by electrolysis and neglecting any possible additional losses or safety issues, it is possible to directly compare the compression losses for mechanical and electrochemical compression as shown in Figure 4. It can be seen that pressurized PEWE is energetically favorable as compared to ambient PEWE combined with downstream isothermal compression over a wide pressure range, e.g. up to about 100 bar for a 7 mil PFSA membrane and a current density of 1 A/cm2.
Besides efficiency, also safety aspects need to be discussed for operation at elevated pressures. Therefore in Figure 4b the expected H2 concentrations in O2 for the four current density/membrane combinations, as well as the corresponding lower explosion limit (LEL) of H2/O2 mixtures for differential and balanced electrolysis are plotted. The LEL increases with increasing pressure and slightly decreases with increasing temperature. Here experimental data of Schröder et al.71 for 80°C up to 200 bar is extrapolated toward 1000 bar.
Current density
Production of gases in the PEWE cell is directly proportional to the current density applied. Increasing the current density while maintaining conversion efficiency by using thinner membranes is an approach for increasing the rate of H2 production per unit cell area of the PEWE. Current densities up to 19 A/cm2 have been reported using a 50 μm thick membrane, with a cell potential of 3 V.24 The associated power density is on the order of 50 W/cm2. The excess heat from operation at elevated current densities needs to be properly managed to prevent or alleviate degradation. Operation at elevated current densities is also an option to control the effect of gas crossover. Hydrogen gas produced will permeate across the CCM to the anode side driven by diffusion and differential pressure,68,69 and mix with the oxygen produced at the anode creating a safety hazard as discussed before. At high current densities hydrogen in oxygen gas will be diluted by the increased oxygen production rate.68,72 However, the hydrogen permeation rate as function of current density is not fully understood and might be influenced by CCM heterogeneities73 or other effects, such as the electro-osmotic drag of water. Variable electrolyzer stack operation invariably calls for designs and engineering solutions that allow operation over a broad range of current densities. The hydrogen in oxygen content is mainly a tradeoff between membrane thickness, gas pressure and current density and to a lesser extent also to temperature (higher cross-over at higher temperatures, see above). Thinner membranes allow for higher current density at a given cell voltage, and thereby effectively decrease the investment costs for the electrolyzer stack, but with the challenges related to the gas crossover, as illustrated in Figure 5b showing simulated polarization curves of an electrolyzer with PFSA membranes of different thickness.
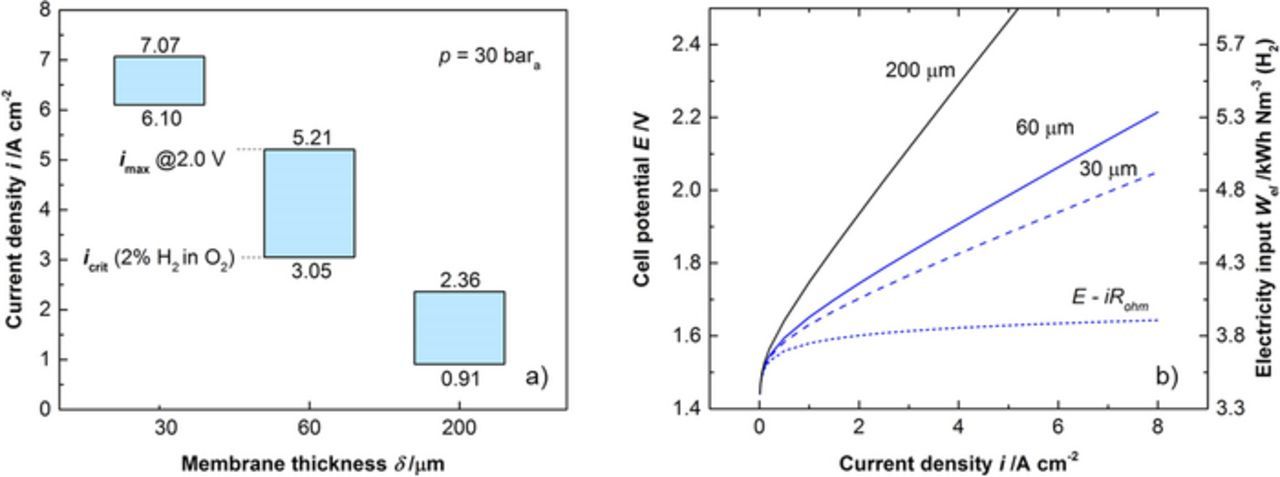
Figure 5. a) The turndown ratio of cells using membranes of different thickness. The upper bound imax is given by the maximum cell voltage of 2.0 V, corresponding to an electricity input of 4.78 kWh/Nm3(H2) or an efficiency of 74.1% HHV, the lower bound icrit is given by the limit of 2% of hydrogen in oxygen. b) Simulated polarization curves of an electrolyzer using PFSA membranes of different thickness (σ = 146 mS/cm).
Turndown ratio
Besides pressurized operation and associated faradaic losses, also the operational range, which is also referred to as 'turndown ratio', is of interest. For illustration, the turndown ratio of a PEWE cell with balanced pressure is calculated for an operating pressure of 30 bar and at 80°C as a function of the membrane thickness (Figure 5). The upper bound for the current density corresponds to a maximum cell voltage of 2 V, whereas the lower bound is determined by a maximum of 2% H2 in O2. Thus the current density range is limited between a minimum determined by gas crossover and a maximum as a result of the corresponding overpotentials. In this particular case the turndown ratio for 7, 2 and 1 mil PFSA membranes is limited to a factor of 2.6, 1.7 and 1.2 or 61%, 41% and 14% of the maximum current density, respectively. Thick membranes do not allow high operating current densities due to the larger ohmic overpotentials, but have good gas barrier properties. On the other hand, thin membranes are limited in the lower range of the operating currents, since at low current densities the mixture of anodic gases can be explosive. Increasing the pressure imposes another limit on the lower current density due to the higher gas crossover. It is of course possible to expand the operation range by increasing the upper current density at the expense of voltage efficiency, or by decreasing the lower boundary by reducing the gas crossover by using less permeable membranes (cf. Materials and components section) or by employing gas recombiners, e.g. by coating PTLs or flow fields with Pt or Pd.72
Ambient vs differential vs balanced PEWE
So far, different aspects addressing the operational conditions (temperature, pressure and current density) and related challenges were presented. Furthermore, considering technical applications of PEWE a number of boundary conditions have to be taken into account (e.g. H2 and/or O2, purity required, final pressure, investment vs. operating cost, etc.) which would be a study on its own. Here we discuss the general advantages and disadvantages of ambient, differential (only H2 pressurized) and balanced (H2 and O2 pressurized) PEWE using key characteristics, summarized in Table II.
Table II. Comparison of key characteristics of ambient, differential and balanced pressure PEWE;12,47,66,126–128 (++) very good, (+) good, (o) neutral, (-) bad, (–) impossible.
| Property | Unit | Ambient | Differential | Balanced |
|---|---|---|---|---|
| Purity H2 | O2% in H2 | ++ | ++ | + |
| Purity O2 | H2% in O2 | ++ | o | o |
| faradaic efficiency | % | ++ | + | o |
| Liquid water above 100°C | − | – | – | + |
| Mechanical stress inside cell (e.g. PTL/membrane) | − | ++ | − | + |
| Stack and system engineering/costs | €/kW | o | − | − |
| Safety | − | ++ | o | o |
| Downstream pressurization H2 | kWh/Nm3 | − | ++ | ++ |
| Downstream pressurization O2 | kWh/Nm3 | − | − | ++ |
| Downstream gas drying H2 | kWh/Nm3 | − | ++ | ++ |
| Downstream gas drying O2 | kWh/Nm3 | − | − | ++ |
For hydrogen at ambient pressure, efficiency and gas purity will be best with ambient electrolysis at the expense of increased drying efforts with the large gas volumes. For pressurized hydrogen, differential pressure PEWE is preferable due to higher gas purity and higher faradaic efficiency compared to balanced operation and lower gas drying costs compared to ambient operation combined with mechanical compression.12 In case pressurized oxygen is of interest too, balanced pressure PEWE is the method of choice, because of lower efforts for drying and compression for both gases.
Transport Processes (2-phase)
In PEWE liquid water is supplied to the anode where oxygen is evolved, meaning that the water and gas are moving in counter-flow in relation to the membrane, while at the cathode hydrogen and liquid water transported by the electro-osmotic drag74 results in a co-flow configuration. It is therefore obvious to consider two-phase transport issues in the porous layers, where a more complex behavior is expected at the anode due to the counter-flow situation.
Structure of porous layers
For the porous transport layers ex-situ diagnostic tools are commonly used to characterize their structure. As the anodic PTL usually only consists of titanium the porosity can easily be obtained by weighing. For composites based on different types of titanium or even based on carbon including binders, the issue is more complex.
Pore size distributions can be measured by mercury intrusion porosimetry (MIP), capillary flow porometry and/or X-ray tomographic microscopy (XTM) combined with image analysis.75,76 Especially XTM is a powerful tool to obtain data for anisotropies, tortuosities and particle size distributions among others.76 Figure 6 shows XTM derived data for sintered powder materials made of titanium (porosity of 46% and a mean pore diameter of 17 μm).
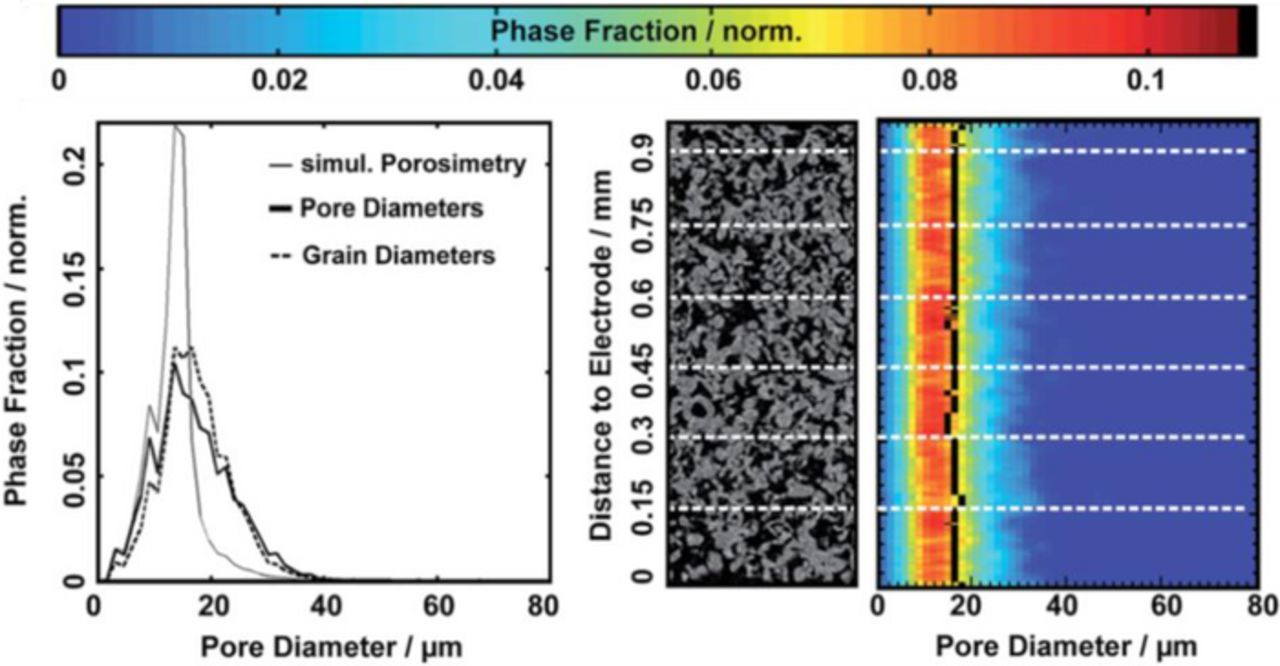
Figure 6. Partly reproduced from Ref. 76. Left: global size distributions (pore, solid and simulated pore); middle: crops of an original X-ray reconstruction image; right: locally resolved pore size distributions. The mean pore size is depicted as a black vertical line.
With known geometric parameters transport properties, such electrical and thermal conductivities, as well as permeabilities can be derived. Zielke et al.76 reported two characteristic relationships: i) an exponential relation between porosity and thermal conductivity and ii) an exponential relation between through-plane electrical conductivity and water permeability.
Gregoriev et al.77 and Ito et al.48,75 investigated sintered titanium spherical powders and titanium felts decorated with titanium powder on the top surface. Based on electrochemical measurements at atmospheric gas pressure and at temperatures of 80 and 90°C, even for distinctly different structures in terms of spherical powder and fibers, agreement of key parameters and their influence on performance was reported. The porosity of the PTL is claimed to be optimal between 30 and 50%.48,75,77 Theoretically, a higher porosity should facilitate gas transport and water supply at the expense of a higher ohmic resistance and higher thermal resistance. A mean pore diameter (MPD) larger than 10 μm, but close to this size, was considered optimal. Larger MPD lead to increased parasitic ohmic losses due to inhomogeneous distribution of current in the catalyst layer. The mean particle size (MPS) of a spherical powder seems to have an optimum between 50 and 75 μm. Larger MPS might increase the contact resistance. Smaller MPS tend to increase the mass transport losses due to capillary effects. For fibrous materials, Ito et al.48,75 reported that a mean fiber diameter of 20 μm seems to be preferable to 80 μm due to a better electrical contact between PTL and CL.
Transport processes and possible losses
Only few reports about the two-phase flow are available, with the main focus on the channels in the flow field.
Simulating an electrolysis environment using different microfluidic chips as model structures for Ti felt, foam and sintered powder Arabi et al.78 showed that the transport mechanism of air bubbles is capillary dominated even at high gas flow rates. Furthermore the (produced) gas is released in pathways within the PTL which are independent of the water flow rate in the channels.78 Thus the gas bubbles grow at the electrode surface until the buoyancy and shear forces acting on a bubble exceed the adhesion force.44
In an electrolyzer, larger pores in the PTL tend to change the flow regime in the channels of the flow field from a preferred dispersed bubbly into a slug flow,75 meaning that the gas bubbles coalesce, which can be avoided by higher water velocities in the channel.79
Using high-speed photography and an optically transparent cell, Dedigama et al.79 noticed a transition from bubble to slug flow in the channels of the flow field at higher current densities and with progressive channel length, which was associated with improved mass transport. Furthermore, the authors underlined this conclusion by the reduction or nonexistence of a second impedance arc in the electrochemical impedance spectra at low frequencies at high current densities. In subsequent work using current density mapping, an increased current density was measured toward the channel outlet.80 However, there is no comprehensive understanding of the current density distribution as van der Merwe et al.81 reported a decreasing current density along the channel, interpreted as a result of increasing oxygen gas to liquid water ratio. Such inconsistences might be explained by the differences in thermal boundary conditions, flow field or PTL structures.
Through-plane neutron radiography and high resolution optical visualization were used to show that gravity and buoyancy affect the water distribution across the cell as gas bubbles tended to accumulate in the higher regions of the cell.82
With the same imaging technique Hoeh et al.83 quantified the amount of gas in the anodic channel as a function of current density and water flow rate, results are exemplarily shown in Figure 7. As expected, the ratio of gas to water decreases with increasing water flow rate and increases with increasing current density.
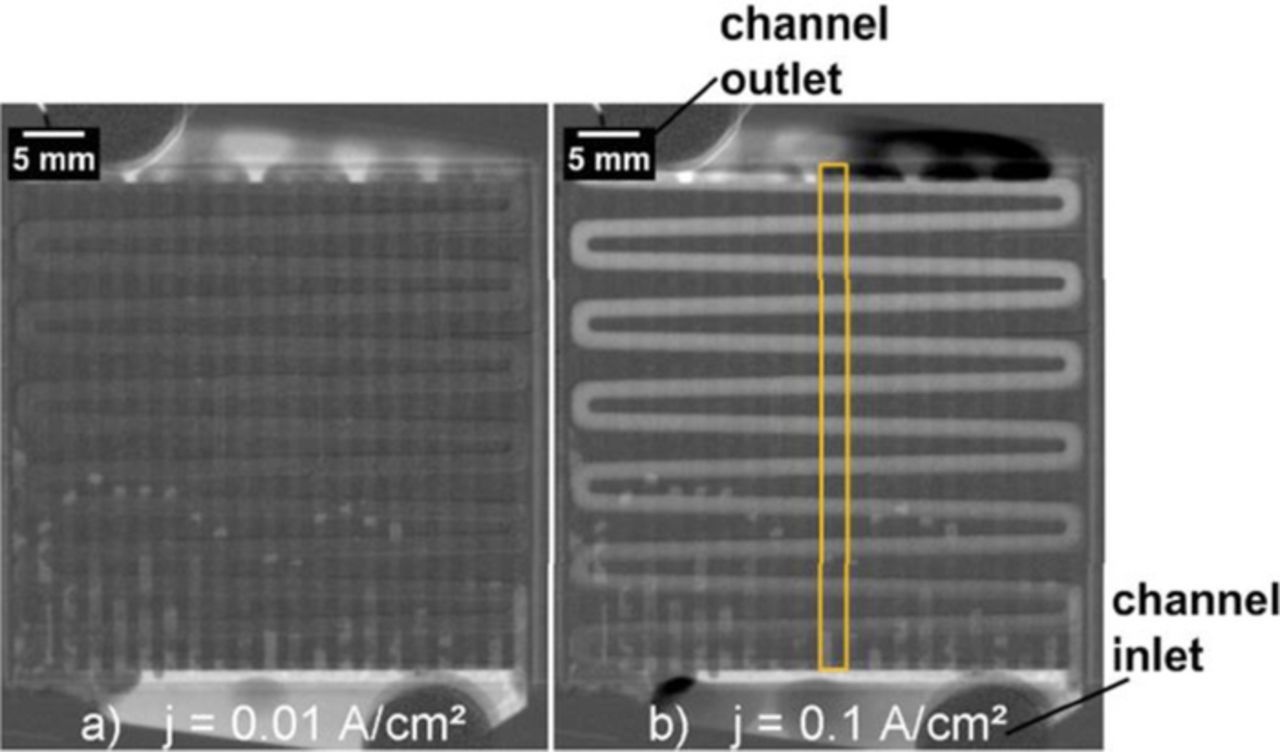
Figure 7. Partly reproduced from Ref. 83. Image series of neutron radiographs of the cell at current densities of a) 0.01 A/cm² and b) 0.1 A/cm² and anode water flow rate of 0.5 ml/(min cm²) from the channel inlet (bottom of the cell) to the channel outlet (top of the cell).
First approaches in a real electrolyzer were performed by using X-ray radiography in in-plane direction to investigate the cathodic interface of PTL and BPP and in through-plane direction for the anode.84 The authors confirmed the presence of gas transport pathways whose number increases with increasing current density.
Using in-plane neutron radiography for a small 1 cm2 differential cell, Seweryn et al.85 observed that the water/gas distribution inside the PTL is unaffected by the current density up to 2.5 A/cm2, which is interesting in terms of possible transport losses. This is the only work which is investigating the PTL under real electrolyzer operating conditions (temperature and pressure). Entirely missing are reports addressing the interface of the PTL/CL or the CL itself.
Degradation Phenomena
Using the PEWE technology for buffering excess electricity from the "renewables-rich" grid implies an intermittent operation of the cell. If the cell is not kept at a predefined idle condition during periods without excess energy in the grid, frequent start-stop transients will have to be dealt with. Start-stop cycling in polymer electrolyte fuel cells has a strong effect on the cell lifetime,86 and remains still unexplored in the case of PEWE. In order to scale-up or improve the current PEWE technology and increase its share in the hydrogen production mix, it is necessary to understand the lifecycle of its key components (CCM and PTLs). The limited market provides a small sample of field data and degradation experiments in scientific literature are scarce compared to its sister technology, the PEFC. Moreover, AST protocols to trigger and monitor specific degradation mechanisms are lacking. The most straightforward method for diagnosing degradation is to monitor the increase in the cell/stack voltage. The US Department of Energy (DOE), which in the past had endorsed AST protocols for PEFC technology, reports a voltage degradation rate in the range of 2–6 mV/1000 h for modern PEWE systems.87
Known degradation mechanisms
Compared to the PEFC literature, PEWE degradation studies are scarce. Most of the literature is focused on the degradation phenomena related to the CCM.88–94 Typical membrane degradation originates from thermal, chemical and mechanical stressors present during operation.95 Polymer membranes, usually PFSA membranes, e.g. Nafion, are susceptible to radical induced attack and degradation, which leads to the gradual decomposition of the ionomer. Reactive intermediates, such as hydrogen peroxide (H2O2), hydroperoxyl (HO2•) and hydroxyl (HO•) radicals, are formed primarily by the crossed-over gases on the catalytic surface,95 of which HO• has the highest oxidative strength.96 These oxidizing species attack the ionomer, leading to chain scission, unzipping, and loss of functional groups. Stucki et al. have observed significant membrane thinning after 15,000 hours of PEWE stack experiments with varying electric input, which eventually led to a short circuit in one of the cells of the stack.93 The degradation was attributed to cathode-side chemical decomposition of the ionomer with eventual scission of the polymer chains.
The fluoride release rate (FRR) is a commonly used metric for quantifying the chemical degradation rate of PFSA membranes and predict the lifetime.88,90,97 LaConti et al. showed that the FRR increases approximately by two orders of magnitude with a temperature increase from 55 to 150°C.90 Based on the literature reports, the cathode side degradation of the membrane is more pronounced as a result of radical formation triggered by O2 crossover and interaction with hydrogen adsorbed on the Pt catalyst of the cathode.90,93,98 Also, the electroosmotic drag creates higher concentration of H2O2 on the H2 side. Additionally, the anode catalyst on the O2 side in the PEWEs is at high potential. Hence, the surface of the Ir-based anode catalyst is in the oxide form, which can suppress the direct combination reaction of H2 and O2.95
In terms of structural integrity of the membrane, its mechanical properties are of importance, i.e., the yield, tensile strength and elongation at break. Moreover, time-dependent behavior is critical for long-term operation in the PEWE cell, and creep of the ionomer can be the factor limiting the lifetime of the membrane.30,59 Evidently, mechanical properties of the membrane strongly depend on temperature and humidity. Measuring the stress-strain relationship of immersed Nafion 117 shows that the initial slope of the stress-strain curves, and thus the Young modulus, decreases with increasing temperature.99 Softer membrane material could prove less reliable in high-pressure or differential pressure operation modes.
Excessive compression of the cell can lead to damage of the PTL and CCM material. Microscopy techniques are commonly used to visualize morphology changes before and after electrolysis operation. For instance, using scanning electron microscopy (SEM) the morphology change of a catalyst coated membrane (CCM) during electrolyzer operation is illustrated in Figure 8. Clearly the CL is deformed by intrusion into the PTL structure. A similar example (top view) of the anodic side of a CCM after 100 h of electrolyzer operation including cracks caused by excessive cell compression is shown by Millet et al.100
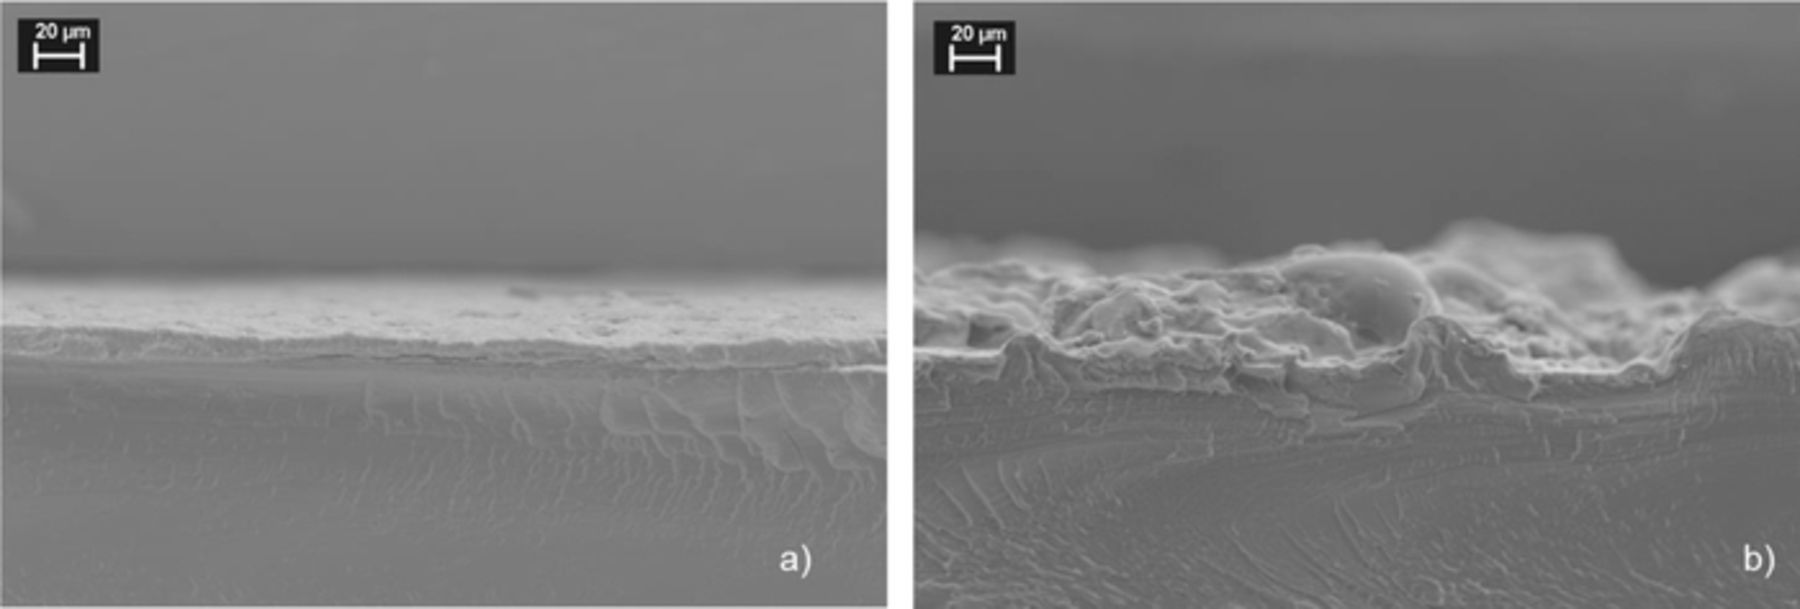
Figure 8. Cross-section SEM images of: a) unused CCM with anode catalyst layer, b) used CCM after electrolysis operation and disassembling of the cell showing an imprint of the anode PTL at its surface.
Performance deterioration is mostly related to problems with the purity of feed water, and is a reversible degradation mechanism.101 Metallic cations are dissolved in the de-ionized water that is circulated through the system components made of stainless steel. The cations contaminate the membrane by exchanging with protons in the PFSA material, which leads to decreased proton conductivity. Sun et al.92 have confirmed the reversibility of the ion-poisoning mechanism when they measured Cu, Fe and Ca contamination of the MEAs before and after 7800 hours of operation in a 9-cell electrolyzer stack using electron probe microanalysis. The increase of the content of these elements is more pronounced in the anode and membrane region compared to the cathode. After treating the MEAs with 0.5 M sulfuric acid, the content was at a similar level to the one before the electrolysis test, showing the reversibility of the performance loss by ion-poisoning. When the membrane is contaminated by transition metal cations, they can promote the chemical decomposition of hydrogen peroxide and generate radicals, which accelerates membrane thinning.95,102 Iron and copper ions drastically increase membrane degradation, while cobalt and chromium ions do not appear to play a significant role.103 One way to counter the cationic contamination of the membrane and the catalyst is to substitute metal system components (e.g. fittings, piping) with polymer materials. However, this is only possible for low-pressure electrolysis, as the high-pressure rated system components are almost exclusively made of stainless steel. Maintaining high-purity water could extend the CCM lifetime significantly, but current ion-exchangers on the market are not rated for high pressure and temperature operation, and the water purification is mainly done outside of the loop or at low operating temperatures and pressures.
High potentials limit the use of stainless steel cell components due to corrosion.104 Titanium is the state-of-the-art material for (anodic) PTLs and BPPs of the PEWE cell due to its stability and intrinsic electrical conductivity. Ti can however develop an oxide layer over time, thus reducing the effective electrical conductivity and cell performance. When the reversible cationic contamination of the ion-exchange sites is mitigated, the Ti-PTL passivation is the main contribution to the performance deterioration.105 Additionally, on the high pressure H2 side of the system (cathode), Ti-hydride formation can be significant, which in turn weakens the Ti.106 Coating the Ti parts is often mentioned as a way to protect against oxidation. Coatings of Ti, TiN, Pt or Au on stainless steel or carbon-based composites are possible candidates for the cathode BPPs and PTLs.12,26
Accelerated stress tests
Unlike in the case of fuel cells, there are no standardized AST protocols for PEWE components, which makes the experimental results across the literature difficult to compare. The aging of components is on the other hand an important attribute, considering the DOE target for component replacement intervals being as high as 10 years.107 There are no standardized sets of stressors and testing protocols to trigger the degradation of specific components. Research efforts in the scientific community are mainly targeted at demonstrating the long term stability of materials, and give a degradation rate in μV/h as a degradation metric. However, with variations in hardware and operating conditions, it is difficult to correlate the testing parameters with changes in degradation rate.
Techno-economic Considerations
Small scale hydrogen generator laboratory systems (typically hundreds of Watts, a capacity in the order of few g/h of hydrogen used e.g. as carrier gas for chromatography applications and for detectors) based on PEWE are commercial products and tens of thousands of units have been sold in the past 20 years. This market is exclusively covered by PEWE, due to long-term stability, fast and easy start-up, dynamics and low maintenance. This market will certainly remain to PEWE technology.
For larger scale installations (kW to tens of kW, corresponding to capacities up to about one kg/h) still the number of deployed PEWE systems is moderate, with numbers probably only on the order of one thousand worldwide. The main markets here are industrial applications such as heat treatments, vapor deposition, hydrogenation, generator cooling, and also oxygen supply for submarines. In this field alkaline water electrolysis is the incumbent technology due to proven long term stability and typically lower capital cost today.
PEWE systems with power of hundreds of kW or even MWs (capacities of few to dozens of kg/h of hydrogen) have appeared on the market in about the past 5 years. While to date there are no purely commercial power-to-gas installations, more than a dozen (partially) publicly funded installations exist in Europe alone. These installations allow to explore and carefully assess different electrolyzer concepts, power ranges and hydrogen utilizations.
The installations MYRTE in Corse,108 as well as ESI in Switzerland,109 both in the 100 kW range, also store the oxygen from the electrolysis process. In these locations, the cost for storing oxygen vs. the improvement of the efficiency for re-electrification of hydrogen in fuel cells,110 increasing the round-trip-efficiency for the power-to-hydrogen-to-power storage process, is investigated. If hydrogen is used for electricity storage only, this might therefore be an attractive way, however when storing hydrogen/oxygen in gas tanks, energy storage for single sites will probably be limited to the order of 100 MWh.
Today's largest deployed PEWE system, with a maximum electrical input power of 6 MW, is located at the power-to-gas plant in Mainz (Germany).111 At this location hydrogen can also directly be fed into a natural gas pipeline. The direct feed-in of hydrogen into natural gas pipelines is limited to different levels, depending on national or local legislation, but cannot exceed typically 10%. If only hydrogen is stored then also storage in underground caverns, where existing, seems possible and would allow to store energy up to 100 GWh per site.112–114 Hydrogen can be re-converted to electricity for the grid but can also serve as clean fuel for mobility or feedstock for the chemical industry.
Future production of hydrogen by electrolysis in large scale installations for transportation, industrial use, and hydrogen as energy storage vector, will increase over the next years although the rate may differ from sector to sector and will be heavily influenced by individual countries' policies (which are, for energy storage on the grid level, largely lacking, at least within the European Union, creating large uncertainties for industries and the market).115 In the timeframe until 2030, specifically the transportation and energy storage sector are expected to experience significant deployment of hydrogen-producing technology. Policies for realization of alternative fuel infrastructures with hydrogen are underway in the European Union, in Japan and some US states, concomitant with increased deployments of fuel cell driven cars. The energy sector using hydrogen as storage vector shifting produced renewable energy in time and possibly markets is another driver for deployment of water electrolysis systems. The central role that hydrogen can play here is based on its flexible use: it can connect transportation applications, direct re-electrification (e.g., using H2-O2 fuel cells110), feed into the natural gas grid but also as serve as hydrogenation agent to convert CO2 into synthetic natural gas or even liquid fuels. In both markets, hydrogen refueling stations (HRS) and power-to-gas energy storage, also alkaline technology is used, as dynamic operation is not always a prerequisite and capital cost today is still lower for alkaline electrolysis. The technology has a proven record for long-term operation of MW systems, in particular for the ammonia synthesis application. However, the possibilities of fast start-up and dynamic operation with large differential pressures in compact units are an important asset, making PEWE a strong contender. Also solid oxide water electrolysis (SOEC) may become a competitor in the future for these applications, due to efficient operation and thus reduced operating cost. But the technology readiness level is still in the research stage and it is not clearly evident at the present time for which niches the restrictions regarding heat management or start-stop procedures will permit application of SOEC technology.
Future penetration of the market by large PEWE systems will largely be determined by the cost of hydrogen produced. Hydrogen cost is composed of operating expenditure (opex), which is dominated by the cost of power, and investment cost (capital expenditure, capex) comprising stack, power electronics, gas cleaning installation and other up-front costs. Today's cost of electrolytic hydrogen from PEWE is in the order of 4–8 $/kg.9,116 Capex is around 1500 $/kW today,9 see Figure 9. With an increasing number of installations, transition from manufacturing to high-volume production, concomitant with supply chain optimization, capex is projected to decrease by 2030 to ca. 300 to 1200 $kW−1 (in reasonable agreement with values given in Refs. 14,116 and references therein) although it is obvious that the uncertainty significantly increases for the 2030 predictions.
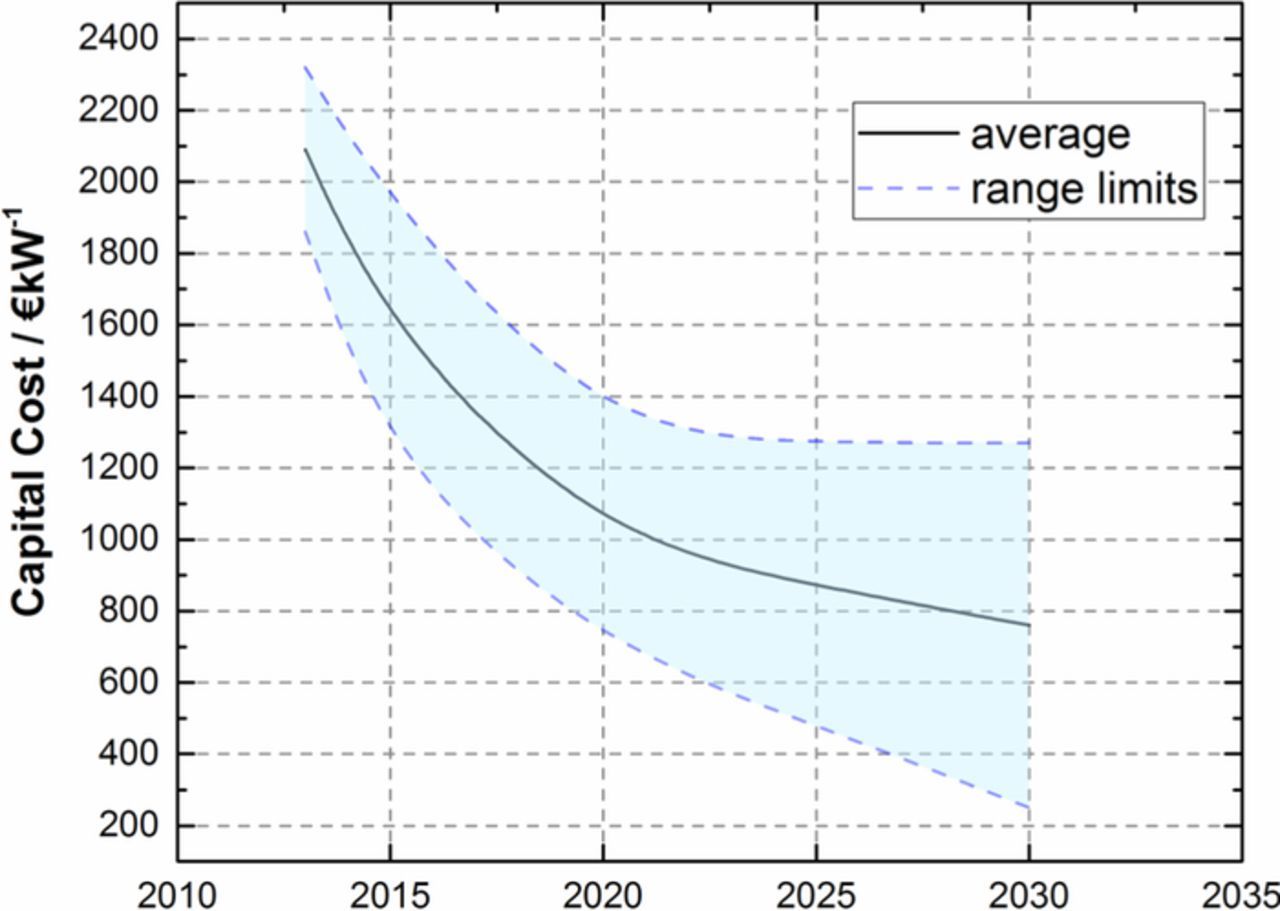
Figure 9. Projected PEWE system capital cost development until 2030. Data taken from Table 4 in Ref. 9, Values include power supply, system control, gas drying; they do not include grid connection, external compression and purification, and hydrogen/oxygen storage. The numbers are based on confidential information (academia, electrolysis system manufacturer, and utility companies). For details we refer to Ref. 9.
For the estimation of future hydrogen cost, the power cost sets a theoretical lower limit, i.e. at 0.039 $/kWh it is 1.55 $/kg H2,116 assuming no electrochemical losses occur and all energy is supplied as electricity. Considering the predictions for 2030 of reducing capex the cost of hydrogen produced by PEWE is expected to fall to 2.5 to 4 $/kg9,116 assuming 1€ = 1$).
An important factor potentially helping to reduce electrolyzer system and hydrogen cost will result from future technical developments and improvements. Looking at a PEWE system cost breakdown (Figure 10) it is obvious that the stack is the most cost intensive part of a PEWE system with the plates and flow-fields requiring the largest fraction.9,117 Surprisingly, the noble metal catalysts in the two studies only hold 8–13% of the share in stack cost. For any further cost reduction through innovation, work is required to focus on those stack parts which have highest cost shares and those that have the largest impact on stack performance. Specifically, any component improvement concomitant with increased cell efficiencies will directly help to decrease stack size (effectively reducing the number of cells and bipolar plates used), creating a strong effect on the overall stack cost.
The worldwide electrolysis installations, if all primary energy is solar/wind and hydrogen the major storage vector, would require a capacity of several TW of PEWE, corresponding to a production rate of over 107 t/h hydrogen. This large capacity raises the question about the availability of iridium as anode electrocatalyst. At 4 W/cm2 and 2 mg/cm2 Ir, state of the art technology requires 500 kg Ir/GW. Considering that today's Ir production rate is about 4 t/a, the utilization of 25% (1 t/a) would allow for new PEWE capacity of 2 GW/a (a hydrogen production capacity of about 40 t/h) with this technology. Because iridium is a secondary metal typically mined as a by-product of the Pt, Cu and Ni production, its availability will always be determined by the production rates of the primary metal.118 This underlines the importance of advancing the technology to higher current densities and lower specific catalyst loadings. Based on recent developments with low catalyst loadings using supported catalysts22,24,119 improvements with values of 50 kg/GW installed capacity (10 W/cm2 and 0.5 mg/cm2 Ir) seem feasible to reach a mature state of development within the next decade and developments up to 10 kg/GW can be expected on a longer-term timeframe. Assuming constant Ir production, this then allows for annual capacity additions of 100 GW/a (corresponding to 2,000 t/h of hydrogen), which would be sufficient for enabling PEWE as the major hydrogen producing technology for renewable energy storage. It also underlines the need to increase specific power densities in future developments to reduce Ir requirements.
Technology Gaps & Development Needs
As outlined in the above chapters, for energy applications PEWE technology needs to make progress in the areas of materials, operating conditions, durability and economics. Although PEWE technology for H2 (and O2) production at low capacity (well below 1 kg(H2)/h) has been on the market for several decades, these systems have been largely overengineered in terms of the materials used and not optimized for levelized cost of hydrogen produced. For economic viability in the energy sector, investment cost (capex) and operating cost (opex) of water electrolyzers need to be reduced. In addition, assessment of cell and stack lifetime calls for accelerated testing protocols, which require an improved understanding of degradation mechanisms and component aging phenomena. The most important technology gaps identified in the above chapters are therefore summarized in Table III with the related topic indicated. Table III shows that for closing these gaps multi-disciplinary approaches and reasoning are required. There correlations between the different development goals are complex, coupled and typically associated with trade-offs. Hence the main topics for future development are discussed in the following.
Table III. Technological gaps/goals for future PEWE development for energy applications.
| Operating | ||||
|---|---|---|---|---|
| Gap/Goal | Materials | conditions | Durability | Economics |
| Higher current density | X | X | X | X |
| Higher operating temperatures | X | X | X | X |
| Lower catalyst loadings | X | X | X | |
| Understand gas cross-over mechanisms & effects on safety and efficiency | X | X | X | |
| Understand two-phase transport losses & materials properties relationships | X | X | X | |
| Replacing Ti as structural material | X | X | ||
| Define ASTs for durability assessment | X | |||
| Understand effects of dynamic & intermittent operation | X | X | X | |
| Techno-economic analysis on the system level | X |
Many of the development goals are aimed at reducing investment costs of PEWE to narrow the gap to alkaline electrolyzers. All the modifications and measures that lead to a flattening of the polarization curve allow an increase of operating current density at a given conversion efficiency, which reduces the total cell area required to achieve a given target H2 production rate. These include the use of thinner membranes with correspondingly lower ohmic resistance and porous transport layers with low mass transport losses. With an adequate choice of components, nominal current densities of 4 A/cm2 and more appear reasonable. It may be argued that electrolyzer performance can be increased by increasing the catalyst loading, especially on the anode. This is to some extent true, yet in terms of overpotential there is an optimum catalyst loading, above which ionic transport losses in the catalyst layer become limiting.120 In contrast, there is considerable potential to lower catalyst loading, on both anode and cathode, in going to different catalyst materials, such as the nanostructured thin film (NSTF) catalyst from 3 M or other extended surface catalysts, and, for the anode, Ir-based catalysts supported on oxides with high specific surface area.
The approaches just highlighted can also serve to reduce operating cost, since it is dominated by the cost of electricity. Hence, conversion efficiency improves if the cell voltage at a given current density is lowered. Faradaic efficiency governs losses at low current density due to gas crossover, thus membranes with improved gas barrier properties are required. A wide operational range in terms of current density is of particular importance when the electrolyzer is to be operated with variable input. A high turndown ratio requires membranes with low ohmic resistance as well as low gas permeability. There is tremendous potential for alternative membranes. Many classes of hydrocarbon or partially fluorinated membranes exhibit significantly improved gas barrier properties compared to PFSA membranes at similar or better conductivity. Use of such materials, provided chemical and mechanical stability requirements are met, can greatly improve performance and operational range of an electrolyzer.
The structural materials, i.e., porous transport layers, bipolar plates and cell frames, offer potential for significant reduction of cost, since these components contribute about 2/3 of the stack cost (Figure 10). Already notable cost reductions have been made here through improved design and engineering of the stack repeat unit and elimination of high-cost metallic components.116 The type of PTLs used in many cell designs, such as porous sinter metal elements, have not been designed for this application, hence the material is not optimized for the purpose. Alternative and novel methods for preparing PTLs with optimized structure and design at lower cost ought to be identified and implemented. A microporous layer, as used in the gas diffusion layer of fuel cells, is a desirable feature to implement to provide a smooth interface to the catalyst coated membrane, which is of particular importance in case of thin membranes and high differential pressure operation to minimize mechanical failure. The use of coated, lower-cost, non-titanium structure materials can help to reduce investment cost.
The topic of increasing the operating temperature to 90°C or higher deserves in-depth contemplation. The significant improvement in performance (i.e. flattening of the polarization curve) is a result of, to a minor degree, a lower reversible cell potential (E°rev decreases by ∼30 mV in going from 60 to 95°C) and mainly related to a lower membrane resistance and increased catalyst activity. Owing to the limited thermal stability of ion exchange resins used for water pretreatment, two different temperature levels may be required on the system level for stack and ion exchange bed. The main challenge associated with a higher stack temperature, however, is an increased rate of component aging. Membranes using PFSA ionomer soften considerably and are susceptible to creep,30 which calls for mechanical reinforcement of membranes. This is likely also to be required for non-PFSA membranes. The rate of chemical degradation of PFSA membranes in a PEWE increases with an apparent activation energy of ∼55 kJ/mol, which leads to 6-fold reduction of lifetime at 95°C compared to 60°C.90 Therefore, for PFSA membranes end-group stabilization121 and addition of regenerative radical scavengers122 will be required. Higher temperature is also expected to increase the rate of catalyst degradation, the mechanisms of which need to be better understood.116 The corrosion of structural parts will increase and with it the release of metal cations, which will ion exchange into the ionomer and decrease performance. Moreover, Fenton-active metal cations (e.g., Fe2+) will catalyze the formation of HO• from H2O2 and thereby accelerate membrane degradation. Therefore, structural components with improved corrosion resistance will be required, either through coating or selection of a more stable bulk material.
The operating pressure level of an electrolyzer will depend on its application. The option of electrochemical compression is an interesting one as this could lead to a partial or complete elimination of mechanical compression. Also, operation with differential pressure with low pressure on the oxygen side is of interest from a system point of view to reduce balance of plant requirements of the oxygen subsystem. Therefore, component, cell and stack design for high pressure operation, e.g. membranes with improved gas barrier properties, ought to be promoted.
The most prominent challenge for electrolyzers with improved performance and lower cost based on the measures mentioned so far is the durability target of several tens of thousands of hours, in particular in view of the anticipated operation under dynamic and intermittent condition, the influence of which on component aging is so far largely unknown. In parallel to component development, suitable accelerated testing (AST) protocols need to be developed and implemented. This requires an in-depth understanding of pertinent aging phenomena, such that degradation mechanisms can be triggered separately with adequate in situ or ex situ tests. Ideally, such tests should be harmonized within the community to allow results to be compared between different laboratories.
Aside from the work on the electrolyzer stack itself, the balance of plant components need to be developed in parallel, for instance ion-exchange resins with higher thermal stability, compressors with improved efficiency and reduced maintenance requirements, cheaper and more efficient power electronics, etc.
The development needs discussed thus far represent materials and cell engineering approaches, yet future work ought to focus also on more fundamental topics, such as noble-metal free catalysts and alkaline anion exchange membranes, These have the potential to be "game changers" for the technology in the future in terms of investment cost.
In conclusion, we would like to draw a potential analogy to polymer electrolyte fuel cell (PEFC) technology. 30 years ago, similarly thick membranes (Nafion 115 and 117), Pt-black electrodes with high catalyst loading, and machined thick graphite based bipolar plates were used in stacks. Today, fuel cell cars are on the market, and current state-of-the-art are thin (10–15 μm), mechanically reinforced and chemically stabilized membranes,123 electrodes with noble metal alloy catalysts and low loading (0.25 mg/cm2),124 and coated metal bipolar plates manufactured using high-volume processes.125 Although much more development is necessary in automotive fuel cell systems for the technology to be mass manufacturable and economically viable, it can show that a similar trajectory of development may be possible and anticipated for membrane water electrolyzers, which has already started and greatly benefitted from the mentioned progress in PEFC technology.
Acknowledgment
Funding by the Swiss Federal Office of Energy (SFOE), Belenos Clean Power Holding Ltd. and the Energy System Integration (ESI) platform at PSI, technical support by Martin Ammann and Thomas Gloor, as well as scanning electrode microscopy work by Albert Albert (all PSI) are gratefully acknowledged. TJS thanks the Commission for Technology and Innovation Switzerland and the Swiss Competence Center for Energy Research Heat & Electricity Storage.
Footnotes
- c
In the following, the term PEWE refers to the PEM based electrolyzer.
- d
An electrolyzer operating at the thermoneutral cell potential based on the HHV (1.48 V) needs 39 kWh to produce 1 kg of H2 (or 11 Nm3 at atmospheric pressure and 0°C).