
Abstract
The ion implantation of H+ and D+ into Ga2O3 produces several O–H and O–D centers that have been investigated by vibrational spectroscopy. These defects include the dominant VGa(1)-2H and VGa(1)-2D centers studied previously along with additional defects that can be converted into this structure by thermal annealing. The polarization dependence of the spectra has also been analyzed to determine the directions of the transition moments of the defects and to provide information about defect structure. Our experimental results show that the implantation of H+ (or D+) into Ga2O3 produces two classes of defects with different polarization properties. Theory finds that these O–H (or O–D) centers are based on two shifted configurations of a Ga(1) vacancy that trap H (or D) atom(s). The interaction of VGa(1)-nD centers with other defects in the implanted samples has also been investigated to help explain the number of O–D lines seen and their reactions upon annealing. Hydrogenated divacancy VGa(1)-VO centers have been considered as an example.
Export citation and abstract BibTeX RIS
β-Ga2O3 is a promising ultrawide bandgap semiconductor with a bandgap energy of near 4.9 eV. 1–6 Ga2O3 is being widely investigated for use in high-power devices, solar-blind detectors, sensors, and extreme environments.
The role played by defects in Ga2O3 is being investigated widely. 7 Similar to other transparent conducting oxides, 8–11 the hydrogen impurity in Ga2O3 has a strong effect on electrical properties and has been studied by both theory and experiment. Interstitial H (Hi) and H at an oxygen vacancy (HO) have been predicted to be shallow donors. 12 The gallium vacancy (VGa) and its complexes with H have been predicted to be deep acceptors. 13 Muon spin resonance (μSR) finds that implanted muons form shallow donors in Ga2O3, and hydrogen is expected to behave similarly. 14,15 A variety of O–H centers have been discovered by infrared spectroscopy in Ga2O3 samples annealed in an H2 ambient, and the dominant O–H center has been assigned to a VGa(1)-2H complex. 16,17 While the structures of defects with hydrogen trapped at a VGa(1) have been controversial, 18,19 the combination of vibrational spectroscopy and theory 20 make a compelling case for defects based on shifted configurations 13,21 of VGa(1). Hydrogen also passivates deep acceptor impurities in Ga2O3. 22
Native defects whose dangling bonds are decorated by H have been produced in a variety of semiconductors by the implantation of protons. 23–25 In Ga2O3, the interaction of implanted H with the lattice damage it created was found to affect the diffusion of H. 26 The defects created by the implantation of protons are also of interest for applications of Ga2O3 in radiation environments 27,28 Recent deep-level transient spectroscopy experiments reveal a variety of deep levels in Ga2O3 that are produced by the implantation of protons and theory has suggested candidates for these defects. 29,30
In the present paper, we report the results of an investigation by vibrational spectroscopy 31,32 of the H– (or D–) centers that are produced by the implantation of protons (or deuterons) into Ga2O3. We find additional O–H centers that were not seen previously in samples annealed in an H2 ambient, 17 determine their polarization properties, and investigate their reactions upon annealing. Structural models for these defects are suggested by theory.
Experimental Methods
Samples for our experiments were Ga2O3 wafers with thickness 0.7 mm purchased from the Tamura Corporation. Undoped samples with (−201) faces and Fe-doped samples with (010) faces were implanted at room temperature with protons or deuterons with multiple energies (between 30 and 180 keV) and multiple doses (total dose 7 × 1015 cm−2). Transport of ions in condensed matter (TRIM) simulations predicted implanted layers of thickness ∼1200 nm and H or D concentrations of 1020 cm−3.
IR absorption spectra were measured with a Bomem DA.3 Fourier transform infrared spectrometer equipped with a KBr beamsplitter and an InSb detector. The probing light was incident normal to the face of the sample and the polarization was analysed with a wire grid polarizer that was placed after the sample. Samples were cooled to 77 K for our measurements with a Helitran continuous-flow cryostat.
Annealing treatments to probe the thermal stabilities and reactions of defects were performed in a tube furnace with a flowing Ar ambient.
Experimental Results
IR spectroscopy of O–H and O–D centers
Absorbance spectra (77 K, 1 cm−1 resolution) are shown in Fig. 1 for Ga2O3 samples implanted with D+ ions. Samples implanted with H+ show the corresponding O–H modes. The frequencies of the various lines are listed in Table I along with the ratios of the frequencies of the corresponding O–H and O–D modes,  The ratios for all the observed lines are close to r = 1.35, consistent with H and D bonded to an oxygen atom with its light mass. (Only the O–D line at 2542 cm−1 did not have a resolved O–H partner seen for a proton implanted sample.) We focus on the O–D spectra throughout this paper because they could be observed with substantially higher signal-to-noise ratio.
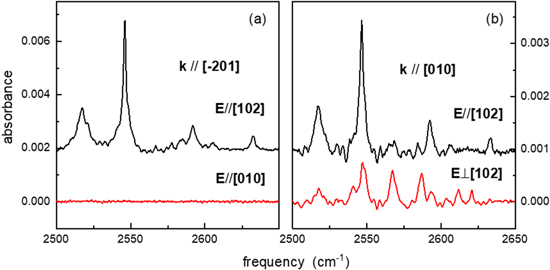
Figure 1. Polarized IR absorption spectra (77 K, resolution 1 cm−1) for Ga2O3 samples implanted with D+ at room temperature. Spectra in (a) were measured for a sample with a (−201) face and spectra in (b) with a (010) face. Polarization directions of the transmitted light are indicated.
Download figure:
Standard image High-resolution imageTable I. Frequencies (77 K) of corresponding O–H and O–D stretching lines produced by the implantation of protons and deuterons into Ga2O3. The ratios of the frequencies of corresponding O–H and O–D lines, r =  are shown. The angle (
 ) of the transition moment for each O–D center with respect to the X dielectric axis is also shown. An O–H line corresponding to the 2542 cm−1 O–D line was not resolved by our measurements.

| 3393 | — | 3437 | 3466 | 3492 | 3504 | 3520 | 3528 | 3546 | 3568 |

| 2517 | 2542 | 2547 | 2567 | 2586 | 2593 | 2603 | 2611 | 2620 | 2633 |
| r | 1.348 | — | 1.349 | 1.348 | 1.350 | 1.351 | 1.352 | 1.351 | 1.353 | 1.355 |
| polarization | // |

| // |

|

| // |

|

|

| // |

|

| — |

|

|

|

| — |

|

|

|
The strongest 2547 cm−1 line with polarization predominantly E//[102] is the dominant O–D line seen in Ga2O3 that contains D and was assigned to the VGa(1)-2D complex.
16
The three additional lines seen predominantly for this polarization (2517, 2593, and 2633 cm−1) were reported previously for implanted samples.
16
Several additional lines are seen predominantly for the polarization E
 [102] for the Ga2O3 sample with a (010) face. There are no lines detected for the polarization E//[010].
Many of the lines listed in Table I have frequencies within a few cm−1 of those reported previously for Ga2O3 annealed in H2 or D2 gas ambients. 17 (It is not unusual for random strains present in implanted samples to shift lines by a cm−1 or two.) However, there are three O–D lines observed here at 2517, 2542, and 2567 cm−1 that have been produced only in samples deuterated by D+ implantation and similarly for their O–H partners. Furthermore, a puzzling discrepancy between the results in Table I for implanted samples and those from previous experiments 17 for samples annealed in D2 is that the polarization dependences of the O–D lines at 2586 and 2593 cm−1 are inconsistent between the data sets. The corresponding O–H lines at 3492 and 3504 cm−1 show the same inconsistency. This anomalous result will be investigated in future experiments.
A Ga2O3 sample with a (−201) face was also sequentially implanted with overlapping profiles of H+ and D+. No lines due to defects that contained mixtures of H and D were observed, not even for the 2547 cm−1 center that is known to contain two D atoms. 16 Our previous results for the 2547 cm−1 center suggest that the observation of any new lines arising from defects that contain both H and D would require the resolution of line shifts of ∼1 cm−1. The lines we have observed in our implanted samples have widths >2 cm−1 explaining why centers that might contain both H and D could not be observed in our experiments. Therefore, our results are not conclusive about the number of D atoms contained by any of the defects produced by implantation in our experiments.
Polarization Dependence of O–D Lines and Transition-Moment Directions
β-Ga2O3 has a monoclinic structure, 33,34 and the polarized absorption of O–H and O–D centers is strongly anisotropic. A previous study of the polarization dependence of the dominant O–D line at 2547 cm−1 due to the VGa(1)-2D complex revealed the orientations of the dielectric axes of Ga2O3 in the infrared and the direction of the transition moment of the defect. 35 (This strategy based on polarized absorption spectroscopy is discussed in a monograph by Turrell. 36 ) In these experiments, the polarization dependence of the absorbance of an IR line is measured as a function of angle with respect to the crystal axes. The angular dependence of the polarized absorbance yields the orientations of the dielectric axes with respect to the crystal axes. The dichroic ratio is the ratio of the absorbances measured with the transmission axis of the analyzing polarizer along the two perpendicular dielectric axes, X and Z, and yields the direction of the transition moment of a defect with respect to the dielectric axes. 35
The lines listed in Table I have been labeled as // or  to [102] but, in fact, most lines appear in both polarizations to some degree. We strengthen the analysis of the polarization dependences of the O–D lines shown in Fig. 1 to obtain further information about the transition-moment directions for the various O–D centers. The absorbances for the different O–D lines were measured vs the angle (
 ) of the analyzing polarizer, with respect to the crystal [102] axis. A selection of these spectra are shown in Fig. 2. The absorbances for the O–D lines in these spectra were fit with Gaussian lineshapes to yield their dependences on the analyzing polarizer angle. A few representative cases are shown in Fig. 3.

Figure 2. A selection of polarized IR absorption spectra (77 K, resolution 1 cm−1) measured as a function of the angle of the analyzing polarizer for a (010) Ga2O3 sample implanted with D+. The angle of the transmission axis of the polarizer with respect to the [102] direction is indicated. Lines seen predominantly for the polarization parallel to [102] are labeled with solid blue vertical lines. Lines seen predominantly for the polarization perpendicular to [102] are labeled with dashed red vertical lines.
Download figure:
Standard image High-resolution image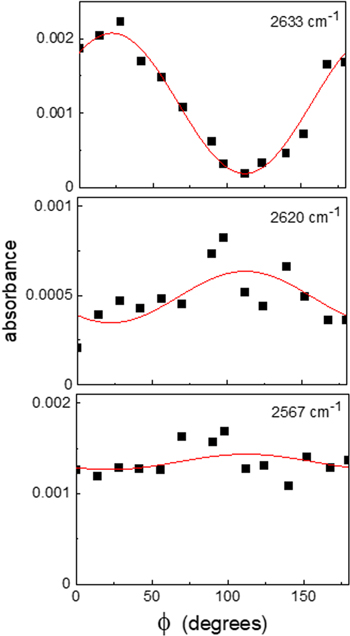
Figure 3. Peak absorbance for three representative O–D centers as a function of the transmission axis of the analyzing polarizer. Data are fit with Eq. 2.
Download figure:
Standard image High-resolution imageThe angular dependence of the absorbance for the monoclinic Ga2O3 structure is given by, 35,36

Here,  is the absorbance, θ is the angle between the transmission axis E of the analyzing polarizer and the X dielectric axis, and l is the thickness of the sample. (The various axes and angles discussed here are shown in Fig. 4.) The absorbing defects have absorption coefficients
  and
and  for the X and Z principal axes given by,
35,36
for the X and Z principal axes given by,
35,36

Here,  and
and  are the refractive indices along the X and Z directions. [For Ga2O3 at 2547 cm−1, using Eq. 2 of Ref. 37 yields
  = 1.892/1.865.]

Figure 4. Definition of angles for our polarized optical absorption measurements of β-Ga2O3 with light incident along the [010] direction. Analysis of the data involves three unique angles, all of which are referenced to the dielectric axis, X: the first is  the orientation of the transition-dipole moment M of the defect; the angle
  gives the orientation of the [102] crystal axis; and
  is the angle for the transmission axis E of the polarization analyzer. The angle between E and the [102] axis that is varied experimentally is
Download figure:
Standard image High-resolution imageThe extreme values of the absorbance given by Eq. 2 occur when the electric vector E is parallel to the X or Z principal dielectric axes, i.e., when θ is 0° or 90°. Our previous study determined that the angle of the X dielectric axis with respect to the [102] axis is  = 22° ± 3° in the spectral range near 2500 cm−1.
35
Equation 2 shows that the angle of the transition moment
= 22° ± 3° in the spectral range near 2500 cm−1.
35
Equation 2 shows that the angle of the transition moment  for an O–D center with respect to the X dielectric axis can be determined from the dichroic ratio,
36
for an O–D center with respect to the X dielectric axis can be determined from the dichroic ratio,
36

Our polarization dependent data were fit with Eq. 1, using the value for the angle  = 22° determined previously,
35
to determine the dichroic ratios and transition-moment directions for the defects listed in Table I. The transition moment directions for the different defects, so determined, are also given in Table I.
= 22° determined previously,
35
to determine the dichroic ratios and transition-moment directions for the defects listed in Table I. The transition moment directions for the different defects, so determined, are also given in Table I.
The value of  = ±20° for the primary O–D line at 2547 cm−1 shown in Table I is in agreement, within error, with our previous results.
35
The results for the other O–D lines fall roughly into three groups. (i) A few additional defects have transition moments oriented with
= ±20° for the primary O–D line at 2547 cm−1 shown in Table I is in agreement, within error, with our previous results.
35
The results for the other O–D lines fall roughly into three groups. (i) A few additional defects have transition moments oriented with  in the range ±15° to ±30°. The O–D line at 2633 cm−1 (Fig. 3) is such a case as are the lines at 2517 and 2593 cm−1. If
  is taken to be negative, these defects have transition moments near the [102] direction. (ii) Two other defects have transition moments with
  > ±
> ± The 2633 cm−1 line (Fig. 3) is such a case as is the line at 2611 cm−1. The transition moment direction
  = +53° for the 2633 cm−1 center, where we have assumed the positive value of this angle, is shown in Fig. 4 as an example. (iii) Finally, there are two lines that show only a weak dependence on the analyzing polarizer angle and have transition moment directions near ±
 The line at 2567 cm−1 (Fig. 3) is such a case as is the line at 2586 cm−1.
The IR lines for the defects produced by deuterium implantation are weak, so the errors in the transition-moment directions were typically as large as 5 to 15 degrees. Nonetheless, the grouping of the lines according to their transition-moment directions is clear and provides valuable clues to their assignments. (The two lines listed for the perpendicular polarization at 2542 and 2603 cm−1 were sufficiently weak to make more detailed analysis of their transition moment directions impractical. Transition moment directions for these lines are not given in Table I).
Annealing Stability of O–D Centers
H+ and D+ implanted samples with both (–201) and (010) faces were subjected to a series of sequential anneals in a flowing Ar ambient. A selection of IR spectra for a D+-implanted Ga2O3:Fe sample with an (010) face are shown in Figs. 5 and 6. The intensities of the O–D lines vs the annealing temperature are plotted in Fig. 7. [Annealing results for implanted samples with (−201) faces were found to be similar for lines with E//[102]. No lines were seen for E//[010]].

Figure 5. Polarized IR absorption spectra (77 K, resolution 1 cm−1) for a (010) Ga2O3 sample implanted with D+ at room temperature. The sample was sequentially annealed at the temperatures shown (°C) in a flowing Ar ambient.
Download figure:
Standard image High-resolution image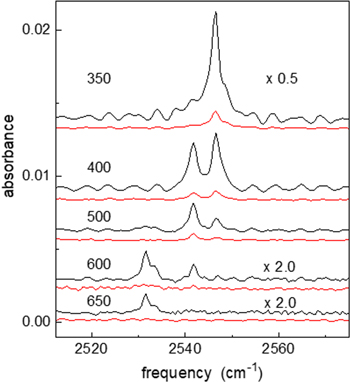
Figure 6. Polarized IR absorption spectra (77 K, resolution 1 cm−1) for a (010) Ga2O3 sample implanted with D+ at room temperature that focus on the annealing behaviors of the 2547 cm−1 line and the defects it anneals into. The annealing temperature (°C) in a flowing Ar ambient is shown.
Download figure:
Standard image High-resolution image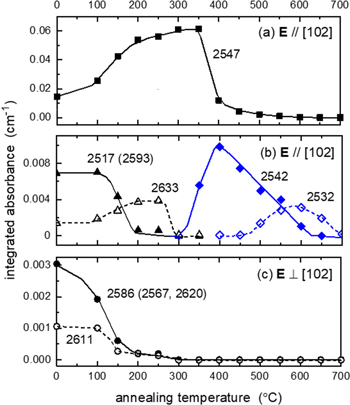
Figure 7. Panels (a)–(c) show the integrated absorbances for the IR lines with the given frequencies vs annealing temperature. (The frequency and corresponding data for a representative defect are shown along with the frequencies, in parentheses, for lines that show similar annealing behaviors.) Anneals (30 min) were performed in a flowing Ar ambient. Lines are drawn to guide the eye.
Download figure:
Standard image High-resolution imageAll of the lines seen for the polarization with E
 [102] are annealed away in the temperature range 150 °C to 200 °C. Some of the lines seen for the polarization with E//[102] are also annealed away in this temperature range. One line (2633 cm−1) becomes stronger upon annealing at 150 °C before it is annealed away at 300 °C. As these O–D lines are annealed away, the primary line at 2547 cm−1 increases in strength. The 2547 cm−1 line assigned to the VGa(1)-2D complex appears to be the dominant trap for D. The coalescence of D into the VGa(1)-2D complex is similar to what was observed previously for Ga2O3 samples treated in D2 gas where the 2547 cm−1 line became the dominant trap for D as other centers were annealed away at temperatures near 400 °C.
17
[102] are annealed away in the temperature range 150 °C to 200 °C. Some of the lines seen for the polarization with E//[102] are also annealed away in this temperature range. One line (2633 cm−1) becomes stronger upon annealing at 150 °C before it is annealed away at 300 °C. As these O–D lines are annealed away, the primary line at 2547 cm−1 increases in strength. The 2547 cm−1 line assigned to the VGa(1)-2D complex appears to be the dominant trap for D. The coalescence of D into the VGa(1)-2D complex is similar to what was observed previously for Ga2O3 samples treated in D2 gas where the 2547 cm−1 line became the dominant trap for D as other centers were annealed away at temperatures near 400 °C.
17
Figures 6 and 7 show that the 2547 cm−1 line assigned to the VGa(1)-2D center is annealed away at 400 °C for samples prepared by implantation. In the same temperature range, the O–D line at 2542 cm−1 appears followed by lines at 2536 and 2532 cm−1 at somewhat higher temperature (Table II). These three lines that have been produced by annealing have polarization dependencies very similar to the 2547 cm−1 line, and similarly for their O–H partners.
Table II. Frequencies for corresponding O–H and O–D defects that are produced by annealing above 350 °C (Fig. 6) are shown along with their frequency ratio, r = 

| 3430 | 3420 | 3415 |

| 2542 | 2536 | 2532 |
| r | 1.349 | 1.349 | 1.349 |
We have considered whether the lines at 2532 and 2536 cm−1 arise from a single defect whose O–D line has been split by a symmetry-lowering perturbation or from two distinct defects. Other spectra, not shown here, reveal that these near-lying lines sometimes appear separately in annealed samples. (The line at 2532 cm−1 is slightly more stable thermally than the weak line at 2536 cm−1 shown in Fig. 6. The 2536 cm−1 line was annealed away at 600 °C, whereas the 2532 cm−1 line could be seen in some samples annealed at 700 °C.) Therefore, we conclude that these lines are due to two different defects with similar frequencies and possibly similar structures.
Analysis
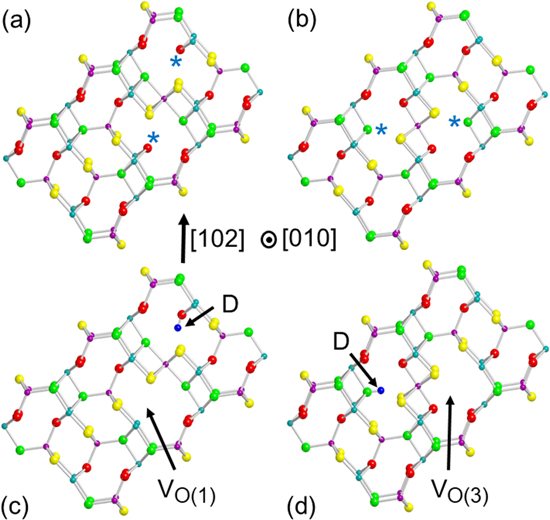
Theory suggests that the defects produced by the implantation of H+ or D+ into Ga2O3 are based on shifted Ga(1) vacancy centers, similar to the case of samples annealed in H2 or D2 ambients. 16,17 While vacancies in most materials involve simply the removal of an atom and local relaxations and possible rebonding about the vacancy site, there is considerable evidence that the Ga(1) vacancy in Ga2O3 behaves in an unusual fashion. 13,20,21,38–40 Rather than its stabilizing through local, symmetric near-neighbor relaxation, instead a near-neighbor Ga(1) displaces to a site halfway to the vacancy site, where the system equilibrates. Furthermore, there are two unique ways that this displacement may occur. This phenomenon with respect to one of these displacements was first predicted by Varley et al., 13 and subsequently Kyrtsos et al. 21 pointed out the existence of the second way. In this paper we call these the "Varley" displacement and the "Kyrtsos" displacement. [In other works these have been referred to as interstitial Ga(1) plus two Ga(1) vacancies. In addition, the Varley type has been called VGa (c) or Ga(1)21, while the Kyrtsos type has been called VGa (b) or Ga(1)23 (Refs. 16, 21 and 29)].
These two configurations are shown in Figs. 8a and 8b. In each case the shifted Ga(1) becomes octahedrally coordinated, leaving two symmetry-equivalent undercoordinated oxygens, denoted by *. These undercoordinated sites can readily trap D, yielding one- or two–D defects.
Figure 8. (a) "Kyrtsos" configuration of the shifted Ga(1) vacancy. (b) "Varley" configuration of the shifted Ga(1) vacancy. (c) Ga(1) vacancy—O(1) divacancy complex based on the "Kyrtsos" configuration. (c) Ga(1) vacancy—O(3) divacancy complex based on the "Varley" configuration. The inequivalent atomic sites are color coded as follows: Ga(1), purple; Ga(2), dark green; O(1), red; O(2), yellow; and O(3), light green. The two Ga(1) atoms involved in the shifting are dark blue. Undercoordinated oxygens are denoted by " ". These figures were constructed using MOLDRAW
41
and POV-Ray.
42
". These figures were constructed using MOLDRAW
41
and POV-Ray.
42
Download figure:
Standard image High-resolution image
A variety of experiments on Ga(1) vacancies, both as formed and after trapping holes or hydrogens, give no evidence of any configurations other than those introduced above. 16,17,38–40,43 The situations that emerge indicate that for the as-formed vacancies the Varley configuration is most stable, while after hole or H trapping, the Kyrtsos configuration becomes more stable. However, after thermal treatments, one or more H trapped in the Varley configuration are also observed. 17
For H or D trapped at VGa(1) in the Kyrtsos configuration, the orientations of the O–H or O–D bonds will give transition moments oriented near the [102] direction and strong absorption for this polarization. For H or D trapped at VGa(1) in the Varley configuration, the orientations of O–H or O–D bonds will give transition moments with a substantial component perpendicular to the [102] direction. The orientations of the O–H or O–D bonds trapped at these two different shifted vacancy configurations provide an explanation for the polarization behaviors for the O–H and O–D lines we have observed in implanted samples.
While more lines are observed in our experiments than may be accounted for by these unperturbed defects, we suggest that additional lines involve versions of these that are perturbed by either neighboring impurities [such as, for example, Si on a Ga(1) site or a metal impurity on a Ga(2) site], or by another product of implantation damage.
Ingebrigtsen et al. have investigated the defects produced in Ga2O3 by the implantation of protons or He ions with a combination of deep level transient spectroscopy (DLTS) and theory. 29 Theory suggests that Ga(1)—O divacancies may be responsible for the prominant E2* DLTS peak found in these studies. Subsequent work also suggests that the E2* center can be passivated by hydrogen. 30
We have considered the VGa-VO center as an example of a trap for D that could be responsible for some of the O–D centers seen in our IR absorption experiments. Possible structures of Ga(1)—O divacancies have been investigated using the hybrid DFT CRYSTAL06 code 44 with the same framework as detailed in Ref. 16. After exploring a number of possibilities, we find indeed that the two most stable configurations are identical to those suggested by Ingebrigtsen et al. 29 —one of Varley type and one of Kyrtsos type, each having lost one of its undercoordinated oxygens. And as they suggested, the Kyrtsos configuration is more stable—we find by 0.2 eV. This difference is small enough that it is not inconceivable that both configurations could be found to exist.
Figures 8c and 8d show these two configurations after trapping a D atom. Here we find the Kyrtsos configuration to be considerably more stable, by 0.7 eV. This, however, does not necessarily preclude the existence of the Varley configuration; if D is trapped by a divacancy already in the Varley configuration, the process of switching to D trapped at the more stable Kyrtsos configuration will require, in addition to the local motions of two Ga(1)'s and one O, a non-local motion of the D. An alternative switch, not shown, would involve a local motion of the D and a non-local motion of the O vacancy. Either of these alternatives would require bond-breaking and distant motion, which would be costly in energy.
We have calculated the anharmonic stretching vibrational frequencies for D trapped at these two configurations and compare these with those calculated for the case of a single D trapped at both Ga(1) vacancy orientations (absent the O vacancy). For the Kyrtsos configuration we find the frequency for D at the divacancy to lie 10 cm−1 higher than that for a single D trapped at the unperturbed Kyrtsos configuration. For the Varley configuration the corresponding frequency shift is calculated to be 25 cm−1. In each case the change in frequency associated with introduction of the O vacancy is small. These results are consistent with the frequencies of the additional lines that appear in the immediate vicinity of the dominant 2547 cm−1 line in our experiments. This is not surprising since the structural change to form the O vacancy involves the removal of an O that is distant from the O–D location.
Conclusions
We have found that the implantation of H+ or D+ into Ga2O3 produces two classes of O–H and O–D centers that give rise to vibrational absorption lines with distinctive polarization properties. Our experiments have focused primarily on the D centers. Upon annealing, the O–D centers were converted to a dominant VGa(1)-2D center with its O–D line at 2547 cm−1.
Theory suggests candidates for the O–D centers we have discovered. O–D centers that show strong absorption polarized parallel to the [102] direction are assigned to VGa(1) centers in the Kyrtsos configuration 21 with one or two D. O–D centers that show stronger absorption for light polarized perpendicular to the [102] direction are assigned to VGa(1) centers in the Varley configuration 13 with one or two D.
Interaction of these defects with other impurities or implant damage provide additional candidates for the various lines that are seen. H or D trapped at VGa(1)-O divacancies, that have been proposed recently by others 29 as an assignment for the E2* DLTS peak found in implanted Ga2O3, have been considered as an example.
The disappearance upon annealing at 400 °C of the primary O–D line at 2547 cm−1, with the concomitant appearance of new lines at 2542, 2536, and 2532 cm−1 with similar polarization properties, suggests the interaction of the dominant VGa(1)-2D complex with other defects created by the implantation of D+. One possibility is that the 2542 cm−1 line, for example, is due to a VGa(1)-nD complex perturbed by another defect that is in its vicinity following the annealing treatment. Similarly, the 2532 and 2536 cm−1 lines may be due to more strongly perturbed VGa(1)-nD centers.
While several issues remain to be investigated, our complementary experimental and theoretical results provide a consistent overall framework for understanding the vibrational properties of O–H and O–D centers produced in Ga2O3 by the implantation of protons and deuterons.
Acknowledgments
We are grateful to P. Weiser and L. Vines for making us aware of their results on proton implanted Ga2O3 prior to publication. The work at Lehigh University was supported by NSF grant No. DMR 1901563 (James Edgar). The work at UF was sponsored by Department of the Defense, Defense Threat Reduction Agency, HDTRA1-17-1-011, monitored by J. Calkins, DTRA Interaction of Ionizing Radiation with Matter University Research Alliance, HDTRA1-19-S-0004 (Jacob Calkins) and also by NSF DMR 1856662 (James Edgar). The data that support the findings of this study are available from the corresponding author upon reasonable request.