
Abstract
The Cr3+-activated phosphor properties are discussed in detail from an aspect of spectroscopic point of view. The host materials considered here are a various kind of oxide compounds. The photoluminescence (PL) and PL excitation spectra of the Cr3+-activated oxide phosphors are analyzed based on Franck−Condon analysis within the configurational-coordinate model. A new method is proposed for obtaining reliable crystal-field (Dq) and Racah parameters (B and C) based on a general ligand field theory with paying an attention to difficulty in the exact estimation of such important ligand field parameters. The intra-d-shell Cr3+ states, such as 2Eg (2G), 4T2g (4F), and 4T1g (4F), in various oxide hosts are determined and plotted against Dq in the Tanabe−Sugano energy-level diagram. The results obtained are summarized in graphical and tabular forms. A comparative discussion of Cr3+ ion as an efficient activator in oxide and fluoride hosts is also given. The present analysis method can be used to predict an energy of Cr3+ emission and/or to check a validity of the Racah parameter values for a variety of Cr3+-activated phosphors and related optical and optoelectronic device applications.
Export citation and abstract BibTeX RIS

This is an open access article distributed under the terms of the Creative Commons Attribution 4.0 License (CC BY, http://creativecommons.org/licenses/by/4.0/), which permits unrestricted reuse of the work in any medium, provided the original work is properly cited.
A variety of rare-earth-free phosphors emitting in the red spectral region have drawn much interest for realizing warm white-LED (w-LED) devices with high color rendering index and high luminous efficacy. 1–3 From this point of view, the most important non rare-earth ions with currently receiving great attention are Mn4+ and Cr3+ ions. Note that Cr3+ ion has the same electronic configuration, 3d3, as Mn4+ and V2+. The most common oxidation state of Cr used in phosphor applications is +3, though oxidation states from +2 to 6 + have been observed. The intra-d-shell electrons in Cr3+ ion can be well characterized by the standard crystal-field theory. 4,5
Near-IR radiation is known to have good penetration for organic matter and, therefore, it has drawn attention for application in monitoring foods and medicines, bioimaging, and night vision (see Refs. 6 and 7, and therein). Doping of Cr3+ ions into various hosts enables to emit light in the near-IR to red spectral region. Therefore, some Cr3+-activated phosphors that emit in the near-IR spectral region are not suitable for use in warm w-LED applications. However, their efficient emission/excitation properties can be successfully explained by the same electronic configuration, 3d3, as Mn4+ ion. As a result, near-IR LEDs inherit the traits of w-LEDs using Mn4+-doped phosphors, such as environmental friendliness, compactness, and high energy efficiency. 6,7 Therefore, the development of InGaN-chip excitable phosphors not only for w-LED but also for near-IR-emitting LED devices is of great importance.
Like Mn4+ ion, a sequence of its energy states can be described by the symmetry of ion site, by the crystal-field parameter Dq, and by interelectronic interaction strength determined by the Racah parameters B and C. Although the luminescence behaviors of the 3d3-configuration Mn4+ ions doped into various oxide hosts have been clarified in detail, 1–3 similar studies on Cr3+ ions introduced into oxide hosts have not been performed until now.
Here, we discuss the photoluminescence (PL) and PL excitation (PLE) properties of Cr3+-activated phosphors of oxide hosts, including borates, phosphates, silicates molybdates, tungstates, and similar. The zero-phonon line (ZPL) emission and excitation energies of the Cr3+ ions are determined from PL and PLE spectra by performing the Franck−Condon analysis within the configurational-coordinate (CC) model. Such ZPL emission and excitation energies are used to calculate the crystal-field and Racah parameters of Cr3+ in the various oxide hosts. A method for obtaining reliable crystal-field and Racah parameters of the Cr3+ ions doped into the oxide hosts is proposed for more deep understanding of such very important but, at present, largely scattered parameter values.
Tanabe−Sugano Energy-Level Diagram
The most of the fundamental optical properties of various 3dn transition-metal ions doped into crystalline hosts can be interpreted in terms of the crystal-field model. Figures 1a and 2a show the effects of Dq/B, the crystal-field strength (Dq) divided by the Racah parameter (B), on the electronic energy levels of the 3dn (n = 3) electron system based on the Tanabe−Sugano energy-level diagram scheme. 4,5 The optical properties of such transition-metal ions with the 3d3 configuration (Cr3+, Mn4+, V2+, etc) can be successfully interpreted by this energy-level diagram scheme.
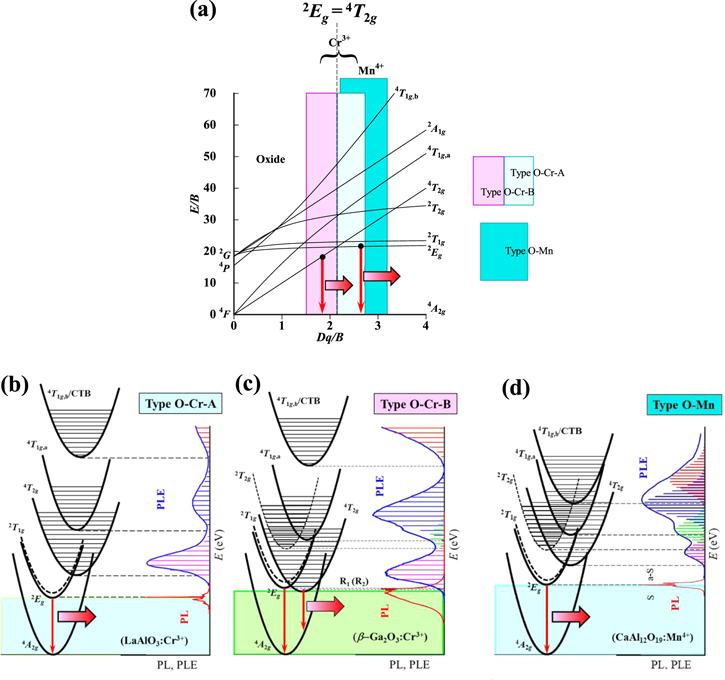
Figure 1. (a) Tanabe–Sugano energy-level diagram for a 3d3 ion in octahedral symmetry of an oxide host crystal. The highlighted regions in the diagram correspond to those for phosphors of types O–Cr–A, O–Cr–B, and O–Mn (see text). Here, 4 F, 4 P, and 2 G on the vertical axis represent the free-ion ground (4 F) and excited states (4 P and 2 G). The CC model analyses for phosphors of types O–Cr–A (LaAlO3:Cr3+), O–Cr–B (β-Ga2O3:Cr3+), and O–Mn (CaAl12O19:Mn4+) are shown in (b)–(d), respectively. The horizontal bars in each PLE spectrum of (b)−(d) represent the theoretical fits using Eq. 9. S = Stokes; a-S = anti-Stokes; CTB = charge transfer band.
Download figure:
Standard image High-resolution image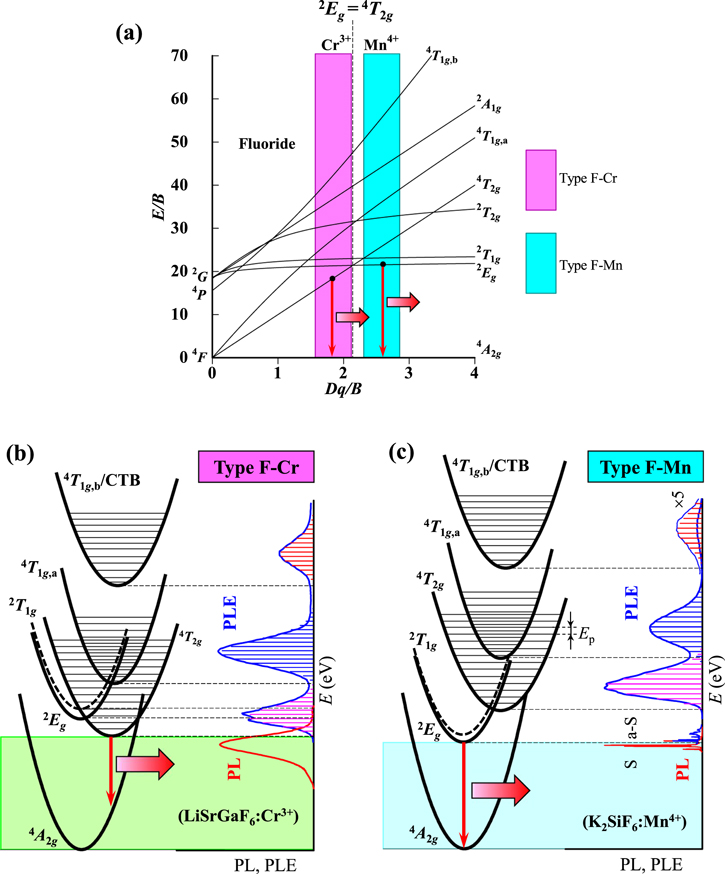
Figure 2. (a) Tanabe–Sugano energy-level diagram for a 3d3 ion in octahedral symmetry of a fluoride host crystal. The highlighted regions in the diagram correspond to those for phosphors of types F–Cr and F–Mn (see text). Here, 4 F, 4 P, and 2 G on the vertical axis represent the free-ion ground (4 F) and excited states (4 P and 2 G). The CC model analyses for phosphors of types F–Cr (LiSrGaF6:Cr3+) and F–Mn (K2SiF6:Mn4+) are shown in (b) and (c), respectively. The horizontal bars in each PLE spectrum of (b) and (c) represent the theoretical fits using Eq. 9. S = Stokes; a-S = anti-Stokes; CTB = charge transfer band.
Download figure:
Standard image High-resolution imageIn Figs. 1a and 2a, 4 A2g represents the ground state of the 3d3 electron, which is a component of the free-ion ground state 4 F. Note that the crystal-field strength Dq is dependent on the distance R between the ion and ligands. The electronic energies of the higher-lying states like 4 T2g , 4 T1g , and 2 A1g are, therefore, strongly dependent on the type of lattice and ligands through R.
In the very small crystal-field region of Dq/B < 0.4, the first and second excited states are 4 T2g and 4 T1g,a, respectively, which are components of the free-ion ground state 4 F. In the small crystal-field region of 0.4 < Dq/B < 1.4, the first and second excited states are the same as those for Dq/B < 0.4, but the third excited state changes from 4 T1g,b (4 P) to 2 Eg (2 G). In the region of 1.4 < Dq/B < 2.1, the second excited state exchanges from 4 T1g,a to 2 Eg with keeping the first excited state to be 4 T2g .
Note that the optical transitions of 4 A2g ↔ 2 Eg , 2 T1g , and 2 T2g are both parity and spin forbidden and, therefore, any 2 Eg , 2 T1g , and 2 T2g -related optical transitions cannot be clearly observed in principle. However, the 2 Eg -related optical transitions are gained by the activation of local vibrations and become observable. 8 Consequently, the 2 Eg -related optical transitions are clearly observed in the crystal-field region of Dq/B > 2.1. The optical transitions of 4 A2g ↔ 4 T2g are spin allowed but parity forbidden. The 4 T2g -related optical absorption and emission transitions can then be observed as a broad and strong band caused by an interaction with the specific lattice vibration mode. 1–3
Crystal-Field and Racah Parameters
The Tanabe−Sugano energy-level diagrams in Figs. 1a and 2a suggest that a curve of E(2 Eg )ZPL/B exhibits no strong dependence on Dq/B, where E(2 Eg )ZPL represents the ZPL energy of the 2 Eg state. However, the E(2 Eg )ZPL/B plots determined from the generally used calculation model usually show an almost linear increase with increasing Dq/B, in clear disagreement with the Tanabe−Sugano diagram. As we will see latter, such an obvious disagreement comes from a large error in the determination of the ZPL energies required as input parameters in the general calculation model. 9–13 It should be noted that the E(2 Eg )ZPL and E(4 T2g )ZPL energies can be accurately determined from analyzing experimental PL and PLE spectra; however, accurate or reliable values of the higher-lying excited-state ZPL energies, such as E(4 T1g,a)ZPL, E(2 A1g )ZPL (4 A2g → 2 A1g ), and E(4 T1g,b)ZPL (4 A2g → 4 T1g,b), are very difficult to obtain from any optical spectra. Because of this, an energy at each emission or excitation intensity maximum was previously regarded as its ZPL energy. 12,8 Of course, this assumption is a last resort.
Obtaining the Racah (B and C) and crystal-field parameters (Dq) requires at least three energy values those popularly used were E(2 Eg )ZPL, E(4 T2g )ZPL, and E(4 T1g,a)ZPL. As just mentioned above, it is very difficult and, in many cases, impossible to exactly determine the higher-lying ZPL energy, E(4 T1g,a)ZPL. Considering only exactly determinable E(2 Eg )ZPL and E(4 T2g )ZPL values, therefore. one can obtain expressions for B, C, and E(4 T1g,a)ZPL from the standard crystal-field theory (in cm−1) as Refs. 12, 14

with

An idea of obtaining Eqs. 1–3 is to reduce unknown input energy parameters from three to two [i.e., no need of E(4 T1g,a)ZPL] by assuming C/B ≡ r, where r is an optional constant. An algebra teaches us that determining two unknown variables, in the present study B (C = rB) and Dq, only two known energy parameters, in the present study only E(2 Eg )ZPL and E(4 T2g )ZPL, are required. Note that the Racah parameter ratios C/B for many 3d3-ion-activated oxide and fluoride phosphors are reported to fall in the range of 3 to 6 (Refs. 5 and 15) or can be assumed to be ∼4.7. 16 The higher-lying E(4 T1g,a)ZPL energy can then be calculated by inputting only B and Dq values obtained from Eqs. 1 and 2 into Eq. 3.
Analysis Model for PL and PLE Spectra
Some of the optical spectra have been successfully analyzed by considering an interaction with the lattice vibrations. Let us consider the Franck−Condon analysis with the CC model to explain the peculiar optical absorption spectra in the 3d3 (Cr3+)-ion-activated phosphors. The optical transition energies in the CC model can now be written as Refs. 1–3, 17, 18


where EZPL is the ZPL transition energy, h is the Planck constant, hνp,ex and hνp,em are the lattice vibronic quanta for the excited and ground states, respectively, and k and l are positive integers. The experimental absorption and emission bands are regarded as envelopes of numerous lines; each is due to a transition between one vibration level, k, of the excited electronic state and one vibration level, l, of the ground electronic state.
The optical emission spectrum in the CC model can be written as Refs. 1–3
with

Here, σem is the broadening energy of each Gaussian component,  is the ZPL emission intensity, and S is the mean local vibration number (Huang−Rhys factor) defined by the Poisson statistics (Eq. 8). The upper and lower signs in Eq. 7 correspond to the Stokes and anti-Stokes luminescence, respectively.
The spectral distribution of the optical absorption spectrum in the CC model can be written essentially the same form as Eq. 7
with

where σex is the broadening energy of each Gaussian component in the PLE process and  is the ZPL excitation transition intensity.
It should be noted that the higher the lattice temperature, the stronger is the electron–phonon coupling interaction and, as a result, the larger is the broadening parameter of σex (σem). The fit-determined σex values previously reported were in the order of a few tens of millielectron volts at temperatures from cryogenic up to 300 K. 1,2,14 For simplicity, let us assume σem = σex = 0 meV in the present study. Assuming σex → 0 (σem → 0) in Eq. 9 (Eq. 7), an absorption (emission) line-shape of IPLE (IPL) can be simply characterized only by the Poisson distribution function of Eq. 10 (Eq. 8), as depicted by the vertical bars in the PLE spectra of Figs. 1b−1d and 2b−2c.
Let us show in Fig. 3 the PL and PLE spectra for the MgCa2WO6:Cr3+ phosphor observed in the 4 A2g ↔ 4 T2g transition region at 300 K. The experimental data are taken from Xu et al. 19 The vertical bars represent the results calculated using Eqs. 7 and 9. The fit-determined parameters here are: E(4 T2g )ZPL = 1.54 eV, hνp,ex = 60 meV, and S = 2 (Stokes PL); E(4 T2g )ZPL = 1.54 eV, hνp,ex = 60 meV, and S = 1 (ant-Stokes PL); E(4 T2g )ZPL = 1.54 eV, hνp,ex = 60 meV, and S = 4 (PLE).
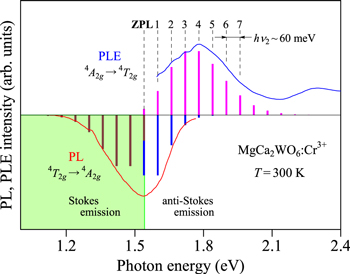
Figure 3. PL and PLE spectra for the MgCa2WO6:Cr3+ phosphor observed in the 4 A2g ↔ 4 T2g transition region at 300 K. 19 The vertical bars represent the results calculated using Eqs. 7 and 9 (see text). The dashed lines also represent an oscillatory structure observed in the PLE spectrum, suggesting an energy interval of hνp,ex ∼ 60 meV.
Download figure:
Standard image High-resolution imageAs we will see more details in the next section, the vibronic quantum energies required in Eqs. 7 and 9 for the Cr3+-activated phosphors are hνp,em = hνp,ex ∼ 60 meV, which are slightly smaller than those for the Mn4+-activated ones (∼65 meV). 1–3 It should be noted that the weak, but clear multiple-peak structure can be found in the PLE spectrum of Fig. 3. An oscillatory energy interval is determined to be hνp,ex ∼ 60 meV. More remarkable multiple-peak structures were observed in Mn4+-activated fluoride phosphors with an oscillatory energy interval of hνp,ex ∼ 65 meV that was especially when PLE spectra were measured at cryogenic temperature. 10,20
Vibration Frequencies of  Octahedron Molecule

Luminescence from Cr3+ and Mn4+ ions can be observed only when such ions are substituted for the octahedral site in the host lattice. Then, the complex peak structure has been observed in many PL and PLE spectra of Cr3+ and Mn4+-activated phosphors. Note that an octahedral molecule like  (CrO6) or
  (MnO6) has 3N − 6 = 15 normal vibration modes (N = 7) with six coordinates required to describe the translational and rotational motions, six independent vibration modes of νi
(i = 1 − 6) needed to represent its crystallographic symmetry properties, and the remining three modes come from the acoustic phonons with one longitudinal and two transverse modes (6 + 6 + 1 + 2 = 15).
21,22
(MnO6) has 3N − 6 = 15 normal vibration modes (N = 7) with six coordinates required to describe the translational and rotational motions, six independent vibration modes of νi
(i = 1 − 6) needed to represent its crystallographic symmetry properties, and the remining three modes come from the acoustic phonons with one longitudinal and two transverse modes (6 + 6 + 1 + 2 = 15).
21,22
We summarize in Table I the local vibration frequencies of νi
(i = 1 − 6) for the Cr3+ and Mn4+ ions in the oxide and fluoride hosts.
23
The IR-active (ν3 and ν4) and silent vibration frequencies (ν6) can in principle be obtained from measuring PL spectra, whereas the Raman-active ν1, ν2, and ν5 frequencies are determined from Raman scattering measurements. Generally speaking, the vibration frequencies of the local  octahedron in the various fluoride hosts are not so largely dependent on a kind of surrounding metal species M (e.g., M = Si, Ge, Sn, Ti, Zr, or Hf in A2MF6 fluoride host).
23
Similarly, those of the
octahedron in the various fluoride hosts are not so largely dependent on a kind of surrounding metal species M (e.g., M = Si, Ge, Sn, Ti, Zr, or Hf in A2MF6 fluoride host).
23
Similarly, those of the  octahedron are not so largely dependent on a kind of oxide host materials. The same situation may hold for the Cr3+ ion in the various fluoride or oxide hosts.
23
octahedron are not so largely dependent on a kind of oxide host materials. The same situation may hold for the Cr3+ ion in the various fluoride or oxide hosts.
23
Table I. Vibronic frequencies, ν1 − ν6, of 

 and
and  molecules in Cr3+ and Mn4+-doped oxide and fluoride crystals at 300 K (in meV).
23
R = Raman active; IR = IR active.
molecules in Cr3+ and Mn4+-doped oxide and fluoride crystals at 300 K (in meV).
23
R = Raman active; IR = IR active.
| Oxide | Fluoride | |||||
|---|---|---|---|---|---|---|
| Mode | Polarization | Activity | Cr3+ | Mn4+ | Cr3+ | Mn4+ |
| ν1 | a1g | R | ∼74.4 | ∼68.2 | ∼74.4 | |
| ν2 | e1g | R | ∼60.1 | ∼63.2 | ∼55.8 | ∼63.2 |
| ∼65.1 a) | ∼65.1 a) | |||||
| ν3 | t1u | IR | ∼81.2 | ∼71.3 | ∼81.2 | |
| ν4 | t1u | IR | ∼44.0 | ∼39.0 | ∼44.0 | |
| ν5 | t2g | R | ∼37.8 | ∼31.0 | ∼37.8 | |
| ν6 | t2u | Silent | ∼29.7 | ∼26.6 | ∼29.7 | |
a)Ref. 2.
Figure 4 shows the 2 Eg -related PL spectra for some Mn4+-activated fluoride phosphors, together with those for the Cr3+-activated oxide phosphors at 300 K. The experimental data are taken for K2TiF6:Mn4+ and Na2TiF6:Mn4+ from Xu and Adachi, 24 for Ca14Zn6Al10O35:Cr3+ from Sun et al., 25 for LaAlO3:Cr3+ from Zhang et al., 26 for La2ZnTiO6:Cr3+ from Ou et al., 27 for MgAl2O4:Cr3+ from Karthik et al., 28 and for MgSrAl10O17:Cr3+ from Singh et al. 29 The Stokes ν3, ν4, and ν6 vibronic modes and anti-Stokes ν4, and ν6 vibronic modes are marked on the PL spectrum of the K2TiF6:Mn4+ phosphor.
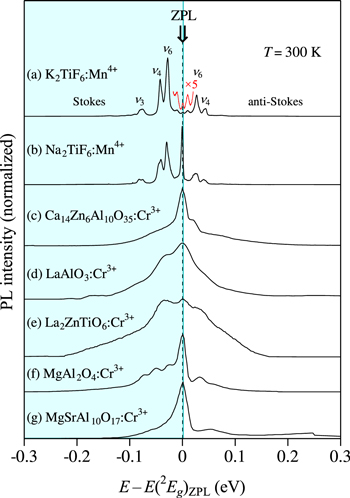
Figure 4. Plots of 2 Eg -related PL spectra for some Mn4+-activated fluoride phosphors, together with those for the Cr3+-activated oxide phosphors at 300 K. The experimental data are taken for (a) K2TiF6:Mn4+ and (b) Na2TiF6:Mn4+ from Xu and Adachi, 24 for (c) Ca14Zn6Al10O35:Cr3+ from Sun et al., 25 for (d) LaAlO3:Cr3+ from Zhang et al., 26 for (e) La2ZnTiO6:Cr3+ from Ou et al., 27 for (f) MgAl2O4:Cr3+ from Karthik et al., 28 and for (g) MgSrAl10O17:Cr3+ from Singh et al. 29 Note that drawing such a diagram of PL spectra facilitates the ZPL energy determination of 2 Eg at E = E(2 Eg )ZPL.
Download figure:
Standard image High-resolution imageIn Ref. 23, each local vibronic frequency of the  octahedron is found to be smaller than that of the
  one. This is not surprising because of the fact that the smaller the mass number of ligand metal ion, the smaller is its local vibronic frequency, i.e., in the present case, the mass number of Cr is smaller than that of Mn.
30
Similarly, each local vibronic frequency of the
one. This is not surprising because of the fact that the smaller the mass number of ligand metal ion, the smaller is its local vibronic frequency, i.e., in the present case, the mass number of Cr is smaller than that of Mn.
30
Similarly, each local vibronic frequency of the  octahedron in Fig. 4 is understood to be slightly smaller than that of the
  one. It should be noted that the Raman-active mode energy of hν2 corresponds to the vibronic energy of hνp,em (hνp,ex) involved in the PL (PLE) process.
1,3
Therefore, we can use a value of hνp,em (hνp,ex) ∼ 60 meV for the
one. It should be noted that the Raman-active mode energy of hν2 corresponds to the vibronic energy of hνp,em (hνp,ex) involved in the PL (PLE) process.
1,3
Therefore, we can use a value of hνp,em (hνp,ex) ∼ 60 meV for the  and
and  octahedra that is slightly smaller than the value of ∼65 meV used for the Mn4+-activated oxide and fluoride phosphors.
1–3
The local vibronic energies of ν2 ∼ 60 meV in K2NaGaF6:Cr3+ have also been determined from luminescence (59.5 meV) and Raman-scattering measurements (59.6 meV).
31
octahedra that is slightly smaller than the value of ∼65 meV used for the Mn4+-activated oxide and fluoride phosphors.
1–3
The local vibronic energies of ν2 ∼ 60 meV in K2NaGaF6:Cr3+ have also been determined from luminescence (59.5 meV) and Raman-scattering measurements (59.6 meV).
31
Classification of Cr3+ and Mn4+-Activated Oxide and Fluoride Phosphors
Oxide phosphors
From a spectroscopic point of view, we classify the "oxide" phosphors doped with Cr3+ and Mn4+ ions into three different groups: (i) type O–Cr–A, (ii) type O–Cr–B, and (iii) type O–Mn (Fig. 1a). The crystal-field strength of type O–Cr–A phosphors certainly falls in the region of Dq/B > 2.1 and, therefore, their luminescence properties can be mainly determined by the 2 Eg-related luminescence transitions [E(2 Eg )ZPL < E(4 T2g )ZPL; see Fig. 1b]. Similarly, the crystal-field strength of type O–Cr–B phosphors falls in the region of Dq/B < 2.1 and, therefore, their luminescence properties can be mainly determined by the 4 T2g-related optical transitions [E(4 T2g )ZPL < E(2 Eg )ZPL; see Fig. 1c].
The luminescence properties of type O–Mn phosphors are essentially the same as those of type O–Cr–A phosphors and, therefore, the dominant luminescence comes from the 2 Eg-related optical transitions [E(2 Eg )ZPL < E(4 T2g )ZPL; see Fig. 1d]. 32 To the best of our knowledge, there has not been reported any oxide phosphor doped with Mn4+ ion and clearly exhibiting the 4 T2g -related luminescence peak or band. Table II summarizes a classification scheme for the Cr3+ and Mn4+-activated oxide and fluoride phosphors.
Table II. Classification scheme of Cr3+ and Mn4+-activated oxide and fluoride phosphors.
| Oxide | Fluoride | |||
|---|---|---|---|---|
| Ion | 2 Eg < 4 T2g | 2 Eg > 4 T2g | 2 Eg < 4 T2g | 2 Eg > 4 T2g |
| Cr3+ | Type O–Cr–A | Type O–Cr–B | — | Type F–Cr |
| Mn4+ | Type O–Mn | — | Type F–Mn | — |
"—" means no any phosphor reported to date.
Fluoride phosphors
From a spectroscopic point of view, we classify the "fluoride" phosphors doped with Cr3+ and Mn4+ ions into two groups: (i) type F–Cr and (ii) type F–Mn (Fig. 2a). The crystal-field strength Dq/B of the Cr3+-doped fluoride phosphors [type F–Cr (Fig. 2b); E(4 T2g )ZPL < E(2 Eg )ZPL] is usually smaller than that of the Mn4+-doped fluoride ones [type F–Mn (Fig. 2c); E(2 Eg )ZPL < E(4 T2g )ZPL]. 14,32 As a result, any Cr3+-activated fluoride phosphor with the crystal-field strength of Dq/B larger than that of a Mn4+-doped fluoride phosphor is nothing and, vice versa, any Mn4+-activated fluoride phosphor with the crystal-field strength of Dq/B smaller than that of a Cr3+-doped fluoride phosphor is nothing. This means that, to the best of our knowledge, almost all the Cr3+-doped (Mn4+-doped) phosphors belong to type F–Cr (type F–Mn), as depicted in Fig. 2a. This fact further promises that the 4 T2g -related (2 Eg -related) luminescence is usually observed in Cr3+-activated (Mn4+-activated) fluoride phosphors. As in type O–Cr–B phosphors, the luminescence spectra of type F–Cr phosphors can therefore be explained by the broad emission band caused by the spin-allowed 4 T2g -related transitions (see Fig. 2b). 14
Cr3+-Activated Oxide Phosphors of Type O–Cr–A: Specific Spectral Analysis
Bi2Al4O9:Cr3+ phosphor
As mentioned previously, the Cr3+-activated "oxide" phosphors can be classified into two groups: types O–Cr–A and O–Cr–B. The luminescence properties of type O–Cr–A phosphors are essentially the same as those of the Mn4+-activated oxide and fluoride phosphors (types O–Mn and F–Mn) 10,32 and, therefore, the dominant luminescence comes from the 2 Eg-related optical transitions [E(2 Eg )ZPL < E(4 T2g )ZPL; Fig. 1b (see also Fig. 1d)].
The Bi2Al4O9:Cr3+ phosphor is of type O–Cr–A. Figure 5a shows the PL and PLE spectra of the Bi2Al4O9:Cr3+ phosphor measured at 300 K. The experimental data are taken from Chen et al.
33
Because of the energy inequality relation of E(2
Eg
)ZPL < E(4
T2g
)ZPL for type O–Cr–A phosphors, this phosphor shows the PL and PLE spectra that are almost the same as those of the Mn4+-activated oxide and fluoride phosphors (i.e., types O–Mn and F–Mn phosphors). Thus, the PL spectrum can be characterized only by the sharp 2
Eg
-related ZPL emission peak and its Stokes and anti-Stokes counterparts. The lattice vibrations made possible a breaking of the parity and spin-forbidden selection rules and, therefore, gaining of the 2
Eg
→ 4
A2g
luminescence intensity. The dominant lattice vibrations here are of the IR-active ν3 and ν4 modes and silent-mode ν6 phonons in the  octahedron complex, but not of the Raman-active ν1, ν2, and ν5 modes (see Table I).
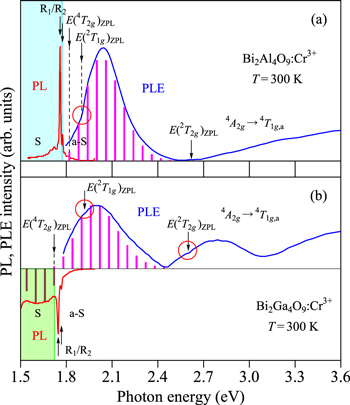
Figure 5. PL and PLE spectra of (a) the Bi2Al4O9:Cr3+ (type O–Cr–A) and (b) Bi2Ga4O9:Cr3+phosphors (type O–Cr–B) measured at 300 K. The experimental data are taken from Chen et al. 33 The vertical bars in the PL and PLE spectra show the results calculated using Eqs. 7 and 9, respectively. The vertical arrows indicate the positions of the various excited-state ZPL energies, E(2 Eg )ZPL (R1/R2), E(4 T2g )ZPL, E(2 T1g )ZPL, and E(2 T2g )ZPL. The open circles in red color also show the regions occurring Fano resonance/antiresonance interaction. S = Stokes; a-S = anti-Stokes.
Download figure:
Standard image High-resolution imageThe strong and sharp PL peaks at ∼1759 and 1.775 eV in Fig. 5a are due to the 2 Eg -relaed ZPL emission peaks (R1 and R2 lines). The vertical bars in the PLE spectrum show the results calculated using Eq. 9. The fit-determined parameters here are: E(4 T2g )ZPL = 1.82 eV, hνp,ex = 60 meV, and S = 4. As has been mentioned before, the ZPL energies of the first [E(2 Eg )ZPL] and second lowest excited states [E(4 T2g )ZPL] can be relatively easily and accurately determined from PL and PLE spectra. The "center of gravity" energy of the spin–orbit split R1 and R2 lines is given by E(2 Eg )ZPL = 1.767 eV. Introducing this value of E(2 Eg )ZPL = 1.767 eV and PLE value of E(4 T2g )ZPL = 1.82 eV into Eqs. 1–3, we obtain the Racah-related parameters of B = 82.5 meV, C = 388 meV, E(4 T1g,a)ZPL = 2.62 eV, and Dq/B = 2.207 (≅2.21). In Table III, we summarize some important excited-state ZPL energies, together with the Racah (B and C) and crystal-field parameters (Dq/B) for the various Cr3+-activated oxide phosphors of type O–Cr–A determined in the present study. 25–29,33–131
Table III. Summary of host materials, ZPL transition energies [E(2 Eg )ZPL, E(4 T2g )ZPL = 10Dq, and E(4 T1g,a)ZPL], and Racah parameters (B and C) for the Cr3+-activated oxide phosphors of type O–Cr–A. Values of E(4 T1g,a)ZPL were calculated from Eq. 3 (C/B = 4.7).
| Host | 2 Eg (R1/R2) (eV) | 4 T2g (eV) | 4 T1g,a (eV) | B (meV) | C (meV) | T (K) | References |
|---|---|---|---|---|---|---|---|
| α-Al2O3 | 1.787/1.791 | 2.07 | 2.90 | 83.1 | 391 | 115 | 34 |
| 1.785/1.788 | 1.94 | 2.76 | 83.2 | 391 | 300 | 34 | |
| Al10Ge2O19 | 1.774 | 2.02 | 2.84 | 82.5 | 388 | 300 | 35 |
| Al5NO6 | 1.789 | 2.02 | 2.85 | 83.2 | 391 | 300 | 36 |
| BaAl2O4 | 1.759/1.773 | 1.92 | 2.73 | 82.3 | 387 | 300 | 37 |
| BaAl12O19 | 1.767 | 2.03 | 2.85 | 82.1 | 386 | 300 | 38 |
| Ba2LaNbO6 | 1.709/1.713 | 10 | 39 | ||||
| BaMgAl10O17 | 1.794 | 1.92 | 2.74 | 83.6 | 393 | 300 | 40 |
| 1.782 | 1.89 | 2.70 | 83.1 | 390 | 300 | 41 | |
| Ba2Mg(BO3)2 | 1.777 | 1.84 | 2.64 | 82.9 | 390 | 77 | 42 |
| BeAl2O4 | 1.826/1.831 a) | 1.93 a) | 2.76 | 85.3 | 401 | 12 | 43 |
| 1.817/1.822 b) | 1.89 b) | 2.71 | 84.9 | 399 | 300 | 44 | |
| Bi2Al4O9 | 1.759/1.775 | 1.82 | 2.62 | 82.5 | 388 | 300 | 33 |
| 1.756 | 1.84 | 2.64 | 81.9 | 385 | 300 | 45 | |
| 1.757/1.773 | 1.84 | 2.64 | 82.3 | 387 | 300 | 46 | |
| CaAl12O19 | 1.811 | 1.93 | 2.75 | 84.4 | 397 | 300 | 47 |
| 1.810 | 1.89 | 2.71 | 84.4 | 397 | 300 | 48 | |
| CaAl6Ga6O19 | 1.789 | 1.89 | 2.70 | 83.4 | 392 | 300 | 49 |
| Ca3Al2Ge2O10 | 1.778 | 1.92 | 2.73 | 82.8 | 389 | 300 | 50 |
| CaGa2O4 | 1.790 | 1.82 | 2.62 | 83.6 | 393 | 300 | 51 |
| CaGdAlO4 | 1.665 | 1.82 | 2.58 | 77.5 | 364 | 300 | 52 |
| Ca2NbAlO6 | 1.663 | 1.74 | 2.49 | 77.6 | 365 | 300 | 53 |
| Ca2NbGaO6 | 1.676 | 1.77 | 2.53 | 78.2 | 367 | 300 | 53 |
| CaTiO3 | 1.619 | 1.81 | 2.56 | 75.3 | 354 | 77 | 54 |
| CaYAlO4 | 1.668 | 1.79 | 2.55 | 77.7 | 365 | 300 | 55 |
| Ca14Zn6Al10O35 | 1.742 | 1.87 | 2.66 | 81.2 | 382 | 300 | 25 |
| CdAl2O4 | 1.794 | 1.90 | 2.72 | 83.6 | 393 | 300 | 56 |
| Cd2Nb2O7 | 1.683 | 57 | |||||
| (CH3)2NH2Al(SO4)2 · 6H2O | 1.761 | 1.80 | 2.59 | 82.2 | 386 | 300 | 58 |
| (CH3)2NH2Ga(SO4)2 · 6H2O | 1.750/1.757 | 1.78 | 2.57 | 81.9 | 385 | 300 | 58 |
| Cr2O3 | 1.704 c) | 1.77 c) | 2.54 | 79.5 | 374 | 77 | 59 |
| 1.707 d) | 1.77 d) | 2.54 | 79.7 | 374 | 77 | 59 | |
| GdAlO3 | 1.705 | 2.03 | 2.83 | 79.2 | 372 | 300 | 60 |
| GdAl3(BO3)4 | 1.808 | 1.82 | 2.63 | 84.5 | 397 | 300 | 61 |
| 1.816 | 1.82 | 2.63 | 84.9 | 399 | 300 | 62 | |
| GdY2Al3Ga2O12 | 1.795 | 1.82 | 2.63 | 83.8 | 394 | 300 | 63 |
| LaAlO3 | 1.688 | 1.96 | 2.74 | 78.4 | 369 | 300 | 26 |
| 1.688 | 1.95 | 2.73 | 78.5 | 369 | 300 | 64 | |
| LaGaO3 | 1.677/1.701 | 1.75 | 2.51 | 78.8 | 370 | 300 | 65 |
| 1.700 | 1.80 | 2.57 | 79.3 | 373 | 300 | 66 | |
| 1.698 | 1.79 | 2.56 | 79.2 | 372 | 300 | 67 | |
| La3GaGe5O16 | 1.769 | 1.77 | 2.56 | 82.7 | 389 | 300 | 68 |
| 1.781 | 1.81 | 2.61 | 83.2 | 391 | 300 | 69 | |
| LaMgAl11O19 | 1.789 | 1.86 | 2.67 | 83.5 | 392 | 300 | 70 |
| LaMgGa11O19 | 1.680 | 1.75 | 2.51 | 78.4 | 368 | 300 | 71 |
| La2MgGeO6 | 1.783 | 1.84 | 2.64 | 83.2 | 391 | 300 | 72 |
| La2ZnTiO6 | 1.672 | 2.28 | 3.08 | 77.3 | 363 | 300 | 27 |
| LiAl5O8 | 1.737/1.771 | 1.95 | 2.76 | 81.6 | 384 | 300 | 73 |
| LiGa5O8 | 1.731/1.766 | 1.85 | 2.64 | 81.6 | 383 | 300 | 74 |
| 1.734/1.768 | 1.80 | 2.59 | 81.7 | 384 | 300 | 75 | |
| 1.727/1.763 | 1.83 | 2.62 | 81.4 | 383 | 300 | 76 | |
| 1.726/1.763 | 1.84 | 2.63 | 81.4 | 382 | 300 | 77 | |
| Li5Zn8Al5Ge9O36 | 1.772 | 1.90 | 2.71 | 82.6 | 388 | 300 | 78 |
| 1.772 | 1.88 | 2.69 | 82.6 | 388 | 300 | 79 | |
| Li5Zn8Ga5Ge9O36 | 1.772 | 1.83 | 2.63 | 82.7 | 389 | 300 | 79 |
| Li2ZnGe3O8 | 1.732 | 1.78 | 2.56 | 80.8 | 380 | 300 | 80 |
| Lu3Al5O12 | 1.796 | 1.98 | 2.80 | 83.6 | 393 | 300 | 81 |
| Lu3Ga5O12 | 1.802 | 1.84 | 2.65 | 84.1 | 395 | 300 | 82 |
| MgO | 1.776 e) | 1.91 e) | 2.72 | 82.8 | 389 | 77 | 83 |
| 1.761 f) | 1.86 f) | 2.66 | 82.1 | 386 | 84 | ||
| MgAl2O4 | 1.801 | 1.88 | 2.70 | 84.0 | 395 | 300 | 28 |
| 1.806 | 1.94 | 2.76 | 84.2 | 396 | 300 | 85 | |
| 1.804 | 1.94 | 2.76 | 84.1 | 395 | 300 | 86 | |
| MgAlGaO4 | 1.754 | 2.05 | 2.87 | 81.5 | 383 | 300 | 87 |
| MgGa2O4 | 1.746 | 1.76 | 2.54 | 81.6 | 383 | 300 | 88 |
| 1.753 | 1.81 | 2.60 | 81.8 | 385 | 300 | 89 | |
| Mg3Ga2GeO8 | 1.663 | 1.72 | 2.47 | 77.6 | 365 | 300 | 90 |
| Mg4Ga4Ge3O16 | 1.791 | 1.86 | 2.67 | 83.6 | 393 | 300 | 91 |
| Mg4Ga8Ge2O20 | 1.790 | 1.87 | 2.68 | 83.5 | 392 | 300 | 92 |
| MgGaInO4 | 1.743 | 1.98 | 2.79 | 81.1 | 381 | 300 | 93 |
| Mg2SiO4 | 1.788/1.813 g) | 1.83 g) | 2.64 | 84.1 | 395 | 10 | 94 |
| 1.725 | 1.78 | 2.56 | 80.5 | 378 | 300 | 95 | |
| MgSrAl10O17 | 1.798 | 1.92 | 2.74 | 83.8 | 394 | 300 | 29 |
| MgSr2Al22O36 | 1.800 | 1.85 | 2.66 | 84.0 | 395 | 300 | 96 |
| MgY2Al4SiO12 | 1.799 | 1.88 | 2.69 | 83.9 | 394 | 300 | 97 |
| NaGdTi2O6 | 1.634 | 1.70 | 2.44 | 76.2 | 358 | 300 | 98 |
| Na2TiGeO5 | 1.613 | 1.80 | 2.54 | 75.1 | 353 | 300 | 99 |
| SrAl2O4 | 1.791 | 1.96 | 2.78 | 83.4 | 392 | 300 | 100 |
| SrAl12O19 | 1.813 | 1.84 | 2.65 | 84.7 | 398 | 300 | 48 |
| 1.804 | 1.84 | 2.65 | 84.2 | 396 | 300 | 100 | |
| Sr4Al14O25 | 1.798 | 2.00 | 2.83 | 83.7 | 393 | 300 | 101 |
| SrGa12O19 | 1.786 | 1.80 | 2.60 | 83.4 | 392 | 300 | 102 |
| SrLaAlO4 | 1.666 | 1.72 | 2.47 | 77.8 | 365 | 300 | 103 |
| Sr2LaGa11O20 | 1.773/1.790 | 1.91 h) | 2.72 | 83.0 | 390 | 300 | 104 |
| YAlO3 | 1.766 | 2.02 | 2.84 | 82.1 | 386 | 300 | 105 |
| Y3Al5O12 | 1.805 | 1.84 | 2.65 | 84.3 | 396 | 300 | 106 |
| 1.800 | 1.81 | 2.62 | 84.1 | 395 | 300 | 107 | |
| 1.753 | 1.80 | 2.59 | 81.8 | 385 | 300 | 108 | |
| YAl3(BO3)4 | 1.808 | 1.82 | 2.63 | 84.5 | 397 | 300 | 61 |
| 1.807 | 1.82 | 2.63 | 84.4 | 397 | 300 | 62 | |
| 1.810 | 1.82 | 2.63 | 84.6 | 397 | 300 | 109 | |
| Y3Al2Ga3O12 | 1.799 | 1.80 | 2.60 | 84.1 | 395 | 300 | 110 |
| ZnAl2O4 | 1.802 | 2.02 | 2.85 | 83.8 | 394 | 300 | 111 |
| 1.802 | 2.01 | 2.84 | 83.9 | 394 | 300 | 112 | |
| 1.805 | 2.01 | 2.84 | 84.0 | 395 | 300 | 113 | |
| 1.809 | 2.00 | 2.83 | 84.2 | 396 | 300 | 114 | |
| ZnAlGaO4 | 1.805 | 2.01 | 2.84 | 84.0 | 395 | 300 | 115 |
| Zn3Al2GeO8 | 1.805 | 1.90 | 2.72 | 84.2 | 396 | 300 | 114 |
| Zn3Al2Ge2O10 | 1.768 | 1.92 | 2.73 | 82.4 | 387 | 300 | 116 |
| Zn3Al2Ge3O12 | 1.802 | 1.88 | 2.70 | 84.1 | 395 | 300 | 117 |
| Zn6Al8GeO20 | 1.799 | 1.97 | 2.79 | 83.8 | 394 | 300 | 118 |
| ZnGa2O4 | 1.802 | 2.00 | 2.83 | 83.9 | 394 | 300 | 119 |
| 1.801 | 1.96 | 2.78 | 83.9 | 394 | 300 | 120 | |
| 1.808 | 1.96 | 2.79 | 84.2 | 396 | 300 | 121 | |
| 1.808 | 1.96 | 2.79 | 84.2 | 396 | 300 | 122 | |
| 1.808 | 1.99 | 2.82 | 84.2 | 396 | 300 | 123 | |
| Zn3Ga2GeO8 | 1.782 | 1.87 | 2.68 | 83.1 | 391 | 300 | 124 |
| Zn3Ga2Ge2O10 | 1.776 | 1.80 | 2.60 | 82.9 | 390 | 300 | 125 |
| Zn5Ga6GeO16 | 1.774 | 1.85 | 2.65 | 82.8 | 389 | 300 | 126 |
| Zn8Ga12Ge3O32 | 1.780 | 1.91 | 2.72 | 83.0 | 390 | 300 | 127 |
| 1.775 | 1.82 | 2.62 | 82.9 | 389 | 300 | 128 | |
| Zn3Ga2SnO8 | 1.782 | 1.90 | 2.71 | 83.1 | 390 | 300 | 124 |
| Zn6Ga8TiO20 | 1.749 | 1.90 | 2.70 | 81.5 | 383 | 300 | 129 |
| Zn2SnO4 | 1.766 | 1.78 | 2.57 | 82.5 | 388 | 300 | 130 |
| 1.766 | 1.86 | 2.66 | 82.4 | 387 | 300 | 131 |
a) E ∣∣ b. b) E ∣∣ x, y, z ( E ∣∣ a, b, c; i.e., no strong polarization dependence). c) E ⊥ c. d) E ∣∣ c. e)Cubic site. f)Tetragonal site. g) E ∣∣ a, b; T = 150 K (PL); Mg(I) site. h) E ∣∣ π, σ, α (i.e., no strong polarization dependence).
Figure 6 shows the effects of crystal field on the energy levels of Cr3+ ion in the Tanabe−Sugano energy-level diagram. 4,5 Here and below, we assume C/B ≡ r to be 4.7. 5,15,16 The symbols plotted correspond to those for the Bi2Al4O9:Cr3+ phosphor (see Fig. 5a). The E(2 Eg )ZPL, E(4 T2g )ZPL = 10Dq, E(4 T1g,a)ZPL, B, and C values were taken from a list in Table III. One can see in Fig. 6 an excellent agreement of the excited-state ZPL energies, E(2 Eg )ZPL, E(4 T2g )ZPL, and E(4 T1g,a)ZPL, divided by B, with the theoretical Tanabe−Sugano diagram curves. The Tanabe−Sugano diagram curves at Dq/B = 2.207 also provide the ZPL-related parameter values of E(2 T1g )ZPL/B = 23.0 with E(2 T1g )ZPL = 1.90 eV and E(2 T2g )ZPL/B = 31.7 with E(2 T2g )ZPL = 2.62 eV. These E/B values are also plotted by the shaded triangles in Fig. 6.

Figure 6. Tanabe–Sugano energy-level diagram for a 3d3 (Cr3+) ion in octahedral symmetry with r = 4.7. The circular symbols represent the various ZPL energies for the Bi2Al4O9:Cr3+ and Bi2Ga4O9:Cr3+ phosphors plotted against the crystal-field parameter Dq, both axes divided by B. The Racah and related parameters are determined by analyzing PL and PLE spectra in Fig. 5.
Download figure:
Standard image High-resolution imageNote that the weak, spin-forbidden 4 A2g → 2 T1g transition energy of E(2 T1g )ZPL = 1.90 eV nearly coincides with the strong, spin-allowed 4 A2g → 4 T2g transition one. Therefore, the former contribution can be successfully neglected in the present PLE spectral analysis of Fig. 5a. The vertical arrows in Fig. 5a indicate the positions of the various excited-state ZPL energies obtained in the present analysis.
An anomaly in PLE spectra of many Cr3+-activated "fluoride" phosphors can be sometimes observed. 14 This anomaly is due to the Fano resonance (protuberances) or anti-resonance (small dips) caused by the spin−orbit interaction between the sharp spin-forbidden 2 Eg (2 G) or 2 T1g (2 G) state and broad spin-allowed 4 T2g (4 F) state. 132,133 The theoretical Fano profile was discussed in detail by Sturge et al. 134 The same resonance/anti-resonance interaction may occur in Cr3+-activated "oxide" phosphors. In fact, a weak anomaly in the 4 A2g → 4 T2g transition region of the PLE spectrum is observed at ∼1.90 eV in Fig. 5a. Such a peculiar spectral feature sometimes makes possible to accurately determine the spin-forbidden ZPL transition energies at the various excited states like 2 Eg , 2 T1g , and 2 T2g from actual optical spectra. In fact, we can determine in Fig. 5a the E(2 T1g )ZP energy to be ∼1.9 eV. This value is in good agreement with the E(2 T1g )ZPL = 1.90 eV value estimated from the Tanabe−Sugano diagram curve in Fig. 6. Moreover, we can find in Fig. 5a an energy of ∼2.6 eV at which new excitation absorption transitions start to occur. This energy may correspond to the 4 T1g,a and 2 T2g -related ZPL transition energies, in good agreement with the values of E(4 T1g,a)ZPL = E(2 T2g )ZPL = 2.62 eV estimated from the Tanabe−Sugano diagram curves in Fig. 6 (open circle and shaded triangle).
GdAlO3:Cr3+ phosphor
The PL and PLE spectra of the GdAlO3:Cr3+ phosphor measured at 300 K are shown in Fig. 7. The experimental data are taken from Eldridge. 60 The sharp and strong PL peak can be easily found at ∼1.705 eV, which is caused by the 4 A2g → 2 Eg transition peak. Similarly, the largest PLE band peaking at ∼2.2 eV is due to the 4 A2g → 4 T2g excitation absorption transitions. The corresponding PLE component calculated using Eq. 9 with the fitting parameters of E(4 T2g )ZPL = 2.03 eV, hνp,ex = 60 meV, and S = 3 is shown by the vertical bars.

Figure 7. PL and PLE spectra for the GdAlO3:Cr3+ phosphor measured at 300 K. The experimental data are taken from Eldridge. 60 The vertical bars in the PLE spectrum show the results calculated using Eq. 9. The vertical arrows indicate the positions of the various excited-state ZPL energies, E(2 Eg )ZPL, E(4 T2g )ZPL, E(2 T2g )ZPL, E(4 T1g,a)ZPL. S = Stokes; a-S = anti-Stokes.
Download figure:
Standard image High-resolution imageThe values of E(2 Eg )ZPL = 1.705 eV and E(4 T2g )ZPL = 2.03 eV introduced into Eqs. 1−3 give the Racah-related parameters of B = 79.2 meV, C = 372 meV, E(4 T1g,a)ZPL = 2.83 eV, and Dq/B = 2.56 (Table III). The determined E(4 T1g,a)ZPL value then makes possible to calculate Eq. 9 for the PLE component caused by the 4 A2g → 4 T1g,a excitation transitions. This calculation yielded the best-fit parameters of E(4 T1g,a)ZPL = 2.83 eV, hνp,ex = 60 meV, and S = 3, and the result is shown by the vertical bars in Fig. 7.
The Tanabe−Sugano diagram plots for the GdAlO3:Cr3+ phosphor are shown in Fig. 8. The E/B plots for the 2 Eg , 4 T2g , and 4 T1g,a states are found to fall on the Tanabe−Sugano diagram curves very well. Further, the curve crossing at Dq/B = 2.56 gives the value of E(2 T2g )ZPL/B = 32.4 with E(2 T2g )ZPL = 2.57 eV. The open triangle in Fig. 8 represents this data point of E(2 T2g )ZPL/B. The corresponding PLE contribution calculated using Eq. 9 with E(2 T2g )ZPL = 2.57 eV, hνp,ex = 60 meV, and S = 4 is shown by the vertical bars in Fig. 7. An improvement of fit between the experimental and theoretical data can be obtained by adding this extra absorption term of E(2 T2g )ZPL.
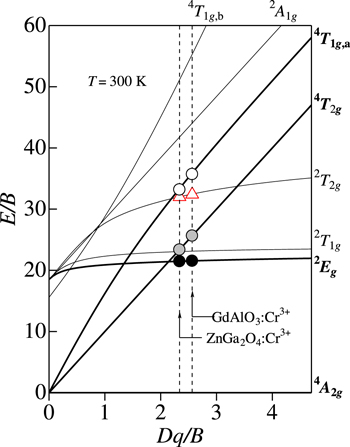
Figure 8. Tanabe–Sugano energy-level diagram for a 3d3 (Cr3+) ion in octahedral symmetry with r = 4.7. The circular symbols represent the various ZPL energies for the GdAlO3:Cr3+ and ZnGa2O4:Cr3+ phosphors plotted against the crystal-field parameter Dq, both axes divided by B. The Racah and related parameters are determined by analyzing PL and PLE spectra in Fig. 7 (GdAlO3:Cr3+) and 11 (ZnGa2O4:Cr3+).
Download figure:
Standard image High-resolution imageLa2ZnTiO6:Cr3+ phosphor
Figure 9 shows the PL and PLE spectra of the La2ZnTiO6:Cr3+ phosphor measured at 300 K. The experimental data are taken from Ou et al. 27 Note that the PL spectrum plotted in Fig. 9 is the same as that in Fig. 4g. At first glance, it is very difficult to conclude which peak is the ZPL peak or those originate from the Stokes and anti-Stokes sidebands. However, many PL spectral plots of various phosphors facilitate the ZPL peak determination very easy. Based on this, one can conclude the weak, but sharp peak at ∼1.672 eV in Fig. 4g to be due to the ZPL emission peak of the 2 Eg state. The PLE analysis using Eq. 9 also determines the following best-fitting parameters for the 4 A2g → 4 T2g excitation transitions: E(4 T2g )ZPL = 2.28 eV, hνp,ex = 60 meV, and S = 6.
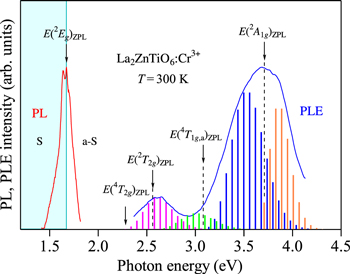
Figure 9. PL and PLE spectra for the La2ZnTiO6:Cr3+ phosphor measured at 300 K. The experimental data are taken from Ou et al. 27 The vertical bars in the PLE spectrum show the results calculated using Eq. 9. The vertical arrows indicate the positions of the various excited-state ZPL energies, E(2 Eg )ZPL, E(4 T2g )ZPL, E(2 T2g )ZPL, E(4 T1g,a)ZPL, and E(2 A1g )ZPL. S = Stokes; a-S = anti-Stokes.
Download figure:
Standard image High-resolution imageIntroducing E(2 Eg )ZPL = 1.672 eV and E(4 T2g )ZPL = 2.28 eV into Eqs. 1−3, we obtain B = 77.3 meV, C = 363 meV, E(4 T1g,a)ZPL = 3.08 eV, and Dq/B = 2.95 for the La2ZnTiO6:Cr3+ phosphor. The corresponding Tanabe−Sugano energy-level diagram plots are shown in Fig. 10. The E/B curve crossings at Dq/B = 2.95 give the following ZPL energy parameters: E(2 T2g )ZPL/B = 33.1 with E(2 T2g )ZPL = 2.56 eV and E(2 A1g )ZPL/B = 48.0 with E(2 A1g )ZPL = 3.71 eV (open triangles).
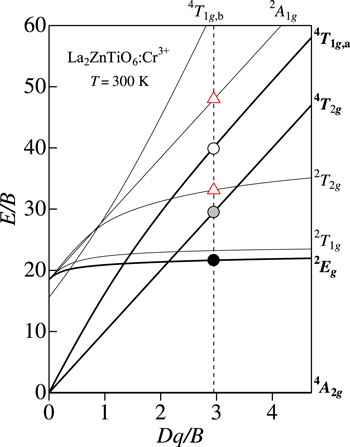
Figure 10. Tanabe–Sugano energy-level diagram for a 3d3 (Cr3+) ion in octahedral symmetry with r = 4.7. The circular symbols represent the various ZPL energies for the La2ZnTiO6:Cr3+ phosphor plotted against the crystal-field parameter Dq, both axes divided by B. The Racah and related parameters are determined by analyzing PL and PLE spectra in Fig. 9.
Download figure:
Standard image High-resolution imageAs in Fig. 7, the addition of the 4 A2g → 2 T2g excitation transition component with the fitting parameters of E(2 T2g )ZPL = 2.56 eV, hνp,ex = 60 meV, and S = 8 in Eq. 9 can improve the fit with the experimental PLE spectrum in the spectral region between the E(4 T2g )ZPL and E(4 T1g,a)ZPL excitation transitions. Moreover, the broad excitation band peaking at ∼3.7 eV cannot be explained only by considering the 4 A2g → 4 T1g,a excitation transition component. Therefore, we further consider the 4 A2g → 2 A1g excitation transition component with E(2 A1g )ZPL = 3.71 eV, hνp,ex = 60 meV, and S = 3 in Eq. 9. An improvement of the fit with the experimental PLE spectrum is easily understood in Fig. 9.
ZnGa2O4:Cr3+ phosphor
Figure 11 shows the PL and PLE spectra of the ZnGa2O4:Cr3+ phosphor measured at 300 K. The experimental data are taken from Li et al. 120 As in Fig. 9, it is very difficult to determine the 2 E2 → 4 A2g ZPL transition energy in the PL spectrum. Plotting PL intensities on the horizontal axis of E − E(2 Eg )ZPL in Fig. 4, we determine the E(2 Eg )ZPL ∼ 1.801 eV value for the ZnGa2O4:Cr3+ phosphor. Note that the strongest PL peak in Fig. 11 appears at ∼1.751 eV. If we assume its peak as the E(2 Eg )ZPL emission peak, some contradiction arises that is the Stokes emission component is much weaker than the anti-Stokes emission one. Thus, the E(2 Eg )ZPL energy position should be larger in energy than ∼1.751 eV. The peak energy of E(2 Eg )ZPL ∼ 1.801 eV was determined by satisfying this requirement. The spectral PLE calculation using Eq. 9 also determines the value of E(4 T2g )ZPL = 1.96 eV with hνp,ex = 60 meV and S = 5, as shown in Fig. 11.

Figure 11. PL and PLE spectra for the ZnGa2O4:Cr3+ phosphor measured at 300 K. The experimental data are taken from Li et al. 120 The vertical bars in the PLE spectrum show the results calculated using Eq. 9. The vertical arrows indicate the positions of the various excited-state ZPL energies, E(2 Eg )ZPL, E(4 T2g )ZPL, E(2 T2g )ZPL. and E(4 T1g,a)ZPL. S = Stokes; a-S = anti-Stokes.
Download figure:
Standard image High-resolution imageThe ZPL energies of E(2 Eg )ZPL = 1.801 eV and E(4 T2g )ZPL = 1.96 eV, and the use of Eqs. 1−3 provide B = 83.9 meV, C = 394 meV, E(4 T1g,a)ZPL = 2.78 eV, and Dq/B = 2.34 for the ZnGa2O4:Cr3+ phosphor. The corresponding Tanabe−Sugano energy-level diagram is shown in Fig. 8. The E/B curve crossing at Dq/B = 2.34 gives E(2 T2g )ZPL/B = 32.0 with E(2 T2g )ZPL = 2.68 eV (open triangle). The PLE spectrum coming from these 4 A2g → 2 T2g excitation transitions is also calculated and plotted in Fig. 11. The best-fit parameters of Eq. 9 are: E(4 T2g )ZPL = 2.68 eV, hνp,ex = 60 meV, and S = 2.
Cr3+-Activated Oxide Phosphors of Type O–Cr–B: Specific Spectral Analysis
Bi2Ga4O9:Cr3+ phosphor
Bi2Al4O9 and Bi2Ga4O9 compounds are isostructural materials and crystallize in the orthorhombic structure. The Cr3+-doped Bi2Al4O9 phosphor is of type O–Cr–A, and its fundamental phosphor properties were discussed before (Figs. 5a and 6). Let us show in Fig. 5b the PL and PLE spectra of the Bi2Ga4O9:Cr3+ phosphor measured at 300 K. 33 The sharp PL peaks at ∼1.747 and 1.768 eV are due to the E(2 Eg )ZPL energy peaks (R1 and R2 lines) with the "center-of-gravity" energy of E(2 Eg )ZPL = 1.758 eV. The lower-energy broad luminescence band peaking at ∼1.6 eV is attributed to the 4 T2g → 4 A2g emission transitions. The best fit of this broad luminescence band using Eq. 7 is shown by the vertical bars in Fig. 5b, giving E(4 T2g )ZPL = 1.72 eV, hνp,em = 60 meV, and S = 2. Thus, the energy inequality relation of E(4 T2g )ZPL < E(2 Eg )ZPL holds for the Bi2Ga4O9:Cr3+ phosphor and suggests its phosphor type being of O–Cr–B. The large 4 T2g -related excitation band peaking at ∼2.0 eV has also been analyzed using Eq. 9 and obtained E(4 T2g )ZPL = 1.72 eV, hνp,ex = 60 meV, and S = 5 as best-fit parameters.
The "center of gravity" energy of the spin–orbit split R1 and R2 peaks is given by E(2 Eg )ZPL = 1.758 eV. Using this value and E(4 T2g )ZPL = 1.72 eV, we obtain B = 82.2 meV, C = 386 meV, E(4 T1g,a)ZPL = 2.50 eV, and Dq/B = 2.092 (≅2.09) for the Bi2Ga4O9:Cr3+ phosphor. Table IV summarizes some important excited-state ZPL energies, together with the Racah and crystal-field parameters B, C, and Dq/B, for the various Cr3+-activated oxide phosphors of type O–Cr–B determined in the present study. 7,19,33,61,84,94,135–203 The excited-state ZPL energies of E(2 Eg )ZPL, E(4 T2g )ZPL, and E(4 T1g,a)ZPL vs Dq, divided by B, are also plotted on the Tanabe−Sugano energy-level diagram in Fig. 6.
Table IV. Summary of host materials, ZPL transition energies [E(2 Eg )ZPL, E(4 T2g )ZPL = 10Dq, and E(4 T1g,a)ZPL], and Racah parameters (B and C) for the Cr3+-activated oxide phosphors of type O–Cr–B. Values of E(4 T1g,a)ZPL were calculated from Eq. 3 (C/B = 4.7).
| Host | 2 Eg (R1/R2) (eV) | 4 T2g (eV) | 4 T1g,a (eV) | B (meV) | C (meV) | T (K) | References |
|---|---|---|---|---|---|---|---|
| Al2(WO4)3 | 1.734 | 1.67 | 2.44 | 81.2 | 381 | 300 | 135 |
| AlSc(WO4)3 | 1.741 a) | 1.58 a) | 2.34 | 81.7 | 384 | 300 | 136 |
| Al2SiO5 | 1.791 | 1.79 | 2.59 | 83.7 | 393 | 300 | 137 |
| BaZrSi3O9 | 1.837 | 1.70 | 2.50 | 86.1 | 405 | 300 | 138 |
| Bi2AlGa3O9 | 1.746/1.767 | 1.70 | 2.48 | 82.2 | 386 | 300 | 33 |
| Bi2Al2Ga2O9 | 1.753/1.770 | 1.72 | 2.50 | 82.4 | 387 | 300 | 33 |
| Bi2Al3GaO9 | 1.756/1.772 | 1.75 | 2.54 | 82.5 | 388 | 300 | 33 |
| Bi2Ga4O9 | 1.747/1.768 | 1.72 | 2.50 | 82.2 | 386 | 300 | 33 |
| 1.747/1.767 | 1.68 | 2.46 | 82.3 | 387 | 300 | 139 | |
| Ca3Al2Ge4O14 | 1.818 | 1.72 | 2.52 | 85.2 | 400 | 300 | 140 |
| Ca3Ga2Ge3O12 | 1.845 | 1.72 | 2.53 | 86.5 | 406 | 300 | 138 |
| Ca3Hf2Al2SiO12 | 1.795 | 1.71 b) | 2.50 | 84.1 | 395 | 300 | 141 |
| 1.795 | 1.66 c) | 2.44 | 84.2 | 396 | 300 | 141 | |
| Ca2LuHf2Al3O12 | 1.795 | 1.71 | 2.50 | 84.1 | 395 | 300 | 141 |
| 1.814 | 1.65 | 2.44 | 85.1 | 400 | 300 | 142 | |
| Ca2LuScGa2Ge2O12 | 1.83 | 1.71 | 2.51 | 85.8 | 403 | 300 | 143 |
| Ca2LuZr2Al3O12 | 1.810 | 1.68 | 2.47 | 84.9 | 399 | 300 | 144 |
| CaSc2O4 | 1.770 | 1.66 | 2.44 | 82.9 | 390 | 2.7 | 145 |
| Ca3Sc2Ge3O12 | 1.828 | 1.72 | 2.52 | 85.6 | 403 | 10 | 146 |
| 1.825 | 1.72 | 2.52 | 85.5 | 402 | 300 | 146 | |
| Ca3Sc2Si3O12 | 1.788 | 1.69 | 2.48 | 83.8 | 394 | 300 | 7 |
| 1.771 | 1.70 | 2.48 | 82.9 | 390 | 300 | 147 | |
| CaY2Mg2Ge3O12 | 1.775 | 1.72 | 2.51 | 83.1 | 390 | 300 | 148 |
| CaZnGe2O6 | 1.70 | 300 | 149 | ||||
| CdWO4 | 1.760 | 1.26 | 1.95 | 83.6 | 393 | 10 | 204 |
| (Ce0.82Gd0.18)Sc3(BO3)4 | 1.840 d,e) | 1.61 d,e) | 2.40 | 86.5 | 407 | 300 | 150 |
| CsAl(MoO4)2 | 1.673 | 1.64 | 2.38 | 78.2 | 368 | 300 | 151 |
| β-Ga2O3 | 1.777/1.798 | 1.77 | 2.57 | 83.6 | 393 | 300 | 152 |
| Gd3Ga5O12 | 1.782 | 1.78 | 2.58 | 83.3 | 391 | 300 | 153 |
| 1.798 | 1.76 | 2.56 | 84.1 | 395 | 85 | 154 | |
| GdSc3(BO3)4 | 1.830 | 1.57 | 2.35 | 86.1 | 405 | 300 | 61 |
| Gd3Sc2Ga3O12 | 1.795 | 1.77 | 2.57 | 83.9 | 394 | 300 | 155 |
| 1.830 | 1.77 | 2.58 | 85.6 | 402 | 300 | 156 | |
| Gd3(Sc1−x Gax)2Ga3O12 | 1.789 | 1.72 | 2.51 | 83.7 | 394 | 300 | 153 |
| In2(WO4)3 | 1.734 | 1.57 | 2.32 | 81.4 | 382 | 300 | 157 |
| KAl (MoO4)2 | 1.681 | 1.65 | 2.40 | 78.6 | 369 | 300 | 158 |
| K2Ga2Sn6O16 | 1.746 | 1.64 | 2.41 | 81.8 | 385 | 300 | 159 |
| KIn(MoO4)2 | 1.715 | 1.50 | 2.24 | 80.6 | 379 | 5 | 160 |
| 1.713 | 1.50 | 2.23 | 80.5 | 378 | 300 | 160 | |
| KIn(WO4)2 | 1.749 | 1.55 | 2.30 | 82.2 | 386 | 300 | 161 |
| K3(Mg0.3Sc0.7)10(MoO4)15 | 1.710 | 1.58 | 2.33 | 80.2 | 377 | 300 | 162 |
| KSc (WO4)2 | 1.736 | 1.58 | 2.33 | 81.5 | 383 | 300 | 163 |
| KTiOPO4 | 1.755 d) | 1.62 d) | 2.39 | 82.3 | 387 | 300 | 164 |
| La3Ga5GeO14 | 1.781/1.802 f) | 1.78 f) | 2.58 | 83.8 | 394 | 300 | 165 |
| 1.45 g) | 300 | 165 | |||||
| La6Ga11NbO28 | 1.83 h) | 300 | 166 | ||||
| 1.47 i) | 300 | 166 | |||||
| La3Ga5SiO14 | 1.782 j) | 1.65 k) | 2.43 | 83.6 | 393 | 15 | 167 |
| 1.782 j) | 1.70 l,m) | 2.49 | 83.4 | 392 | 15 | 167 | |
| (La1−x Lux)5Ga3O12 | 1.792 | 1.62 | 2.40 | 84.1 | 395 | 300 | 153 |
| LaSc3(BO3)4 | 1.833 a) | 1.61 a) | 2.40 | 86.2 | 405 | 300 | 168 |
| 1.842 | 1.51 | 2.28 | 86.9 | 408 | 300 | 169 | |
| La3Sc2Ga3O12 | 1.65 | 300 | 155 | ||||
| LiCrSi2O6 | 1.809 n) | 1.63 n) | 2.41 | 84.9 | 399 | 300 | 170 |
| LiGa(WO4)2 | 1.680 | 1.58 | 2.32 | 78.7 | 370 | 300 | 171 |
| LiIO3 | 1.760 | 1.54 | 2.29 | 82.7 | 389 | 300 | 172 |
| LiInSiO4 | 1.825 o) | 1.55 p) | 2.32 | 85.9 | 404 | 300 | 173 |
| 1.35 q) | 300 | 173 | |||||
| LiInSi2O6 | 1.817 | 1.62 | 2.40 | 85.3 | 401 | 300 | 174 |
| LiIn(WO4)2 | 1.715 | 1.40 | 2.12 | 80.9 | 380 | 300 | 161 |
| LiLaP4O12 | 1.580 | 1.55 | 2.25 | 73.9 | 347 | 273 | 175 |
| LiNbO3 | 1.714 | 1.64 | 2.40 | 80.2 | 377 | 15 | 176 |
| 1.718 | 1.68 | 2.44 | 80.4 | 378 | 300 | 177 | |
| 1.720 d,e) | 1.60 d,e) | 2.35 | 80.6 | 379 | 300 | 178 | |
| LiScP2O7 | 1.847 | 1.60 | 2.39 | 86.9 | 408 | 300 | 179 |
| LiSc(WO4)2 | 1.714 | 1.34 | 2.04 | 81.0 | 381 | 300 | 180 |
| LiTaO3 | 1.729 | 1.58 | 2.33 | 81.1 | 381 | 5 | 181 |
| 1.726 k) | 1.58 k) | 2.33 | 81.0 | 381 | 300 | 181 | |
| 1.726 l) | 1.60 l) | 2.35 | 80.9 | 380 | 300 | 181 | |
| Li1.6Zn1.6Sn2.8O8 | 1.753 | 1.64 | 2.41 | 82.2 | 386 | 300 | 182 |
| Lu3Sc2Ga3O12 | 1.797 | 1.77 | 2.57 | 84.0 | 395 | 300 | 155 |
| MgO | 1.785 r) | 1.69 r) | 2.48 | 83.6 | 393 | 77 | 84 |
| MgCaSi2O6 | 1.819 | 1.47 | 2.23 | 85.8 | 403 | 300 | 183 |
| MgCa2WO6 | 1.54 | 300 | 19 | ||||
| Mg2CaY2Ge3O12 | 1.775 | 1.76 | 2.55 | 83.0 | 390 | 300 | 7 |
| MgLa2ZrO6 | 1.64 | 300 | 184 | ||||
| MgMoO4 | 1.716 | 1.58 | 2.33 | 80.5 | 378 | 10 | 204 |
| Mg2SiO4 | 1.682 s) | 1.64 s) | 2.39 | 78.7 | 370 | 10 | 94 |
| MgSr8La(PO4)7 | 1.56 | 300 | 185 | ||||
| MgSr2WO6 | 1.642 | 1.57 | 2.29 | 76.9 | 361 | 300 | 186 |
| MgTa2O6 | 1.57 | 300 | 187 | ||||
| MgWO4 | 1.729 | 1.44 | 2.17 | 81.5 | 383 | 10 | 204 |
| 1.726 | 1.42 | 2.14 | 81.4 | 382 | 300 | 188 | |
| 1.724 a) | 1.44 a) | 2.17 | 81.2 | 382 | 300 | 189 | |
| Mg3Y2Ge3O12 | 1.73 | 300 | 190 | ||||
| NaAl(WO4)2 | 1.714 | 1.67 | 2.43 | 80.2 | 377 | 10 | 191 |
| 1.750 | 1.70 | 2.48 | 81.9 | 385 | 300 | 192 | |
| Na2CaGe3Sn2O12 | 1.70 | 300 | 193 | ||||
| Na2CaTi2Ge3O12 | 1.70 | 300 | 193 | ||||
| Na3Ce(PO4)2 | 1.740 | 1.63 | 2.39 | 81.5 | 383 | 300 | 194 |
| NaCrSi2O6 | 1.808 n) | 1.63 n) | 2.41 | 84.9 | 399 | 300 | 170 |
| NaIn(MoO4)2 | 1.715 | 1.35 | 2.06 | 81.1 | 381 | 300 | 160 |
| NaIn(WO4)2 | 1.740 | 1.40 | 2.12 | 82.1 | 386 | 300 | 161 |
| Na2Mg5(MoO4)6 | 1.719 | 1.55 | 2.29 | 80.7 | 379 | 300 | 195 |
| NaMg3Al(MoO4)5 | 1.787 | 1.62 | 2.40 | 83.9 | 394 | 8 | 196 |
| NaScSi2O6 | 1.805 | 1.62 | 2.40 | 84.7 | 398 | 300 | 197 |
| RbAl(MoO4)2 | 1.673 | 1.62 | 2.36 | 78.3 | 368 | 300 | 151 |
| RbIn(WO4)2 | 1.740 | 1.60 | 2.36 | 81.6 | 384 | 300 | 161 |
| Sc2O3 | 1.726 f) | 1.64 f) | 2.40 | 80.8 | 380 | 300 | 198 |
| 1.20 g) | 300 | 198 | |||||
| ScBO3 | 1.70 | 300 | 199 | ||||
| 1.865 | 1.67 | 2.48 | 87.6 | 412 | 300 | 200 | |
| Sc2(MoO4)3 | 1.692 | 1.54 | 2.28 | 79.4 | 373 | 300 | 201 |
| Sc2(WO4)3 | 1.734 | 1.58 | 2.33 | 81.4 | 382 | 300 | 157 |
| ScIn(WO4)3 | 1.732 | 1.58 | 2.33 | 81.3 | 382 | 300 | 157 |
| SrGa4O7 | 1.782 | 1.69 | 2.47 | 83.5 | 392 | 300 | 202 |
| SrSc2O4 | 1.770 | 1.62 | 2.39 | 83.0 | 390 | 2.7 | 145 |
| Y3Ga5O12 | 1.791 | 1.79 | 2.59 | 83.7 | 393 | 300 | 153 |
| 1.793 | 1.78 | 2.58 | 83.8 | 394 | 300 | 203 | |
| YSc3(BO3)4 | 1.820 | 1.63 | 2.42 | 85.5 | 402 | 300 | 61 |
| Y3Sc2Ga3O12 | 1.794 | 1.77 | 2.57 | 83.9 | 394 | 300 | 155 |
| Y3(Sc1−x Gax)2Ga3O12 | 1.790 | 1.78 | 2.58 | 83.7 | 393 | 300 | 153 |
| ZnWO4 | 1.724 | 1.44 | 2.17 | 81.2 | 382 | 10 | 204 |
a) E ∣∣ x, y, z ( E ∣∣ a, b, c; i.e., no strong polarization dependence). b)Cr (I) site. c)Cr (II) site. d) E ∣∣ c. e) E ⊥ c. f)Center I. g)Center II. h)Octahedral site. i)Tetrahedral site. j)Assuming no polarization dependence. k) π polarization. l) σ polarization. m) α polarization. n) E ∣∣ α, β, γ (i.e., no strong polarization dependence). o)Estimated from an optical absorbance spectrum. p)Octahedral site (I). q)Octahedral site (II). r)Rhombic site. s) E ∣∣ a, b; Mg(II) site.
Note that the weak Fano resonance/antiresonance structures can be observed at ∼1.92 and 2.60 eV in the PLE spectrum of Fig. 5b. The positions of these structures may correspond to the E(2 T1g )ZPL and E(2 T2g )ZPL energies, respectively. The shaded triangles in Fig. 6 represent these spin-forbidden excited-state ZPL energies divided by B. All the Fano resonance/antiresonance-estimated E/B values for the Bi2Al4O9:Cr3+ and Bi2Ga4O9:Cr3+ phosphors fall on their Tanabe−Sugano diagram curves reasonably well; however, only the E(2 T1g )ZPL/B plot for the Bi2Ga4O9:Cr3+ phosphor is seemed to be slightly larger than the Tanabe−Sugano diagram value.
Ca3Sc2Ge3O12:Cr3+ phosphor
The Ca3Sc2Ge3O12:Cr3+ phosphor is of type O–Cr–B. Figure 12 shows the PL and PLE spectra of the Ca3Sc2Ge3O12:Cr3+ phosphor measured at 10 K. The experimental data are taken from Cavalli et al. 146 Because of the energy inequality relation of E(4 T2g )ZPL < E(2 Eg )ZPL for type O–Cr–B phosphors, their PL and PLE spectra are quite different from those of type O–Cr–A phosphors. The resultant PL spectrum for the Ca3Sc2Ge3O12:Cr3+ phosphor can be characterized by a broad 4 T2g -related emission band, and is fitted using Eq. 7 in Fig. 12. Since the PL spectrum was measured at cryogenic temperature of T = 10 K, the best fit required only the Stokes emission component with E(4 T2g )ZPL = 1.72 eV, hνp,em = 60 meV, and S = 2.
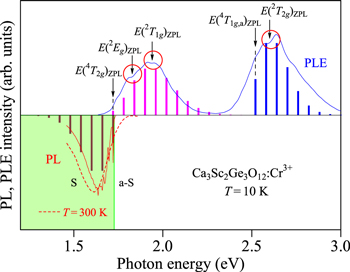
Figure 12. PL and PLE spectra of the Ca3Sc2Ge3O12:Cr3+ phosphor measured at 10 K. The experimental data are taken from Cavalli et al. 146 The PL spectrum measured at T = 300 K is also shown by the dashed line. The vertical bars in the PL and PLE spectra show the results calculated using Eqs. 7 and 9, respectively. The vertical arrows indicate the positions of the various excited-state ZPL energies, E(4 T2g )ZPL, E(2 Eg )ZPL, E(2 T1g )ZPL, E(4 T1g,a)ZPL, and E(2 T2g )ZPL. The open circles in red color also show the regions occurring Fano resonance/antiresonance interaction. S = Stokes; a-S = anti-Stokes.
Download figure:
Standard image High-resolution imageThe PL spectrum measured at 300 K is also shown by the dashed line in Fig. 12. 146 Because of the high temperature measurement of 300 K, its PL spectrum shows relatively broader emission band than that at 10 K with the maximum peak energy being slightly shifted toward the low-energy side. The high-energy luminescence tail is also observed to be due to the anti-Stokes emission component.
The first excitation band peaking at ∼1.9 eV in Fig. 12 is analyzed using Eq. 9. The resulting best-fit parameters are: E(4 T2g )ZPL = 1.72 eV, hνp,ex = 60 meV, and S = 4. Because of the mirror reflection relation between the PL and PLE spectra in Fig. 12, we used the same ZPL energies of E(4 T2g )ZPL = 1.72 eV in Eqs. 7 and 9. An agreement between the theory and experiment is excellent for both PL and PLE spectra in the 2 Eg ↔ 4 A2g transition region (∼1.3 − 2.3 eV).
Note that the first excitation band in the PLE spectrum of Fig. 12 shows singularities arising from the Fano resonance/antiresonance interaction between the sharp spin-forbidden 2 Eg and 2 T1g states with broad spin-allowed 4 T2g state. From these spectral singularities, we can estimate the spin-forbidden excited-state ZPL energies of E(2 Eg )ZPL = 1.828 eV and E(2 T1g )ZPL = 1.94 eV. We can also find singularity in the PLE spectrum at ∼2.6 eV. This singularity is caused by the Fano resonance/antiresonance interaction between the spin-forbidden 2 T2g and spin-allowed 4 T2g states, suggesting the spin-forbidden transitions being occur at E(2 T2g )ZPL = 2.60 eV.
Introducing E(2 Eg )ZPL = 1.828 eV and E(4 T2g )ZPL = 1.72 eV into Eqs. 1−3, we obtain B = 85.6 meV, C = 403 meV, E(4 T1g,a)ZPL = 2.52 eV, and Dq/B = 2.01 for the Ca3Sc2Ge3O12:Cr3+ phosphor. The corresponding E(2 Eg )ZPL/B, E(4 T2g )ZPL/B, and E(4 T1g,a)ZPL/B vs Dq/B plots on the Tanabe−Sugano energy-level diagram are shown in Fig. 13. The PLE contribution coming from the 4 T1g,a excited state is also shown by the vertical bars in Fig. 12.
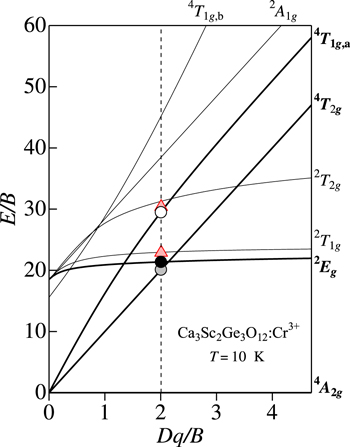
Figure 13. Tanabe–Sugano energy-level diagram for a 3d3 (Cr3+) ion in octahedral symmetry with r = 4.7. The circular symbols represent the various ZPL energies for the Ca3Sc2Ge3O12:Cr3+ phosphor plotted against the crystal-field parameter Dq, both axes divided by B. The Racah and related parameters are determined by analyzing PL and PLE spectra in Fig. 12.
Download figure:
Standard image High-resolution imageNote that the spin-forbidden 4 A2g → 2 T1g and 4 A2g → 2 T2g transition intensities may be definitely weaker than those of the spin-allowed 4 A2g → 4 T2g and 4 A2g → 4 T1g,a transitions. Therefore, the former contributions may be nearly completely masked by the latter ones. Because of this, we did not add such weak excitation absorption components in Fig. 12. However, the values of E(2 T1g )ZPL/B = 22.7 [E(2 T1g )ZPL = 1.94 eV] and E(2 T2g )ZPL/B = 30.4 [E(2 T2g )ZPL = 2.60 eV], determined from the Fano resonance/antiresonance structures in Fig. 12 are plotted by the shaded triangles in Fig. 13. All these E/B vs Dq/B plots in Fig. 13 fall on the Tanabe−Sugano diagram curves very well.
LiInSi2O6:Cr3+ phosphor
The PL and PLE spectra for the LiInSi2O6:Cr3+ phosphor measured at 300 K are shown in Fig. 14. The experimental data are taken from Xu et al. 174 The same authors also measured diffuse reflectance spectra. The optical spectrum on the top of Fig. 14 represents their obtained diffuse reflectance spectrum. Some Fano resonance/antiresonance singularities appear in both PLE and diffuse reflectance spectra at ∼1.8 eV. These singularities enabled determination of a value of E(2 Eg )ZPL = 1.817 eV. Further weak Fano singularities can be found at energies higher than ∼1.9 eV, giving E(2 T1g )ZPL = 1.96 eV and E(2 T2g )ZPL = 2.65 eV. Such a Fano interaction-induced singularity between the spin-forbidden 2 Eg and spin-allowed 4 T2g states has also been observed in diffuse reflectance spectrum of LiScP2O7:Cr3+ phoshor. 179
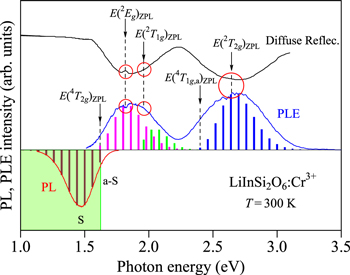
Figure 14. Diffuse reflectance, PL, and PLE spectra of the LiInSi2O6:Cr3+ phosphor measured at 300 K. The experimental data are taken from Xu et al. 174 The vertical bars in the PL and PLE spectra show the results calculated using Eqs. 7 and 9, respectively. The vertical arrows indicate the positions of the various excited-state ZPL energies, E(4 T2g )ZPL, E(2 Eg )ZPL, E(2 T1g )ZPL, E(4 T1g,a)ZPL, and E(2 T2g )ZPL. The open circles in red color also show the regions occurring Fano resonance/antiresonance interaction. S = Stokes; a-S = anti-Stokes.
Download figure:
Standard image High-resolution imageThe PL spectrum analyzed using Eq. 7 in Fig. 14 gives E(4 T2g )ZPL = 1.62 eV, hνp,em = 60 meV, and S = 3. The same analysis, but for the PLE spectrum using Eq. 9 also gives E(4 T2g )ZPL = 1.62 eV, hνp,ex = 60 meV, and S = 4. Introducing E(2 Eg )ZPL = 1.817 eV and E(4 T2g )ZPL = 1.62 eV into Eqs. 1−3, we obtain the Racah-related energy parameters of B = 85.3 meV, C = 401 meV, E(4 T1g,a)ZPL = 2.40 eV, and Dq/B = 1.90 for the LiInSi2O6:Cr3+ phosphor.
Determination of the ZPL energies of E(2 T1g )ZPL and E(4 T1g,a)ZPL makes possible to obtain each PLE spectral component using Eq. 9. The results obtained are shown by the vertical bars in Fig. 14 with the following parameters: E(2 T1g )ZPL = 1.96 eV, hνp,ex = 60 meV, and S = 2 for the 4 A2g → 2 T1g excitation transitions; E(4 T1g,a)ZPL = 2.40 eV, hνp,ex = 60 meV, and S = 5 for the 4 A2g → 4 T1g,a excitation transitions. The E/B vs Dq/B plots are also shown in Fig. 15, indicating an excellent agreement with the Tanabe−Sugano energy-level diagram values.
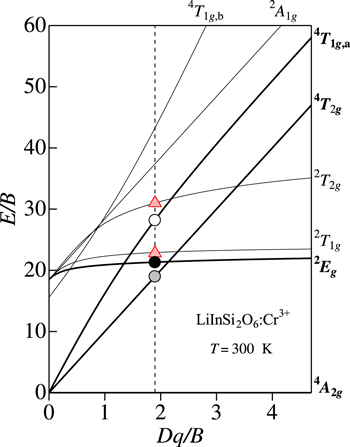
Figure 15. Tanabe–Sugano energy-level diagram for a 3d3 (Cr3+) ion in octahedral symmetry with r = 4.7. The circular symbols represent the various ZPL energies for the LiInSi2O6:Cr3+ phosphor plotted against the crystal-field parameter Dq, both axes divided by B. The Racah and related parameters are determined by analyzing PL and PLE spectra in Fig. 14.
Download figure:
Standard image High-resolution imageMgCaSi2O6:Cr3+ phosphor
The PL and PLE spectra for the MgCaSi2O6:Cr3+ phosphor measured at 300 K are shown in Fig. 16. The experimental data are taken from Huang et al. 183 The PL spectrum in Fig. 16 reveals the double peak structure at ∼1.3 and 1.6 eV. The vertical vars on its spectrum show the analysis results using Eq. 7 with E(4 T2g )ZPL = 1.47 eV, hνp,em = 60 meV, and S = 4 (Stokes luminescence component peaking at ∼1.3 eV); with E(4 T2g )ZPL = 1.47 eV, hνp,em = 60 meV, and S = 2 (anti-Stokes luminescence component peaking at ∼1.6 eV).
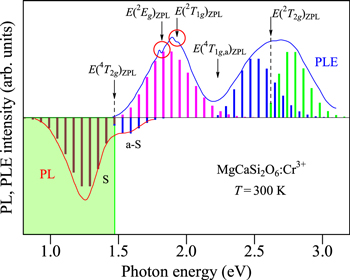
Figure 16. Diffuse reflectance, PL, and PLE spectra of the MgCaSi2O6:Cr3+ phosphor measured at 300 K. The experimental data are taken from Huang et al. 183 The vertical bars in the PL and PLE spectra show the results calculated using Eqs. 7 and 9, respectively. The vertical arrows indicate the positions of the various excited-state ZPL energies, E(4 T2g )ZPL, E(2 Eg )ZPL, E(2 T1g )ZPL, E(4 T1g,a)ZPL, and E(2 T2g )ZPL. The open circles in red color also show the regions occurring Fano resonance/antiresonance interaction. S = Stokes; a-S = anti-Stokes.
Download figure:
Standard image High-resolution imageThe PLE spectrum in Fig. 16 reveals the Fano resonance/antiresonance structures near the maximum of the 4 A2g → 4 T2g excitation transition band. From these Fano resonance/antiresonance structures, the ZPL transition energies are determined to be given by E(2 Eg )ZPL = 1.819 eV and E(2 T1g )ZPL = 1.93 eV for the MgCaSi2O6:Cr3+ phosphor. The spectral analysis of the 4 A2g → 4 T2g excitation transition band using Eq. 9 also provides the fitting parameters of E(4 T2g )ZPL = 1.47 eV, hνp,ex = 60 meV, and S = 7.
Introducing E(2 Eg )ZPL = 1.819 eV and E(4 T2g )ZPL = 1.47 eV into Eqs. 1−3, we obtain B = 85.8 meV, C = 403 meV, E(4 T1g,a)ZPL = 2.23 eV, and Dq/B = 1.71 for the MgCaSi2O6:Cr3+ phosphor. The E/B vs Dq/B data obtained from the PL and PLE analyses and Fano resonance/antiresonance structures in Fig. 16 are also plotted in Fig. 17 and are found to be in good agreement with the Tanabe−Sugano energy-level diagram values.
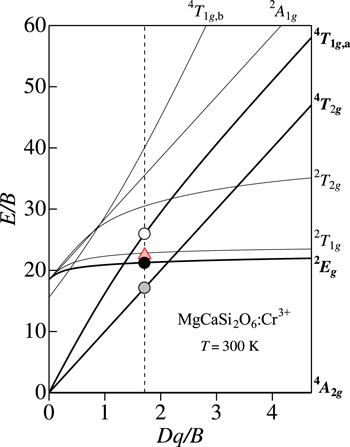
Figure 17. Tanabe–Sugano energy-level diagram for a 3d3 (Cr3+) ion in octahedral symmetry with r = 4.7. The circular symbols represent the various ZPL energies for the MgCaSi2O6:Cr3+ phosphor plotted against the crystal-field parameter Dq, both axes divided by B. The Racah and related parameters are determined by analyzing PL and PLE spectra in Fig. 16.
Download figure:
Standard image High-resolution imageRecapitulation of Spectroscopic Properties of Cr3+-Activated Oxide Phosphors
We summarized in Tables III and IV some important excited-state ZPL energies and Racah parameters for the Cr3+-activated oxide phosphors of types O–Cr–A and O–Cr–B, respectively. The first and second lowest excited-state ZPL energies E(2 Eg )ZPL and E(4 T2g )ZPL for phosphors of type O–Cr–A, respectively, or those of E(4 T2g )ZPL and E(2 Eg )ZPL for phosphors of type O–Cr–B, respectively, listed in these tables were determined by analyzing the experimental PL and PLE spectra of such oxide phosphors ever-reported. The second highest spin-allowed ZPL transition energies of E(4 T2g,a)ZPL and Racah parameters B and C were then obtained from analytical expressions of Eqs. 1−3.
Figure 18 plots the excited-state ZPL energies, E(2 Eg )ZPL, E(4 T2g )ZPL, and E(4 T1g,a)ZPL, against Dq, divided by B, for (a) the Cr3+ and Mn4+-activated "oxide" phosphors and (b) those of the "fluoride" phosphors. The data values of the Cr3--activated oxide phosphors plotted were taken from Tables III and IV. The same, but those for the Cr3+-activated "fluoride" phosphors were taken from Ref. 14. The Mn4+-activated "oxide" and "fluoride" phosphor data were taken from a list in Ref. 10 (see also Ref. 32).
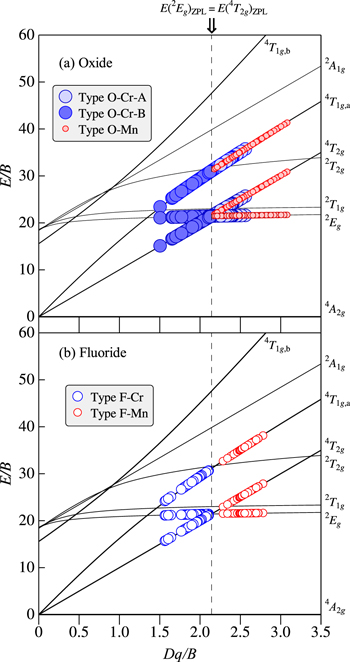
Figure 18. Tanabe–Sugano diagram for Cr3+ and Mn4+ ions in the various (a) oxide and (b) fluoride hosts with r = 4.7. The circular symbols represent the excited-state ZPL energies, E(2 Eg )ZPL, E(4 T2g )ZPL, and E(4 T1g,a)ZPL, for the oxide and fluoride phosphors plotted against the crystal-field parameter Dq, both axes divided by B. The Racah and related parameters are taken from Tables III and IV for the Cr3+-activated oxide phosphors. The same, but those for the Cr3+-activated fluoride phosphors are taken from Ref. 14. The Mn4+ ion data for the oxide and fluoride hosts are also taken from a list in Ref. 10 (see also Ref. 32). The dashed line at Dq/B ∼ 2.1 represents the boundary of types O–Cr–A (O–Mn, F–Mn) [E(2 Eg )ZPL < E(4 T2g )ZPL] and O–Cr–B (F–Cr) [E(4 T2g )ZPL < E(2 Eg )ZPL].
Download figure:
Standard image High-resolution imageAs mentioned earlier, all the Mn4+-activated "oxide" phosphors belong to type O–Mn [E(2 Eg )ZPL < E(4 T2g )ZPL]. All the Mn4+-activated "fluoride" phosphors also belong to type F–Mn [E(2 Eg )ZPL < E(4 T2g )ZPL]. Similarly, all the Cr3+-activated "fluoride" phosphors belong to type F–Cr [E(4 T2g )ZPL < E(2 Eg )ZPL]. The present investigation suggested that such spectroscopic properties of the Cr3+-activated "oxide" phosphors are dependent on the crystal-field strength Dq (Dq/B), namely, type O–Cr–A [E(2 Eg )ZPL < E(4 T2g )ZPL] of relatively larger Dq values and type O–Cr–B [E(4 T2g )ZPL < E(2 Eg )ZPL] of relatively smaller Dq values. It should be noted that the data points for the La2ZnTiO6:Cr3+ oxide phosphor were neglected in the plots of Fig. 18a (also Figs. 19–21 below). The reason is that only this phosphor showed an extremely large Dq/B value of 2.95 (see Table III) compared to other Cr3+-activated oxide phosphors. The relatively large Dq/B value of this phosphor corresponds to its large E(4 T2g )ZPL value (Table III; see also Fig. 9).
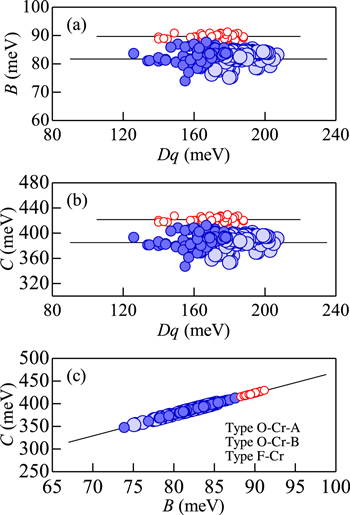
Figure 19. (a) B vs Dq, (b) C vs Dq, and (c) C vs B plots for the various Cr3+-activated oxide and fluoride phosphors. The numeric data plotted here are taken from Tables III and IV for the Cr3+-activated oxide phosphors and from Ref. 14 for the Cr3+-activated fluoride ones. The solid lines show the average values or least-squares-fit results (see text).
Download figure:
Standard image High-resolution image
Figure 20. Plots of E(2 Eg )ZPL vs (a) Dq, (b) Dq/B, and (c) B for the various Cr3+-activated oxide and fluoride phosphors. The numeric data plotted here are taken from Tables III and IV for the Cr3+-activated oxide phosphors and from Ref. 14 for the Cr3+-activated fluoride ones. The solid lines show the average values or least-squares-fit results (see text). The dashed line at Dq/B ∼ 2.14 in (b) represents the boundary of types O–Cr–A [E(2 Eg )ZPL < E(4 T2g )ZPL] and O–Cr–B (F–Cr) [E(4 T2g )ZPL < E(2 Eg )ZPL].
Download figure:
Standard image High-resolution image
Figure 21. Plots of E(4 T2g )ZPL vs (a) Dq, (b) Dq/B, and (c) B for the various Cr3+-activated oxide and fluoride phosphors. The numeric data plotted here are taken from Tables III and IV for the Cr3+-activated oxide phosphors and from Ref. 14 for the Cr3+-activated fluoride ones. The solid lines show the average values or least-squares-fit results (see text). The dashed line at Dq/B ∼ 2.14 in (b) represents the boundary of types O–Cr–A [E(2 Eg )ZPL < E(4 T2g )ZPL] and O–Cr–B (F–Cr) [E(4 T2g )ZPL < E(2 Eg )ZPL].
Download figure:
Standard image High-resolution imageFigure 19 shows the plots of (a) B vs Dq, (b) C vs Dq, and (c) C vs B for the Cr3+-activated oxide and fluoride phosphors. The numeric data were taken from Tables III and IV for the Cr3+-activated oxide phosphors and from a list in Ref. 14 for the Cr3+-activated fluoride phosphors. The Racah parameters plotted in Figs. 19a and 19b show no strong dependence on Dq, represented by B ∼ 81.7 meV and C ∼ 385 meV for the oxide phosphors; B ∼ 89.7 meV and C ∼ 422 meV for the fluoride phosphors. No large difference has also been found for phosphors of types O–Cr–A and O–Cr–B. In Fig. 19c, a value of C increases with increasing B at a slope of r = 4.7, in accord with its assumed ratio of Eq. 2.
The plots of E(2 Eg )ZPL vs (a) Dq, (b) Dq/B, and (c) B for the Cr3+-activated oxide and fluoride phosphors are shown in Figs. 20a–20c, respectively. The numeric data were taken from the same sources as in Fig. 19. The values of E(2 Eg )ZPL show no strong dependence on the horizontal axis quantity Dq, Dq/B, or B, represented approximately by E(2 Eg )ZPL ∼ 1.77 eV for the Cr3+-activated oxide phosphors and ∼1.91 eV for those of the fluoride phosphors. However, the oxide and fluoride phosphor plots in Fig. 20c show almost linear increase with increasing B given by [E(2 Eg )ZPL in eV; B in meV]

The same as in Fig. 20, but those for E(4 T2g )ZPL are shown in Fig. 21. One can find that the results shown in Fig. 21 are quite different from those in Fig. 20. The values of E(4 T2g )ZPL in Fig. 21a are given, as expected from Eq. 4, by

with E(4 T2g )ZPL in eV and Dq in meV, and in Fig. 21b by

with E(4 T2g )ZPL in eV, that are, regardless of type O–Cr–A, O–Cr–B, or F–Cr.
The values of E(2 Eg )ZPL in Fig. 21c tend to show no strong dependence on B, approximately given by E(4 T2g )ZPL ∼ 1.87 and ∼1.63 eV for the Cr3+-activated oxide phosphors of types O–Cr–A and O–Cr–B, respectively, and E(4 T2g )ZPL ∼ 1.71 eV for the Cr3+-activated fluoride ones. The results given in Figs. 19–21 can be used to predict an energy of the Cr3+ emission and/or to check a validity of the Racah parameters determined from a variety of Cr3+-activated oxide and fluoride phosphors.
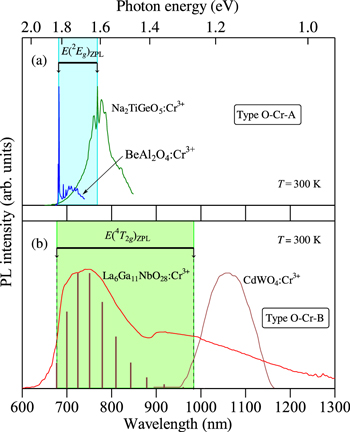
The room-temperature PL spectra observed for some Cr3+-activated oxide phosphors of (a) type O–Cr–A and (b) type O–Cr–B are shown in Fig. 22. The oxide phosphors plotted are selected to have the smallest and largest ZPL emission energies of E(2 Eg )ZPL in Table III and of E(4 T2g )ZPL in Table IV . Such phosphors are: Na2TiGeO5:Cr3+ (1.613 eV) (Ref. 99) and BeAl2O4:Cr3+ (∼1.82 eV) (Ref. 44) in Fig. 22a; CdWO4:Cr3+ (1.26 eV; T = 10 K) (Ref. 204) and La6Ga11NbO28:Cr3+ (1.83 eV) (Ref. 166) in Fig. 22b. It should be noted that the PL spectrum for the CdWO4:Cr3+ phosphor in Fig. 22a corresponds to that measured at 10 K. It is known that the E(4 T2g )ZPL value usually decreases with increasing T, but its degree of decrease is not so large.
Figure 22. Room-temperature PL spectra for some Cr3+-activated oxide phosphors of (a) type O–Cr–A and (b) type O–Cr–B. The oxide phosphors plotted here are selected to have the smallest and largest ZPL emission energies of E(2 Eg )ZPL in Table III and of E(4 T2g )ZPL in Table IV. These phosphors are: Na2TiGeO5:Cr3+ (1.613 eV) (Ref. 99) and BeAl2O4:Cr3+ (∼1.82 eV) (Ref. 44) in (a); CdWO4:Cr3+ (1.26 eV; T = 10 K) (Ref. 204) and La6Ga11NbO28:Cr3+ (1.83 eV) (Ref. 166) in (b).
Download figure:
Standard image High-resolution image
As evidenced from Fig. 22, the E(2 Eg )ZPL emission wavelength for phosphors of type O–Cr–A varies not so largely from ∼680 nm (BeAl2O4:Cr3+) to ∼770 nm (Na2TiGeO5:Cr3+). Contrarily, the E(4 T2g )ZPL emission wavelength of type O–Cr–B phosphors ranges widely from ∼675 nm (La6Ga11NbO28:Cr3+) to ∼985 nm (CdWO4:Cr3+). Note that the first and second broad luminescence bands observed in the La6Ga11NbO28:Cr3+ phosphor can be attributed to Cr3+ ions situated in the octahedral and tetrahedral sites of La6Ga11NbO28 lattice, respectively. The E(4 T2g )ZPL value for the Cr3+ ion in the tetrahedral site of this phosphor can also be determined using Eq. 9 to be given by ∼1.47 eV ( Table IV).
Conclusions
The Cr3+-activated oxide phosphors were discussed in detail from an aspect of spectroscopic point of view. The PL and PLE spectra were analyzed on the basis of the Franck−Condon principle with the CC model. The results suggested that the Cr3+-activated oxide phosphors can be classified into two groups: types O–Cr–A and O–Cr–B. Phosphors of type O–Cr–A are defined by an energy inequality relation of E(2 Eg )ZPL < E(4 T2g )ZPL, promising an observation of a series of the sharp emission peaks caused by the 2 Eg → 4 A2g transitions. Similarly, phosphors of type O–Cr–B can be defined by an energy inequality relation of E(4 T2g )ZPL < E(2 Eg )ZPL, promising an observation of a broad emission band attributed to the 4 T2g → 4 A2g transitions. A modified approach was proposed based on the general ligand field theory for obtaining reliable crystal-field, Dq, and Racah parameters, B and C, with drawing an attention to difficulty in exactly determining such very important phosphor parameters. The analysis results of the various Cr3+-activated oxide phosphors were summarized in graphical and tabular forms. The excited-state ZPL energies, such as E(2 Eg )ZPL, E(4 T2g )ZPL, and E(4 T1g,a)ZPL, in such oxide phosphors were also successfully determined and plotted against Dq in the Tanabe−Sugano energy-level diagram chart. The facts justify a validity of our proposed model and make possible to classify various 3d3-ion-activated oxide and fluoride phosphors into types of O–Cr–A [E(2 Eg )ZPL < E(4 T2g )ZPL] and O–Cr–B [E(4 T2g )ZPL < E(2 Eg )ZPL] for Cr3+-activated oxide phosphors, type of F–Cr [E(4 T2g )ZPL < E(2 Eg )ZPL] for Cr3+-activated fluoride phosphors, type of O–Mn [E(2 Eg )ZPL < E(4 T2g )ZPL] for Mn4+-activated oxide phosphors, and type of F–Mn [E(2 Eg )ZPL < E(4 T2g )ZPL] for Mn4+-activated fluoride phosphors.