
Abstract
Studying luminescence properties of various phosphor materials is not only of scientific interest, but also of technological importance. Temperature dependence of the non-rare-earth-doped fluoride and oxyfluoride phosphor properties are examined in this study. The representative non-rare-earth ion considered here is Mn4+ in which the luminous intra-3d3-shell transitions occur with the parity and spin-forbidden nature and, as a result, reflect a very long photoluminescence (PL) decay time in the milliseconds range (2Eg → 4T2g). Temperature dependence of the PL intensity IPL(T) is successfully explained by considering the phonon-assisted activation model together with the usual thermal quenching one. The dependence of the PL decay time τ(T) for some fluoride and oxyfluoride phosphors are also analyzed and compared with those of IPL(T). The proposed analysis model can be used to interpret the temperature-dependent luminescence intensities and decay times for a variety of non-rare-ion (Mn4+, Mn2+, Cr3+, etc.)-doped phosphors regardless of the host materials, fluoride, oxide, oxyfluoride, or others.
Export citation and abstract BibTeX RIS

This is an open access article distributed under the terms of the Creative Commons Attribution 4.0 License (CC BY, http://creativecommons.org/licenses/by/4.0/), which permits unrestricted reuse of the work in any medium, provided the original work is properly cited.
From a view point of the activator ions, phosphors can be largely classified into non-rare-earth and rare-earth-doped phosphors. The "rare-earth" lanthanide ions either in their divalent or trivalent charge state form a very important class of luminescence activators in various host materials. 1 Some "non-rare-earth" quadrivalent manganese (Mn4+) and trivalent chromium (Cr3+) ions have also been successfully used as the optical activators in a large number of crystalline phosphors and laser materials. Indeed, ruby or Cr3+-doped sapphire (α-Al2O3:Cr3+) was the first demonstrated crystalline laser in 1960. 2
Narrow band red emitting phosphors with a high luminous efficacy are a major requirement for warm white-light-emitting diode (w-LED) applications using an UV/blue-chip InGaN device. Searching for new red-emitting phosphors or those containing a narrow red emission phosphor component is an important approach to the realization of such warm w-LED applications. 3,4 Considering an application of phosphors, thermal stability of the light emission intensities and related decay times is of crucial importance and, therefore, there have been investigated such issues on various fluoride and oxide phosphors doped with non-rare-earth ions like Mn4+ and Cr3+. 5–10
In the present article, we report our analysis results on the temperature dependence of the luminescence intensity and decay time for the Mn4+-activated fluoride and oxyfluoride phosphors. Recently, there have been reported a lot of papers that reveal an anomalous increase in the integrated photoluminescence (PL) intensity IPL(T) with increasing T. For example, an enhanced value of IPL(T)/IPL(T → 0 K) ∼ 8 has been reported at T ∼ 430 K for the CsMoO2F3:Mn4+ oxyfluoride phosphor. 11 The present study will be mainly focused on an explanation of such anomalous IPL(T) characteristics observed in the various Mn4+-activated fluoride and oxyfluoride phosphors.
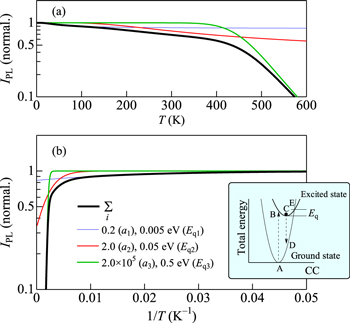
Figure 1. Theoretical IPL vs T curves calculated using Eq. 4 with different ai and Eqi values (i = 1 − 3). The sum of these components is shown by the black bold line in each figure. The inset schematically shows the thermal quenching process demonstrating a concept of "Eq" on the CC model.
Download figure:
Standard image High-resolution image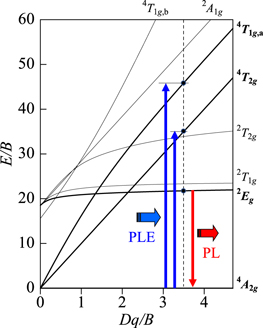
Figure 2. (a) Tanabe–Sugano energy-level diagram for a 3d3 system in octahedral symmetry.
Download figure:
Standard image High-resolution image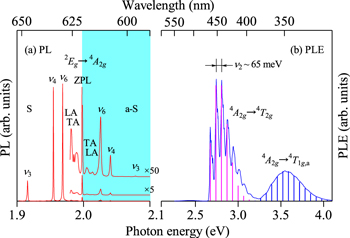
Figure 3. PL and PLE spectra for the K2SiF6:Mn4+ phosphor measured at T = 20 K. The experimental data are taken from Ref. 16 The vertical bars on each PLE spectrum represent the modeled PLE spectrum calculated using Eq. 14 (see text). S = Stokes; a−S = anti-Stokes.
Download figure:
Standard image High-resolution image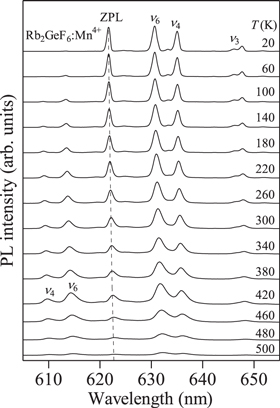
Figure 4. Temperature dependence of the PL spectra for the Rb2GeF6:Mn4+ fluoride phosphor measured between T = 20 and 500 K in 40 K increments (Ref. 19).
Download figure:
Standard image High-resolution image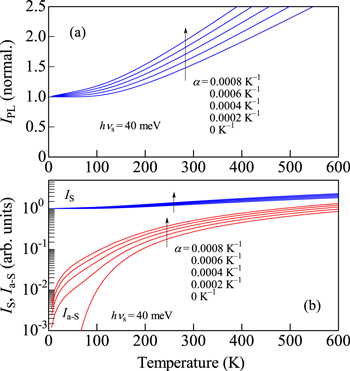
Figure 5. Theoretical IPL(T) (a), IS(T) and Ia−S(T) curves (b) calculated using Eq. 11 (Eqs. 7 and 8) with α as a parameter varying from 0 to 8 × 10⁻⁴ K−1 (hνs = 40 meV).
Download figure:
Standard image High-resolution image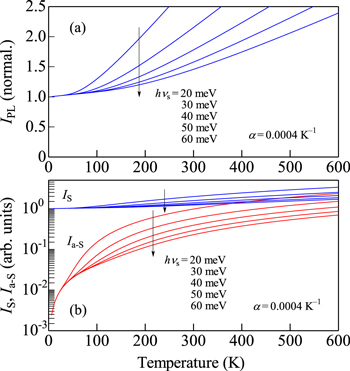
Figure 6. Theoretical IPL(T) (a), IS(T) and Ia−S(T) curves (b) calculated using Eq. 11 (Eqs. 7 and 8) with hνs as a parameter varying from 20 to 60 meV (α = 4 × 10⁻⁴ K−1).
Download figure:
Standard image High-resolution imageMany experimental IPL vs T data considered in the present study were taken from our previous results. Note that many authors usually measured IPL(T) characteristics from room temperature up to higher temperatures at which thermal quenching to be dominated. This is because in w-LED devices the temperature of phosphor coated on a LED chip easily reaches 450 K due to the Stokes loss process and, therefore, it is important to know a temperature at which thermal quenching dominates from a practical point of view. 8 However, an anomalous IPL(T) behavior of interest here usually occurs at very lower temperatures than 300 K (see, e.g., Fig. 7 below). Almost all our previous studies measured the IPL(T) data from cryogenic (∼20 K) to higher temperatures than 300 K. Temperature dependences of the PL decay time τ(T) for some fluoride and oxyfluoride phosphors are also analyzed and compared with IPL(T) characteristics.
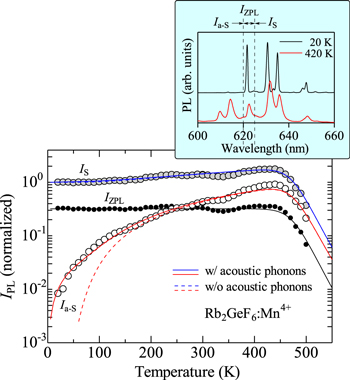
Figure 7. Integrated PL intensities for the Stokes and anti-Stokes emission components calculated using Eq. 7 (IS) and 8 (Ia−S) with and without considering the acoustic phonon contribution, respectively, together with that for the ZPL emission intensity (IZPL), for the Rb2GeF6:Mn4+ phosphor. The experimental data are taken from Ref. 19 The inset also shows the PL spectra measured at T = 20 and 420 K (see also Fig. 4). Note that the solid and dashed lines for the IS component nearly completely coincide with each other.
Download figure:
Standard image High-resolution imageTheoretical Model
Thermal quenching model
The configurational coordinate (CC) model can be used to explain the optical properties of solids, particularly the effects of lattice vibrations at various temperatures. 12 The inset of Fig. 1 shows a schematic illustration of the CC model. This simplified model can successfully explain a number of optical spectra, for example, the Stokes shift, the temperature dependence of the spectral width of absorption or emission, and the thermal quenching of luminescence intensity.
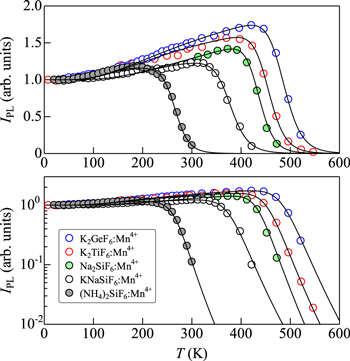
Figure 8. IPL vs T plots for some Mn4+-activated fluoride phosphors of type I2−IV−F6 hosts, K2GeF6:Mn4+, 20,21 K2TiF6:Mn4+, 8 Na2SiF6:Mn4+, 22,23 KNaSiF6:Mn4+, 24,25 and (NH4)2SiF6:Mn4+. 26 The solid lines show the theoretical IPL vs T curves calculated using Eq. 12. The fit-determined parameters are listed in Table II.
Download figure:
Standard image High-resolution image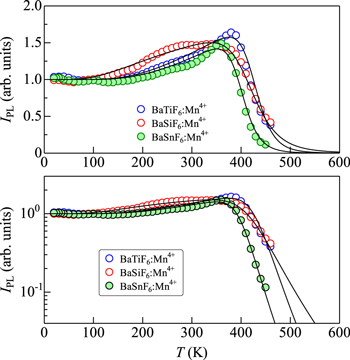
Figure 9. IPL vs T plots for some Mn4+-activated fluoride phosphors of type II−IV−F6 hosts, BaTiF6:Mn4+, 27 BaSiF6:Mn4+, 28 and BaSnF6:Mn4+. 29 The solid lines show the theoretical IPL vs T curves calculated using Eq. 12. The fit-determined parameters are listed in Table II.
Download figure:
Standard image High-resolution image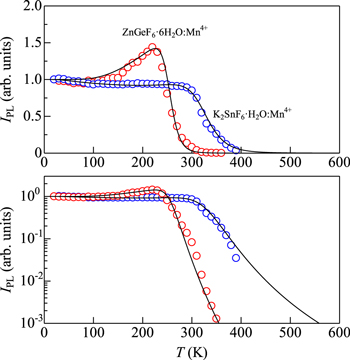
Figure 10. IPL vs T plots for some Mn4+-activated fluoric hydrate phosphors of types I2−IV−F6 [K2SnF6·H2O:Mn4+ (Refs. 30 and 31)] and II−IV−F6 [ZnGeF6·6H2O:Mn4+ (Ref. 32)]. The solid lines show the theoretical IPL vs T curves calculated using Eq. 12. The fit-determined parameters are listed in Table II.
Download figure:
Standard image High-resolution image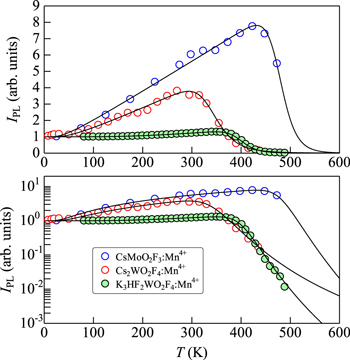
Figure 11. IPL vs T plots for some Mn4+-activated oxyfluoride phosphors, CsMoO2F3:Mn4+, 11 Cs2WO2F4:Mn4+, 36 and K3HF2WO2F4:Mn4+. 37 The solid lines show the theoretical IPL vs T curves calculated using Eq. 12. The fit-determined parameters are listed in Table II.
Download figure:
Standard image High-resolution imageIn the inset of Fig. 1, an optical absorption proceeds from the equilibrium position of the ground state A to the excited state B (A → B). The lifetime for an excited electron to lose energy by interacting with the lattice vibrations is in the range of picoseconds, while the lifetime for light emission in Mn4+ is at most in the range of milliseconds (see Figure 12 below). As a consequence, the excited electron in B relaxes to the equilibrium position C before it emits light. The electrons then result in light emission via the radiative transitions, C → D, and subsequent relaxation of D → A for completing its cycle.
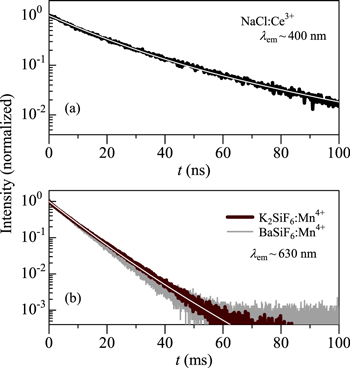
Figure 12. Room-temperature PL decay curves (a) for NaCl:Ce3+ (Ref. 39) and (b) K2SiF6:Mn+ (Ref. 24) and BaSiF6:Mn4+. 28 The white solid lines in (a) and (b) show the results calculated using Eq. 16 (see text). Note that the Ce3+ and Mn4+ emissions are caused by the parity-allowed and -forbidden transitions, respectively.
Download figure:
Standard image High-resolution imageIf the two CC curves intersect with each other, an exited electron can beyond its crossing point E with assistance of thermal energy and then nonradiatively return to the ground state A via the E → A transition process. Here, Eq is called thermal quenching (or activation) energy. Let us assume a nonradiative transition probability per unit time with the thermal quenching energy Eq written as

where kB is the Boltzmann constant, s is a product of the transition probability between the ground and excited states and a frequency, with which the excited state exceeds the intersection E in the inset of Fig. 1. The product s can be regarded as a constant with lattice temperature.
Let W being radiative transition probability, the luminescence efficiency η can be written as

From Eq. 2, one obtains the temperature-dependent luminescence intensity, which is limited by the thermal quenching process, as

where I0 is a constant proportional to W/(W + Wn) and a ≡ s/W.
It should be noted that the above-mentioned one-dimensional CC model gives only a simple quantitative explanation of the thermal quenching process. An actual phosphor may have various thermal quenching paths including an intrinsic quenching path shown in the inset of Fig. 1b and any lattice imperfection-induced quenching paths and, therefore, one must take into consideration such various quenching paths. We finally obtain

where I0 represents the luminescence intensity in the limit T → 0 K and Eqi is the quenching energy of path i.
Figure 1 shows, as an example, the simulation result of Eq. 4 with considering quenching components of i = 1 − 3, together with the sum of all these components (black bold line). One can understand that the thermal quenching becomes more remarkable at higher temperatures with larger Eq value.
Phonon-assisted activation process
(a) Theoretical basis
In principle, the phonon-assisted activation model can be applied to the luminescence phenomena caused by the dipole forbidden transitions, especially for the intra-3d-orbital transitions in ions, such as Mn4+, Cr3+, and Mn2+. Figure 2 shows the Tanabe−Sugano energy-level diagram for the 3d3 configuration of Mn4+. The intra-3d3-shell transitions in Mn4+ are caused by the parity-forbidden transitions. Therefore, the luminescence intensity due to such parity-forbidden transitions, 2 Eg → 4 T2g , should be very weaker than the usual parity-allowed transitions. However, one can measure relatively sharp, strong, and efficient emission peaks caused by an activation due to the local vibration modes of the Mn4+-related octahedral complexes.
The temperature dependence of the PL intensity can now be written as
where c is a proportionality constant, ∣〈i∣Mj ∣f〉∣ is an optical transition operator (i = initial state; f = final state; Mj = momentum matrix element), EZPL is the ZPL emission energy, and νj is the lattice or local vibrational frequency in a octahedral complex (j = vibration mode). The upper and lower signs in Eq. 5 correspond to the Stokes and anti-Stokes processes, respectively, and nj is the Bose–Einstein occupation number given by

The Stokes and anti-Stokes emission components IS and Ia−S can be given by 13,14


Not only the optical phonons but also the acoustic phonons may act an important part in the phonon-assisted luminescence activation process. Therefore, we added an acoustic phonon term, αT, to Eqs. 7 and 8. This term is understood to be proportional to T. 15 Assuming αT = 0, for simplicity, the anti-Stokes to Stokes ratio can be given from Eqs. 7 and 8 by 13,14

Expressions 5, 7, and 8 promise that the total luminescence intensity IPL(T) is written as (Ref. 14)
with an assumption of EZPL ± hνj ∼ EZPL. Simplification of Eq. 10 gives

where νs is the appropriately weighted average frequency of the various lattice vibrations in the Mn4+-activated phosphors. In Eq. 11, we included the IZPL term into the Stokes component one. This is because the intensity of the IZPL term is usually much smaller than that of the Stokes component one (IS) and, moreover, both terms exhibit no strong temperature dependence below ∼400 K (see, e.g., Fig. 7 below).
Combining Eqs. 4 and 11, we finally obtain an expression for the temperature dependence of the Mn4+ emission intensity in the various host materials, like fluorides, oxides, and oxyfluorides, by
It should be noted that the first two terms in the square bracket of the right-hand side of Eq. 12 can be expressed by the well-known hyperbolic cotangent function in the manner
(b) Typical examples of emission and absorption spectra in Mn4+-activated phosphors
Figure 3 shows the specral features of the emission and excitation transitions in K2SiF6: Mn4+ at T = 20 K. The experimental data are taken from Ref. 16 The vertical bars on the PL excitation (PLE) spectrum show the analysis results using the Franck−Condon principle with the CC model given by the following expression: 14,17
with

Here, EZPL is the ZPL transition energy in the PLE process, σex is the broadening energy of each Gaussian component,  represents the ZPL excitation intensity, S is the mean local vibration number (Huang−Rhys factor) defined by the Poisson statistics (Eq. 15)and hνp,ex is the lattice vibration energy involved in the excitation transition process.
The vertical bars in the PLE spectrum are obtained by fitting the experimental data with assuming the two excitation transition bands, 4 A2g → 4 T2g and 4 A2g → 4 T1g,a. The fit-determined parameters are E(4 T2g )ZPL = 2.676 eV (S = 2) and E(4 T1g,a)ZPL = 3.20 eV (S = 6) with hνp,ex = 65 meV. The value of hνp,ex = 65 meV corresponds to that of the ν2 vibration mode. Table I summarizes the lattice phonon energies (ν1 − ν6) for the molecule in the fluoride crystal. 17,18
Table I. Lattice vibronic energies  ν1 − ν6, of molecules in Mn4+-doped fluoride crystals at 300 K. R = Raman active; IR = IR active.
| Mode | Polarization | Activity | Energy (meV) |
|---|---|---|---|
| ν1 | a1g | R | ∼74 a) |
| ν2 | e1g | R | ∼63 a) |
| ∼65 b) | |||
| ν3 | t1u | IR | ∼81 a) |
| ν4 | t1u | IR | ∼44 a) |
| ν5 | t2g | R | ∼38 a) |
| ν6 | t2u | Silent | ∼30 a) |
The ZPL emission energy E(2 Eg )ZPL (2 Eg → 4 A2g ) can be easily determined from a weak, but clear peak in the PL spectrum at ∼1.998 eV. Because the PL spectrum in Fig. 3a was measured at cryogenic temperature (T = 20 K), no strong anti-Stokes emission peaks can be observed in its spectrum. The dominant PL peaks are caused by the activation due to the ν3, ν4, and ν6 local vibration modes (Table I). One can also find the PL peaks due to the lattice acoustic modes (TA = transverse acoustic; LA = longitudinal acoustic) observed in the region near the ZPL emission peak.
Experimental Data Analysis
Fluoride phosphors
(a) Phosphor nonhydrates
Figure 4 shows the temperature dependence of the PL spectra of the Rb2GeF6:Mn4+ phosphor measured between T = 20 and 500 K in 40 K increments. 19 A gradual increase in the anti-Stokes emission intensity (λ < 622 nm) with increasing T has been observed at T up to ∼420 K. Contrarily, no strong change in the Stokes emission intensity can be seen from 20 up 420 K. Above 420 K, both the Stokes and anti-Stokes emission intensities show a decrease with increasing T, which is caused by the thermal quenching.
Let us show in Figs. 5 and 6 the theoretical IPL vs T curves, together with those for the Stokes (IS) and anti-Stokes (Ia−S) intensities, calculated using Eq. 11 (Eqs. 7 and 8) with hνs = 40 meV and α as a parameter varying from 0 to 8 × 10⁻⁴ K−1 (Fig. 5) and with α = 4 × 10⁻⁴ K−1 and hνs as a parameter varying from 20 to 60 meV (Fig. 6). It is understood that the Ia−S component depends very sensitively on hνs and α.
Figure 7 shows the integrated PL intensities of the Stokes (IS) and anti-Stokes emission components (Ia−S) as a function of T, together with that of the ZPL emission intensity (IZPL), for the Rb2GeF6:Mn4+ phosphor (see also Fig. 4). The IZPL values were obtained by integrating PL spectra at wavelengths between λ = 620−625 nm. As expected, no strong temperature dependence was observed on the IZPL intensity below ∼450 K. The gradual decreases in the IS, Ia−S, and IZPL vs T plots at T ≥ 450 K come from the thermal quenching (see Eq in Eq. 4).
The solid and dashed lines in Fig. 7 (IS, Ia−S) represent the theoretical curves of the Stokes and anti-Stokes emission intensities calculated using Eq. 7 (IS) and 8 (Ia−S) with and without considering the acoustic phonon contribution, respectively. The thermal quenching parameters used in these calculations are as follows: a1 = 3.5 × 10¹¹ and Eq1 = 1.1 eV (i = 1 only). An excellent agreement can be achieved between the experimental data and theoretical calculations. An anomalous increase in the integrated luminescence intensity with increasing T up to ∼450 K can be understood to be due to the breakdown of the parity and spin forbidden transitions by the effects of the optical/acoustic phonon vibrations (Eq. 11).
Figure 8 shows the IPL(T) data for some Mn4+-activated fluoride phosphors of type I2−IV−F6 host: K2GeF6:Mn4+, 20,21 K2TiF6:Mn4+, 8 Na2SiF6:Mn4+, 22,23 KNaSiF6:Mn4+, 24,25 and (NH4)2SiF6:Mn4+. 26 The solid lines show the theoretical IPL vs T curves calculated using Eq. 12. The fit-determined parameters are summarized in Table II. One can see that all these phosphors show an increase in the integrated PL intensity (IPL) with increasing T. As in Fig. 7, such an increase in IPL with increasing T can be well explained by gaining the optical transition probability with the lattice vibrations of the "gerade" modes (ν3, ν4, and ν6; see also Fig. 4) The IPL value observed at T ∼ 420 K for the K2GeF6:Mn4+ phosphor is about 1.8 times larger than that at T → 0 K. The (NH4)2SiF6:Mn4+ phosphor also shows an increase in IPL with increasing T, but its degree of increase is smaller than that observed in the K2GeF6:Mn4+ phosphor [IPL(T ∼ 190 K)/IPL(T → 0 K) ∼ 1.2].
Table II. Fitting parameters used for IPL(T) and τ(T) in Eqs. 12 and 18, respectively. Since the acoustic phonon term of αT becomes remarkable only for the anti-Stokes term and at cryogenic temperatures, its term has been neglected in Eq. 12. (τ0 in units of ms).
| Phosphor | I0/τ0 | hνs (meV) | aq1 | Eq1 (eV) | aq2 | Eq2 (eV) | Remark |
|---|---|---|---|---|---|---|---|
| K2GeF6:Mn4+ | 1.0 | 35 | 8.0 × 10¹¹ | 1.15 | IPL (Fig. 8) | ||
| K2TiF6:Mn4+ | 1.0 | 36 | 1.5 × 10¹² | 1.10 | 5.0 × 10⁻¹ | 0.07 | IPL (Fig. 8) |
| Na2SiF6:Mn4+ | 1.0 | 50 | 5.0 × 10¹² | 1.10 | IPL (Fig. 8) | ||
| KNaSiF6:Mn4+ | 1.0 | 50 | 1.0 × 10¹⁰ | 0.75 | 2.5 × 101 | 0.16 | IPL (Fig. 8) |
| (NH4)2SiF6:Mn4+ | 1.0 | 35 | 3.0 × 10⁹ | 0.50 | 3.0 × 101 | 0.10 | IPL (Fig. 8) |
| BaTiF6:Mn4+ | 1.0 | 70 | 3.8 × 10¹⁰ | 0.90 | IPL (Fig. 9) | ||
| BaSiF6:Mn4+ | 1.0 | 35 | 1.5 × 10⁷ | 0.60 | 5.5 × 10⁻¹ | 0.07 | IPL (Fig. 9) |
| BaSnF6:Mn4+ | 1.0 | 75 | 1.3 × 10¹¹ | 0.88 | IPL (Fig. 9) | ||
| K2SnF6·H2O:Mn4+ | 1.0 | 110 | 5.0 × 10⁷ | 0.50 | 1.7 × 10⁻¹ | 0.01 | IPL (Fig. 10) |
| ZnGeF6·6H2O:Mn4+ | 1.0 | 48 | 7.0 × 10¹¹ | 0.60 | IPL (Fig. 10) | ||
| CsMoO2F3:Mn4+ | 1.0 | 9.3 | 4.5 × 10¹³ | 1.30 | IPL (Fig. 11) | ||
| Cs2WO2F4:Mn4+ | 1.0 | 13 | 2.0 × 10⁷ | 0.50 | IPL (Fig. 11) | ||
| K3HF2WO2F4:Mn4+ | 1.0 | 59 | 2.0 × 10¹¹ | 0.90 | IPL (Figs. 11, 15) | ||
| 8.2 | 3.0 × 10⁷ | 0.55 | 3.0 | 0.033 | τ (Fig. 15) | ||
| K2SiF6:Mn4+ | 1.0 | 65 | 1.0 × 10⁸ | 0.70 | IPL (Fig. 13) | ||
| 15.5 | 2.0 × 10⁴ | 0.30 | 2.5 | 0.025 | τ (Fig. 13) | ||
| K2TiF6:Mn4+ | 1.0 | 20 | 7.0 × 10⁹ | 0.85 | 1.7 | 0.02 | IPL (Fig. 14) |
| 12.2 | 5.0 × 10⁶ | 0.55 | 5.0 | 0.04 | τ (Fig. 14) |
The thermal quenching becomes remarkable at T above ∼200 K for (NH4)2SiF6:Mn4+. The corresponding quenching energy determined here is Eq1 ∼ 0.50 eV for (NH4)2SiF6:Mn4+ (Table II). This is in accord with the fact that the host material of lower melting point (Tmelt) has the smaller quenching energy of Eq1 [Tmelt ∼ 160 °C (∼433 K) and Eq1 ∼ 0.50 eV for (NH4)2SiF6:Mn4+]. The smaller quenching energy of the lower melting-point host material may be correlated to a collapse of its rigid lattice network system at high lattice temperatures.
The IPL vs T plots for some Mn4+-activated fluoride phosphors of type II−IV−F6 host, BaTiF6:Mn4+, 27 BaSiF6:Mn4+, 28 and BaSnF6:Mn4+, 29 are shown in Fig. 9. The theoretical IPL(T) data using Eq. 12 are shown by the solid lines. The fit-determined parameters are listed in Table II. As in Fig. 8, the peculiar IPL vs T plots can be well explained by considering the theoretical model of Eq. 12. The largest increase of IPL with increasing T observed in Fig. 9 is IPL(T ∼ 380 K)/IPL(T → 0 K) ∼ 1.6 (BaTiF6:Mn4+).
(b) Phosphor hydrates
The host materials of K2SnF6·H2O:Mn4+ and ZnGeF6·6H2O:Mn4+ phosphors are of types I2−IV−F6 and II−IV−F6, respectively. Let us show in Fig. 10 the IPL vs T data for the K2SnF6·H2O:Mn4+ (Refs. 30 and 31) and ZnGeF6·6H2O:Mn4+ phosphors, 32 together with their theoretical IPL(T) curves calculated using Eq. 12. A very weak increase in IPL with increasing T can be observed in the K2SnF6·H2O:Mn4+ phosphor at T ∼ 100 − 280 K, which reflects a large value of hνs = 110 meV required in Eqs. 11–13 (see Table II). An anomalous increase of IPL(T) in the ZnGeF6·6H2O:Mn4+ phosphor is also observed with a value of IPL(T ∼ 220 K)/IPL(T → 0 K) ∼ 1.4 (Fig. 10). An occurrence of the thermal quenching at relatively low temperatures below 300 K has been observed in the ZnGeF6·6H2O:Mn4+ phosphor and also in similar hydrate phosphors like ZnSiF6·6H2O:Mn4+, 33 ZnSnF6·6H2O:Mn4+, 34 and ZnTiF6·6H2O:Mn4+. 35 As in the case of (NH4)2SiF6:Mn4+ (Fig. 8), a family of Zn−IV−F6·6H2O host materials has a relatively low melting/decomposition temperature, e.g., Tmelt/decom ∼ 120 °C for ZnSiF6·6H2O.
Oxyfluoride phosphors
Figure 11 shows the IPL vs T plots for some Mn4+-activated oxyfluoride phosphors: CsMoO2F3:Mn4+, 11 Cs2WO2F4:Mn4+, 36 and K3HF2WO2F4:Mn4+. 37 The solid lines show the theoretical IPL vs T data calculated using Eq. 12. The fit-determined parameters are listed in Table II. An extremely large increase in IPL(T) can be observed in the CsMoO2F3:Mn4+ phosphor above T ∼ 20 K, peaking at 430 K with IPL(T ∼ 430 K)/IPL(T → 0 K) ∼ 8. Such an anomalous increase in IPL(T) can be successfully explained by Eq. 12. A weak increase of IPL with increasing T has also been observed in the K3HF2WO2F4:Mn4+ phosphor (Fig. 11).
The extremely large increase in IPL(T) in the CsMoO2F3:Mn4+ phosphor may come from its complex crystal structure and, therefore, its complex phonon dispersion curve nature. Note that phonons, representing lattice vibrations at a frequency of ωq, have an energy ħωq, where ħ is the reduced Planck's constant, and have a momentum ħq . In the primitive cell, if there are N different types of atoms either of differing mass or ordering in space, 3 N vibration modes will result. Three of these branches, namely the acoustic branches, will disappear at the zone center (Γ). The remaining 3 N − 3 branches will be optical branches. As mentioned in " Phonon-assisted activation process ," the Mn4+ luminescence is caused by the party and spin forbidden transitions (2 Eg → 4 A2g ), but gained by the effects of the optical/acoustic phonon vibrations. The anomalously large increase in IPL(T) with increasing T may thus come from a more complex crystal structure (or, in other words, from more complex phonon dispersion relations) of some oxyfluoride phosphors like CsMoO2F3:Mn4+ and Cs2WO2F4:Mn4+. In fact, no such remarkable increase in IPL(T) has been observed in phosphors of more simple crystal structures like I2−IV−F6:Mn4+ in Figs. 7 and 8. Further study needs to make clear this problem.
It should be noted that Cr3+ and V2+ ions have the same electronic configuration, 3d3, as Mn4+. Therefore, the proposed analysis model can be used to interpret the temperature-dependent luminescence intensities of not only the Mn4+-activated phosphors, but also of other 3d3-activated ones (Cr3+, V2+), regardless of fluoride, oxyfluoride, or other host materials like oxides. 23
Temperature Dependence of Luminescence Decay Time
Theoretical basis
The PL decay curve as a function of time t usually shows an exponential decay characteristic expressed as 38

with  The average decay time τav can also be defined by

Figure 12 shows the room-temperature PL decay curves (a) for NaCl:Ce3+ (Ref. 39) and (b) K2SiF6:Mn+ (Ref. 24) and BaSiF6:Mn4+. 28 The Ce3+-emission decay time is usually 10−7 to 10−8 s. Such a very fast decay time of Ce3+ comes from the fact that the 5d → 4 f transitions in Ce3+ are both parity and spin allowed. Thus, the horizontal axis in Fig. 12a corresponds to the "nanoseconds (ns)" range. On the other hand, the parity and spin-forbidden transitions in Mn4+ usually promises a very slow decay time, in the "milliseconds (ms)" range (see Fig. 12b).
The solid lines in Fig. 12 show the results calculated using Eq. 16 with a1 = 0.79, τ1 = 15 ns, a2 = 0.21, τ1 = 40 ns (τav = 25 ns) for the NaCl:Ce3+ phosphor and with a1 = 0.82, τ1 = 6.5 ms, a2 = 0.18, and τ2 = 10.0 ms (ττav = 7.4 ms) for the K2SiF6:Mn4+ phosphor. An excellent agreement of the experimental decay curves with Eq. 16 can be achieved in Fig. 12.
As we will see next, the decay time τ vs T curve can be fit with the usual thermal quenching model given by

The luminescence decay time can also be written, in principle, as

where τE and τT represent the radiative lifetimes of the lower and higher-lying states, respectively. For example, such states in all Mn4+-activated fluoride phosphors correspond to 2 Eg and 4 T2g , respectively, 14,17,40 where τE is long in comparison to τT because the doublet–quartet transitions (2 Eg → 4 A2g ) are spin forbidden. ΔE is the difference in energy between the higher and lower-lying states. From Eq. 19, we obtain

Comparing Eq. 18 with Eq. 20, we obtain τ0 ≡ τE, a ≡ τE/τT, and Eq ≡ ΔE.
Note that Eq. 18 has the exactly same form as Eq. 4 used in the analysis of IPL(T). This is not surprising because in the Mn4+-activated fluoride phosphors the stronger the luminescence intensity IPL, the longer the decay time τ. In the following, we make direct comparison of the experimental IPL(T) and τ(T) data for some Mn4+-activated fluoride and oxyfluoride phosphors.
IPL(T) vs τ(T) characteristics
Figure 13 shows the IPL(T) and τ(T) data for the K2SiF6:Mn4+ fluoride phosphor. The experimental data are taken from Ref. 41 As in Figs. 7−11, the IPL vs T data in Fig. 13 exhibit an enhancement in the PL intensity with increasing T and show a maximum at ∼360 K, which can be successfully interpreted by the phonon-assisted activation model of Eq. 13. It should be noted that no such enhancement can be found in the τ(T) data. The solid lines in Fig. 13 are calculated using Eqs. 12 and 18 for the IPL(T) and τ(T) data, respectively, and an excellent agreement between the experimental and theoretical curves can be found over the entire temperature range.
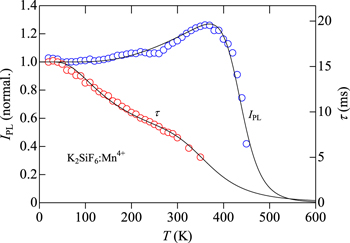
Figure 13. Plots of IPL(T) and τ(T) for the K2SiF6:Mn4+ fluoride phosphor. The solid lines represent the results calculated using Eqs. 12 and 18 (see Table II). The experimental data are taken from Ref. 41.
Download figure:
Standard image High-resolution imageThe fit-determined parameter values for both IPL(T) and τ(T) are listed in Table II. The thermal quenching energy Eq1 ∼ 0.7 eV for IPL(T) is considerably larger than that for τ(T) ∼ 0.3 eV, indicating nonequivalent loss or relaxation pathways occurring between in the radiative luminescence and decay processes in the K2SiF6:Mn4+ phosphor. To achieve an excellent fit, the τ(T) data also required the second thermal quenching energy of Eq2 ∼ 25 meV.
As in Fig. 13, the IPL vs T plots for the K2TiF6:Mn4+ fluoride phosphor in Fig. 14 exhibit an enhancement in the IPL value and show its maximum at ∼380 K, where the experimental IPL(T) and τ(T) data are taken from Ref. 8 An increased PL value of IPL(T ∼ 380 K)/IPL(T → 0 K) ∼ 1.6 observed in the K2TiF6:Mn4+ phosphor is slightly larger than that in the K2SiF6:Mn4+ phosphor, IPL(T ∼ 360 K)/IPL(T → 0 K) ∼ 1.3 (see Fig. 13).
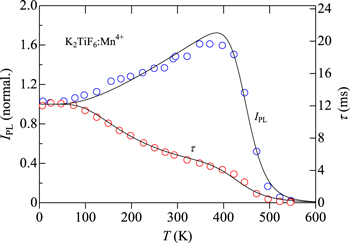
Figure 14. Plots of IPL(T) and τ(T) for the K2TiF6:Mn4+ fluoride phosphor. The solid lines represent the results calculated using Eqs. 12 and 18 (see Table II). The experimental data are taken from Ref. 8.
Download figure:
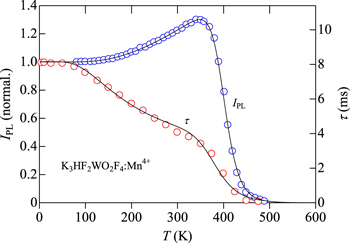
Standard image High-resolution imageWe show in Fig. 15 the IPL and τ vs T plots for the K3HF2WO2F4:Mn4+ oxyfluoride phosphor obtained from Ref. 37. Note that the IPL(T) data shown in Fig. 15 are the same as those in Fig. 11. All the theoretical fits of the IPL(T) and τ(T) curves using Eqs. 12 and 18 in Figs. 13−15 resulted in the fact that the thermal quenching energy Eq1 for the τ(T) curve is smaller than that for the IPL(T) curve (Table II). Moreover, the τ(T) curves always required the second thermal quenching energy in a few tens of millielectron volts, whereas in the case of the IPL(T) curves (Figs. 8−11, 13−15) it is materials dependent (for example, no requirement of it in the K2SiF6:Mn4+ phosphor, but requirement in the K2TiF6:Mn4+ phosphor case—see Table II).
Figure 15. Plots of IPL(T) and τ(T) for the K3HF2WO2F4:Mn4+ oxyfluoride phosphor. The solid lines represent the results calculated using Eqs. 12 and 18 (see Table II). The experimental data are taken from Ref. 37.
Download figure:
Standard image High-resolution image
Finally, we can find that a maximum value of the Mn4+ emission intensity ratio of IPL(T)/IPL(T → 0 K) is strongly dependent on a kind of individual host materials, regardless of a kind of materials group, e.g., a fluoride or an oxyfluoride group. This can be understood from the results presented in Figs. 8−11. Although an extremely large ratio of ≥4 can be found in some "oxyfluoride" phosphors (see Fig. 11), a small value of ∼1.3 can also be observed in the K3HF2WO2F4:Mn4+ "oxyfluoride" phosphor (Figs. 11 and 15). It must be noted that PL intensity of a solid is usually strongly dependent on a degree of its crystalline quality. Therefore, the IPL(T)/IPL(T → 0 K) value should be not an "intrinsic" quantity and depend on a degree of crystalline quality of each phosphor (i.e., a higher crystalline-quality phosphor may have larger IPL(T)/IPL(T → 0 K) value).
Conclusions
In some practical applications the thermal stability of the various phosphor materials is of crucial importance. The temperature dependence of the non-rare-earth (Mn4+)-doped fluoride and oxyfluoride phosphor properties was examined in the present study. Some phosphors clearly showed the unique temperature dependence of the luminescence intensity IPL(T), which was explained by an increase of IPL with increasing T from the low T region (≥20 K) up to the start of the usual thermal quenching occurrence. Such peculiar temperature dependence of IPL was successfully interpreted by considering the phonon-assisted luminescence activation model for the intra-3d3-shell transitions (2 Eg → 4 T2g ), which are limited to the parity and spin-forbidden transition process. Because the luminescence intensity can be gained by the lattice phonons, its intensity is strongly related to the optical phonon occupation number defined by the Bose−Einstein statistics for the optical phonons or by a quantity proportional to the lattice thermal energy kB T for the acoustic phonons. The analyses showed good agreement with the experimental IPL(T) data over the entire temperature range by considering its model together with the conventional thermal quenching model. Temperature dependence of τ(T) was also examined and successfully explained by considering only the thermal quenching model. The proposed analysis model can be used to predict the temperature-dependent luminescence intensities and decay times for a variety of Mn4+ (Mn2+, and Cr3+)-activated phosphors with basically parity-forbidden transitions.