

Abstract
Sprays are typically characterised by providing local drop size and velocity distributions and number density. The present work examines the possibility of obtaining such information using backlight photography, whereby two cameras are employed and the size and position of each imaged drop is obtained using a depth from defocus approach. A simple algorithm for estimating size and position from the two camera images is introduced and the sensitivity of this algorithm to various system parameters is investigated with simulations using synthetic images, measurements from a calibration facility, and measurements conducted in a sparse spray. Comparison measurements using the analysis of focused images are provided.
Export citation and abstract BibTeX RIS

Original content from this work may be used under the terms of the Creative Commons Attribution 4.0 license. Any further distribution of this work must maintain attribution to the author(s) and the title of the work, journal citation and DOI.
1. Introduction
Optical characterization of particle-laden flows is attractive because of its inherent non-intrusiveness; however, fundamental limitations exist whenever the number density of the dispersed phase increases to an extent where obscuration becomes significant. For sparsely dispersed systems, numerous techniques exist, either pointwise, planar or volume based, for measuring the size and velocity distribution and the number density of the dispersed phase [1]. Nevertheless, most of these techniques are complex in alignment and operation and not all are capable of delivering the desired information, especially the local number density. The number density poses very specific problems, the most prominent being an accurate estimation of the volume or area over which the number or flux of particles is registered.
A further distinguishing factor of existing techniques is the measurable size range. Interferometric techniques such as laser diffraction [2, 3], phase Doppler [4] or interferometric particle imaging (IPI) [5–8] are usually employed for particles in the range 1 < xM < 100, where xM = πdp/λ is the Mie parameter, dp being the particle diameter and λ the wavelength of light. Typically, these techniques assume that the particles are spherical and for non-spherical particles significant measurement errors in size can result. For particles larger than the diffraction limit and pixel resolution of the optical system, and/or for non-spherical particles, direct imaging in the form of backlighting may become more favourable. However, with direct imaging, difficulties in estimating the observation volume; hence the number density, arise because the depth range is not well defined. There exist several approaches to limit the depth range, the most common being planar illumination, e.g. using a laser light sheet. Numerous techniques exploit this method, for example ILIDS/IPI [7] or LIF/Mie [9–12], however, also with this approach the observation volume is not well defined and optical access for illumination is required perpendicular to the camera line of sight, in many practical cases an insurmountable difficulty. Another approach for limiting the depth range is depth from defocus (DFD), by which the position of the particle along the axis of observation is estimated from the degree of image defocus.
The present study explores the feasibility of implementing a DFD system using two cameras for the measurement of drops in a sparse spray. The technique is equally applicable to a flow of particulate matter or a bubbly flow; however drops in a spray at sizes below several hundred microns can be expected to be spherical due to the dominating surface tension forces, which simplifies the size measurement at this first exploratory stage.
Previous work on DFD will be briefly summarized in the following section, followed by the introduction of a novel image processing algorithm for estimating size and position of drops in the image. Then the sensitivity of the new algorithm to optical system parameters will be investigated using measurements with a calibration target, and finally sample measurements from a simple, sparse spray will be presented.
2. Depth from defocus
After the concept of DFD was introduced by Pentland [13] and Krotkov [14], several variations of DFD techniques were established, based either on single-sensor [15–17] or two-sensor [18, 19] systems. For single imaging sensor systems, one approach is based on special apertures, such as the three-pinhole aperture described in [15] or a coded aperture in [16]. Other approaches were based on the image processing algorithms, obtaining relative depth information from a single image [17]. A variation of DFD realized for particle tracking is astigmatism particle image velocimetry, which, through the use of a cylindrical lens in front of the sensor, leads to prolate/oblate shapes of the particle images as the object moves behind or in front of the object plane [20]. However, this technique does not deliver size information about the particle. Another approach to achieve absolute depth information is to use two or more images obtained with different parameters of the optical system, such as aperture, focal length, or the imaging distances [21]. Although the two images could be acquired sequentially, before and after changing the parameters of the single camera imaging system, the two-sensor system has obvious advantages for measuring moving objects. A special example is the single three-colour CCD camera [19], which captures two images at different wave bands using red and green sensors. Numerous studies developed image processing algorithms or deconvolution algorithms, either working in the spatial domain [22, 23] or frequency domain [19]. Algorithms are still undergoing development with the goal of achieving higher accuracy, decreasing computation time [24], or application to coded aperture setups [25].
Applications of DFD for particles include 3D particle tracking velocimetry (PTV) [26] and measurement of particle size distribution [27]. The former simplifies the problem by considering particles with uniform shape and size and of primary interest is only the position and velocity of the particles. The latter takes into consideration the influence of particle size on the in-focus or defocus criteria. There are two aspects to be considered in the measurement of the probability density function (PDF) of the size for spray drops: estimation of particle size and estimation of the measurement volume. The latter is necessary to estimate particle number density and is moreover a prerequisite for correct calculation of the particle size distribution.
Generally, methods to measure particle size can be divided into two groups. One group considers nearly in-focus particle images, using an in-focus criterion to reject unfocused images [28–30]. They can even be classified further into techniques based on the gray level gradient [29] or contrast value [28], or both [30]. Another approach is to estimate particle size from both focused and defocused images [27, 31], which can increase the depth of the measurement volume and allow a larger number of drops to be validated from the same image. The methods can also be classified according to how to define the effective depth of field or the measurement volume, being dependent [29, 32] or independent [27, 28] of the particle size. The ultimate goal of these techniques is to realize three-dimensional visualization and characterization of sprays. Legrand et al [31] considered estimation of particle size and depth location from defocused images, but a directional ambiguity of depth location remained. The present study offers a strategy to solve the ambiguity problem for depth location estimation by using two cameras with different imaging distances on the same optical axis. Moreover, by using a Gaussian convolution model, the measurement procedure is simplified compared to former studies.
3. Image processing algorithm
3.1. Basic equations for a two-camera system [31]
The optical parameters involved in a two-camera imaging system are pictured in figure 1. For simplicity, an object-space telecentric lens, which is generally recommended for measurement, is considered. Point P in the object plane has a conjugate point P' in the focusing plane (FP) of the imaging space. Two imaging sensors (IS1 and IS2) are placed at different distances s1 and s2, resulting in two images with blur radii of R1 and R2 respectively. Similar figures can be found in references [31, 33]. Using the Gaussian thin lens formula [34]
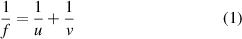

Figure 1. Definition of optical parameters of the two-camera imaging system with an object-space telecentric lens.
Download figure:
Standard image High-resolution imageand simple triangular calculations, the relationship between the defocus blurring radius R and the object distance u can be determined as
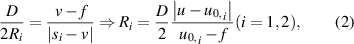
where D is the aperture diameter, f is the focal length of the lens and u0,i are the conjugate object distances of ISi. Equation (2) shows that the blur radii Ri exhibit a negative or positive linear relationship with u, when the object lies on the far side or near side of the object plane (relative to the lens) respectively.
It is apparent that the blur radius contains information about the axial position of the object and in the present study a gray level threshold will be used to quantify the relationship between the blur radius and the particle's axial position. Figure 2 shows the relevant dimensions in the image plane. The drop image (or dot image for calibration) with no blur and no diffraction effects is represented by the thick outer circle, having the diameter  , where Mi is the magnification at the image plane ISi and can be calculated as
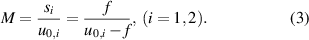

Figure 2. Schematic of the blur convolution in the image plane.
Download figure:
Standard image High-resolution imageThe gray level inside this circle would be 1 (white) and outside 0 (black), assuming a previous normalization of the gray levels, which will be mentioned below. However, because of the defocus, the image is blurred on its boundaries. The actual gray level of each pixel is obtained by the convolution of the non-blurred image with a defocus blur kernel h [27], represented in figure 2 by the gray shaded circle.
The defocus blur kernel h is often assumed to be well represented by a Gaussian distribution with a standard deviation σ, whereby diffraction effects can also be absorbed into this kernel at the calibration step. The blur kernel can be expressed as
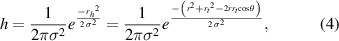
where  is a radial coordinate as defined in figure 2, and θ is the angle between r and rt. Considering a point at some radius rt, the gray level at that point, gt, will be the integral of the blur kernel h over the area bounded by the outer circle (since outside the circle the gray level is zero):
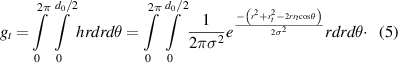
This expression can be rearranged into the following form:
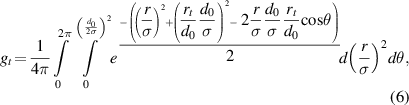
whereby rt/σ and θ are now the integration variables. For a given threshold gray level gt, the radius rt can be obtained by image processing. Equation (5) provides an expression for d0 and σ through the dimensionless ratios rt/d0 and σ/d0. In other words, given a gray value in the image gt, there is a certain relation between rt/d0 and σ/d0, no matter how large the particle size is.
It is therefore necessary to know the blur kernel standard deviation σ, which will be related to the distance between the actual object location and the focal plane. This distance will be designated  or
or  , where u is the actual object distance from the primary plane of the lens and u0 (u0,1 or u0,2) is the corresponding conjugate object distances of the sensor, as shown in figure 1. For a thick lens or lens set, the principle plane of the lens is not exactly known. Thus, the object distance u can be expressed as the object distance from the front of the lens (w) plus the distance between the front surface of the lens and the principle plane (l), i.e. u = w + l, where w can be measured directly. This refinement of the object distance is necessary in the calibration phase of the system and will be invoked below.
It is noted in [35] that the standard deviation σ is proportional to the defocus blur radius R. For an object-telecentric lens and using equation (2), the relation between σ and u−u0,i will be a proportional function:
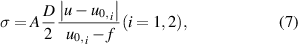
leading to a relation between σ and z
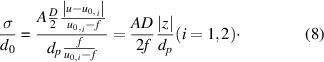
A is the corresponding experimental constant of the imaging systems. Equation (8) describes a proportional relation between σ/d0 and z/dp, which means σ/d0 in equation (6) can be replaced by z/dp. So the relationship between rt/d0 and σ/d0 presented in equation (6) can be expressed by a similar relationship between rt/d0 and z/dp. Combining equations (6) and (8), it can be noticed that the function between rt/d0 or dt/dp (= 2rt/dp) and z/dp is symmetric with respect to z =0. Thus, the function between dt/dp and z/dp is used for depth and size estimation, as
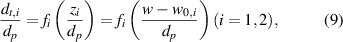
where fi are calibration functions for the two camera systems, representing the relationship described by equation (6), and also to be discussed below. w0,i are the corresponding focal plane locations for the two sensors from the front surface of the lens, i.e. the working distances for the two sensors, which are experimental constants and can be measured. dt,i are the measured particle diameters from the images on imaging sensor 1 and 2, applying a certain gray level threshold (equal to the threshold value for calibration) respectively. The two unknown variables, the particle diameter and its axial position, dp and w, can be determined from these two equations. In the present study, this function was solved with Matlab's fsolve function. Equation (9) will be valid as long the blur kernel (σ) is proportional to the distance z.
The previous derivation has assumed that the particle images are circular and are described by a single diameter dp. This is a good assumption for small drops in a spray, since surface tension forces dominate over deforming aerodynamic forces. If this assumption is violated, then the axisymmetry assumed in equation (5) can no longer be applied and the integral of the blur kernel becomes shape dependent and can no longer be analytically simplified. This leads to a rather complicated inverse problem, which will not be pursued in the present study.
3.2. Calibration and depth range
Calibration of function f can be performed using a calibration target with dots of size dp moved through the depth range along the optical axis. First, the target locations w0,1 and w0,2 are detected corresponding to the sharpest images of the two sensors. Then, with different locations z a series of dt/dp ∼ z/dp data can be obtained for each camera. This data is used for curve fitting to obtain the function f for each camera system. Hereby, dt is the diameter detected on the image sensors with the certain gray level threshold gt. Consider the case when dt,1 and dt,2 go to zero, i.e. either at the minimum or maximum depth range,  and
and  , out of which the particle can no longer be detected with the threshold gt on the image. Equation (9) then reads
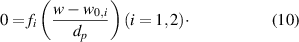
With calibrated functions f1 or f2, the depth range of each sensor  can be exactly obtained by solving equation (10), which is symmetric with respect to
  or
or  . Obviously, the depth range
  for each image sensor will be proportional to particle size dp, i.e. a large particle will be detectable over a larger depth range than a small particle.
For the present system w0,1 > w0,2; hence, the target must be moved through the range  , over which the target can be detected on both of the sensors. Δw is then called the depth range of the total system. This depth range is also a linear function of the particle size dp. This leads to the situation that large particles will be detected over a larger measurement volume than small particles, which will bias both the estimated particle size distribution and the number density. This is a problem well known in many optical particle sizing techniques, but here this bias can be accounted for. For the probability size distribution, each size bin in the distribution function (dp ± Δdp), must be weighted by Δw, which is a function of dp. This weighting function can be obtained by calibration, which will be shown below in conjunction with figure 7.
3.3. Processing algorithm
The overall processing algorithm is pictured as a flow chart in figure 3. It consists of a calibration step and a measurement step. The calibration step works with a dot matrix target plate, the measurement step is performed in a spray. In both cases a background removal and a normalization of the image gray values is first performed, and then the two images are aligned with each other. The background removal and normalization follows closely the approach outlined in [32] and includes several steps. First, images are acquired on each camera with the backlighting, but no object (calibration target or spray); the intensity of each pixel is denoted Ibi (background illuminated). Then the lenses are covered and further images are captured, denoting the intensity Ibs (background shaded). The normalization in subsequent images with pixel intensity I is given by
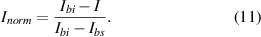

Figure 3. Flow chart of image processing algorithm.
Download figure:
Standard image High-resolution imageBacklight illumination techniques produce raw images with black objects over a white background, while the normalization leads to an inversion of the image, i.e. an object appears as bright over a black background. Following the normalization, an alignment procedure is performed to deal with transformation, rotation and scaling between corresponding images from the two cameras. Transformation and rotation arise from unavoidable assembling errors of the beam splitter and cameras. Scaling is necessary because a simple lens is used rather than an image-space telecentric lens. Images on the two sensors exhibit different magnifications because of different distances of the two sensors. However, the ratio of the two magnifications theoretically equals the ratio of the image distances and should remain the same wherever the object is. In this study, an area-based alignment method developed by Evangelidis and Psarakis [36] was adopted, using the two-step Lucas–Kanade algorithm and two-level execution to obtain the alignment matrix. Individual values in the alignment matrix vary insignificantly with depth range (smaller than 2% over five times the depth of field) and these variations are ignored in further processing. Therefore, the alignment matrix values are obtained from images taken between the two focal planes of the sensors.
When processing images from the calibration step, the images from the calibration dots are used to determine the calibration functions f1 and f2 using equation (9). Some normalized threshold gray level must be prescribed to determine dt,1 and dt,2 and the choice of this value is discussed in the next section. Precaution must be taken that the calibration target is not so far out of focus that the blurred images of neighbouring dots overlap on the camera images. This clearly will place an upper limit on the measurable number density.
When processing images from spray measurements, the drop images occur randomly in the camera images with differing degrees of defocus. These individual drop images must first be identified and then individually processed. For this, the same threshold gray value used for the calibration step is applied to the two images after normalization. Only the drops whose images are identifiable on both cameras are chosen for processing, which is realized by a logical 'AND' operation. For the identified images, the corresponding area-equivalent diameters of the detected regions are taken as dt,1 and dt,2, which are used to obtain dp and z by solving equation (9). The final number probability density function of the size is obtained from these dp results, including the depth range bias correction mentioned in section 3.2.
In the next section some details about the algorithm implementation are given, in particular the influence of the gray level threshold, the magnification, the calibration dot size or the approximation of the calibration curves on the resulting drop size and position. For this a particular optical system must be specified.
4. Measurement system and optical performance
For validation of the DFD technique a laboratory system has been assembled comprising a cubic beam splitter (Thorlabs 25.4 mm cube), an object-space telecentric lens (CanRui XF-T1×110D) and two cameras (IMI IMC-7020G, 1624 × 1232 pixels; pixel size 4.4 µm, 12 bit), as pictured in figure 4. The distance from the lens to camera 1 is about 5 mm shorter than to camera 2, which is realized by adjusting the camera on the mounting rails. The calibrated magnifications of the two cameras imaging on the focal plane are 1.563 and 1.552 respectively. The calibrated working distances of the two sensors, i.e. w0,1 and w0,2, are 84.4 mm and 82.6 mm respectively. The calibration target had dot sizes between 30 µm and 240 µm and were illuminated from the back using a 10 W blue LED light source.

Figure 4. The schematic of the two-camera imaging system.
Download figure:
Standard image High-resolution imageEquation (9) provides a relation between dt,i/dp and zi/dp, which is expected to depend on the chosen threshold gray level. To study this dependency normalized gray levels (gt) between 0.3 and 0.8 have been used to analyse 100 µm calibration dots at different zi/dp positions. The results of these measurements for camera 1 are illustrated in figure 5.

Figure 5. Influence of normalized gray level threshold gt on the calibration curve dt1/dp vs. z1/dp for camera 1 and a 100 μm calibration dot.
Download figure:
Standard image High-resolution imageSince no perfectly focused image exists in a real imaging system, the image is still a little defocused at z = 0. This leads to different values of dt at z = 0 for different gray level thresholds gt. However, this does not pose a problem, as long as the threshold gt remains the same between calibration and measurement experiments. For small values of gt, gt = 0.3 for example, the value of dt/dp first increases with |z/dp| and then decreases at larger displacements from the focal plane. The reason for the initial increase is that the small defocus degree makes the gray level of pixels outside the boundary of drop images increase, and the limiting threshold circle becomes larger than the actual drop diameter at the camera plane  . Using a higher threshold (gt = 0.4) results in a relatively flat behaviour of dt/dp over z/dp, which for a calibration function is undesirable because of the weak sensitivity to position. Therefore, values of gt equal to or larger than 0.5 are more suitable. However, using a value of gt which is too large is again undesirable, since this greatly limits the measurable depth range, i.e. Δz. In the present study a normalized threshold value of gt = 0.5 has been used. Sometimes the value gt = 0.6 is preferred, depending on the system.
The relations in equation (9) should be independent of dot/drop size and this influence is pictured in figure 6, in which calibration results for different dot sizes are presented for camera 1, using a normalized gray level threshold of  . This influence on the measured dot/drop size remains very small. Calibration curves as shown in figures 5 or 6 are more convenient in an analytic form for the subsequent processing of measurements. For this purpose a least squares fit using a sixth order polynomial (correlation coefficient R = 0.9997) was used.

Figure 6. Influence of drop size dp on the calibration curve dt1/dp vs. z1/dp for camera 1 using normalized gray level threshold gt = 0.5.
Download figure:
Standard image High-resolution image
Figure 7. Variation of depth range as a function of dot size dp for each sensor and for the total system.
Download figure:
Standard image High-resolution imageWhen the images from two cameras are considered, two curves similar to those in figures 5 or 6 are obtained. After obtaining dt1 and dt2 from the two cameras, the drop size and position, dp and w, can be computed by solving equation (9).
A linear relation between the measured depth range and the dot/drop size is expected for each camera as well as for the entire system. Such a relation is shown in figure 7, calculated from the calibration results. The direct experimental results of effective depth range for camera 1 are also shown for comparison, which reveals good agreement with the calibration function. With this particular system, the minimum dot size recognized by two cameras at the same time is about 23 µm, which represents the lower measurable limit. To decrease this lower limit a lower degree of defocus blur can be adopted, achieved either by using a smaller aperture or by choosing a smaller optical path length difference between the two cameras, which can be applied according to the measuring requirements.
To investigate the robustness of the algorithm to noise, an analysis using synthetic dot images over a total image size of 401 × 401 pixels and using a dot diameter of 60 pixels was carried out. The background was set to black and the dot to white. The synthetic defocused images exhibiting different degrees of defocus were obtained by convolving the original focused image with a spatial Gaussian filter, whose blur parameters were estimated according to the parameters of the laboratory system. Gaussian distributed noise was then added with zero mean and three different standard deviation values 5, 10 and 20 gray levels. The images without noise were used to obtain the calibration function f1 and f2, which were then used to estimate dp and w from each group of images, serving as a reference. The processing algorithm was then applied to the synthetic images with noise and as shown in figure 8, the relative errors ΔEd for measured dp are generally smaller than 10%, even when the standard deviation achieves 20 gray levels. The relative errors ΔEw for measured w are smaller than 4% when the standard deviation is lower than 10 gray levels. These are considered very acceptable values, since the standard deviation for industrial cameras is generally lower than 10 gray levels. With the operating conditions in the present experiments, the gray level standard deviation for the camera models used is about 2–5 gray levels, using the estimation method from the reference [37].

Figure 8. Relative errors for measured dot size (a) and position (b) using synthetic images with different simulation noise level.
Download figure:
Standard image High-resolution imageValidation experiments were performed using target plates with dots of varying diameter. The system calibration was performed using a target plate with 100 µm dots. The target plates were translated along the optical axis through a depth range of 73–93 mm. The measured positions and sizes of the varying diameter dots are summarized in figure 9. The measurement error for the dot size was less than 5%, except for a few locations far removed from the focal plane for the 240 µm dots (figure 9(a)). The different depth of field, Δz, for different dot sizes is also immediately visible from this data. Moreover, the computed position of the target plate was rather good for all dot sizes, as seen in figure 9(b).

Figure 9. Measurement of dot size (a) and position (b) using calibration target plates traversed along the optical axis.
Download figure:
Standard image High-resolution image5. Example measurements
A flat-fan spray generated with a pressure swirl nozzle (1/4MV 6502 S303, H. IKEUCHI & Co., Ltd) serves as a test case for the DFD optical system. The atomizing pressure was set to 3 bar and the measurement location was 250 mm away from the nozzle on the central axis. The system in figure 4 was used for the measurement. The measurement volume of this system is a function of particle size, but is approximately 4.5 × 3.5 × 25 mm3 (W × H × D) for the largest particles used in this study (240 µm diameter). The backlight LED was set to pulse mode with a pulse width of 1 μs.
Figure 10 displays a part of one typical image pair from the two cameras, which has been normalized and aligned. The blue boundaries on the upper image and the green boundaries on the bottom image indicate the detected drop boundaries using a normalized gray level threshold of 9.5. The area equivalent diameters of the detected regions are taken as dt,1 and dt,2. The retrieved d0 values are illustrated as red circles on the bottom image, with the center coincident with the detected region on the bottom image. A d0 value can only be calculated when drops are detected by both cameras. The values for dp (in the object space) and corresponding depth locations w are written beside the red circles.

Figure 10. Typical normalized and aligned image pair obtained from camera 1 (upper) and camera 2 (bottom).
Download figure:
Standard image High-resolution imageThe DFD statistics have been computed from 19 269 drop images that are extracted from 2005 camera image pairs. The computation time was about 30 min for these images, without exploiting parallel calculation on a 2.5 GHz CPU. A scatter diagram of the retrieved drop sizes and depth positions is shown in figure 11, where the measured linearly dependent depth range as a function of drop diameter is readily apparent. This agrees well with results shown in figure 7, which are from both theoretical analysis and calibration experiments.

Figure 11. Sampled drop diameters and corresponding depths.
Download figure:
Standard image High-resolution imageOn the other hand, 8771 drops that were highly in focus are also sorted out from 2005 images of camera 1. The size distribution of those drops was also calculated as a comparison. Since the depth of field (DOF) of the lens is also a linear function of particle size, the bias correction has also been performed on the probability density function (PDF) obtained using the focus imaging method. Figure 12 shows the PDFs of the DFD method before and after the bias correction pertaining to the depth range as a function of particle size, as well as the PDFs of focus imaging method, employing the same bias correction as the DFD method and using the same linear proportionality of the depth of field with size. Corresponding statistical values from the probability density size distribution, dv10, dv50 and dv90, which are the values for 10%, 50% and 90% of the cumulative volume of drops, are given in table 1.
Table 1. Comparison of statistical values between DOD and focus imaging method (μm).
| dv10 | dv50 | dv90 | |
|---|---|---|---|
| DFD before bias correction | 60.3 | 100.4 | 188.7 |
| DFD after bias correction | 50.5 | 82.4 | 148.7 |
| Focus imaging before bias correction | 61.1 | 94.5 | 158.5 |
| Focus imaging after bias correction | 56.0 | 84.4 | 137.6 |

Figure 12. Comparison of volume weighted drop size probability density distribution between DOD and focus imaging method.
Download figure:
Standard image High-resolution image
First, comparing the probability density distribution of the DFD method before and after the bias correction, the correction clearly increases the proportion of smaller drops, since their corresponding detection volume is smaller and this must be compensated for: the dv50 value decreases from 100 to 82 µm. Then, comparing the size distribution of the focused droplet images to that obtained using the DFD method after the bias correction, the former exhibits a lower proportion of small droplets. This also to be expected, since small drops are more readily out of focus than large droplets; hence, also exhibiting a detection volume bias, albeit less than expected with the DFD method. A more detailed treatment of the out of focus behaviour of a single lens system can be found in [32].
To calculate the volumetric number density, the sampled drops over the entire size range are divided into sub-ranges, for example for the data shown in figure 12 the size range 26.1–400 μm is divided into  equal bins. There are ni drops in the ith bin, with a mean diameter
  . The width and height of the measurement volume are designated
  and
and  respectively for each bin. The width and height are estimated as the image area minus the area containing truncated drop images, which cannot be processed, i.e.
  , where W and H are the field of view of camera 2 (since the values are smaller than that of camera 1). The depth of the measurement volume is equal to the effective depth of field for size
  , i.e.
  . The number density
  can then be expressed as
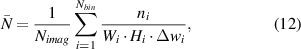
where  is the number of processed images. The number density computed for the measurements presented in figure 12 is for example 357 drops cm−3. Note, that this determination of the detection volume depth,
  , and determination of the individual particle sizes and positions in this volume, are features which no other technique can presently offer.
6. Summary and conclusions
A measuring methodology for spray drop size and depth location is proposed using a two-camera depth from defocus system, by capturing two images with different defocus blur. Based on the convolution process of imaging, a size-independent relation dt,i/dp vs. zi/dp is established and validated by experiments. The particle size and exact depth location are retrieved by solving two calibrated functions obtained from two cameras. Synthetic images are processed for robustness analysis of noise, and the results show good performance of the developed algorithm. Validation experiments using dot targets are performed, yielding measurement errors less than 3% for particle sizes near the focal plane. A test case using a flat-fan water spray is performed to validate the functionality, and the size distribution is compared with that obtained by focus droplets imaging method, with relatively good quantitative agreement.
The image processing algorithm, based on a single normalized gray level threshold, is simpler than former approaches with two level thresholds or using gray level gradients. Moreover, the measurement depth range based on this method exhibits a simple proportional relationship with particle size, which can be used for bias correction of the particle size distribution and number density. This leads to a highly resolved measurement volume depth; hence, an accurate estimation of the overall measurement volume, allowing very accurate volume number density distributions to be estimated. This constitutes a decisive advantage over existing optical techniques for particle size measurements. Having information about drop locations throughout a three-dimensional volume also provides the opportunity to recognize non-uniform distributions of drops in space, as can be encountered in certain types of sprays.
Future work on this technique will consider the measurable limits of particle/drop number density due to overlapping object images and in dependence on the chosen measurable size range. This analysis will follow closely the dependencies derived for the IPI technique in [38]. Another algorithm refinement will address the above-mentioned difficulties arising with transparent particles/drops, where first-order refraction leads to an additional spot in the object shadow.
Acknowledgments
Financial supports from National Natural Science Foundation of China (NSFC) (Grant No. 51576130) and National Science and Technology Major Project (Grant No. 2017-V-0016-0069) are gratefully acknowledged. The authors also appreciate greatly the discussions with Prof. Ilia Roisman concerning the convolution integral, the assistance with the spray measurements from Mr. Fabian Tenzer, and advice on the calibration system control from Mr. Lingxi Li.