

Abstract
There has been a great deal of recent interest in producing weather forecasts on the 2–6 week sub-seasonal timescale, which bridges the gap between medium-range (0–10 day) and seasonal (3–6 month) forecasts. While much of this interest is focused on the potential applications of skilful forecasts on the sub-seasonal range, understanding the potential sources of sub-seasonal forecast skill is a challenging and interesting problem, particularly because of the likely state-dependence of this skill (Hudson et al 2011). One such potential source of state-dependent skill for the Northern Hemisphere in winter is the occurrence of stratospheric sudden warming (SSW) events (Sigmond et al 2013). Here we show, by analysing a set of sub-seasonal hindcasts, that there is enhanced predictability of surface circulation not only when the stratospheric vortex is anomalously weak following SSWs but also when the vortex is extremely strong. Sub-seasonal forecasts initialized during strong vortex events are able to successfully capture the associated surface temperature and circulation anomalies. This results in an enhancement of Northern annular mode forecast skill compared to forecasts initialized during the cases when the stratospheric state is close to climatology. We demonstrate that the enhancement of skill for forecasts initialized during periods of strong vortex conditions is comparable to that achieved for forecasts initialized during weak events. This result indicates that additional confidence can be placed in sub-seasonal forecasts when the stratospheric polar vortex is significantly disturbed from its normal state.
Export citation and abstract BibTeX RIS

Content from this work may be used under the terms of the Creative Commons Attribution 3.0 licence. Any further distribution of this work must maintain attribution to the author(s) and the title of the work, journal citation and DOI.
1. Introduction
Stratospheric sudden warming (SSW) events are known to be associated with anomalous and persistent negative anomalies in the Northern Annular Mode (NAM) pattern in the troposphere and corresponding surface temperature anomalies in northern Eurasia and northern North America (Baldwin and Dunkerton 2001). As such, stratospheric variability represents a potential source of atmospheric predictability on the sub-seasonal and seasonal timescale (Baldwin et al 2003, Maycock et al 2011, Roff et al 2011, Hardiman et al 2012). But it has only recently been possible to demonstrate that seasonal forecasting models can improve their predictive skill when forecasts are initialized during the onset of an SSW event (Sigmond et al 2013).
Previous observational studies have also demonstrated that periods in which the stratospheric polar vortex is extremely strong result in similar long-lived circulation anomalies in the lower stratosphere (Baldwin and Dunkerton 2001, Limpasuvan et al 2005). These circulation anomalies are associated with persistent positive anomalies in the tropospheric NAM, giving rise to surface weather impacts opposite to those following SSWs. In this study we seek to answer a simple question: Are similar gains in predictability of the surface circulation and temperature possible when forecasts are initialized during periods when the stratospheric polar vortex is stronger than its climatological norm?
We use European Centre of Medium-range Weather Forecasting (ECMWF) extended ensemble prediction systems data (Vitart et al 2008), which are acquired for Sub-seasonal to Seasonal (S2S) prediction project (Vitart et al 2012). ECMWF runs 32-day long, 51-member operational sub-seasonal forecast every Monday and Thursday. The Monday forecasts started in March 2008 and were increased to twice weekly frequency (Monday and Thursday) from October 2011. The forecasts are calibrated using re-forecasts or hindcasts (one control + four perturbed forecasts, starting the same day and month as the real-time forecast but for the previous 20 years). We exploit the full hindcast dataset, which provides 22 years (1993–2014) of five ensemble member weekly forecasts, to determine the sub-seasonal predictability associated with extreme stratospheric vortex states. The model has 62 vertical levels with the top level at 5 hPa. Since November 2013, the vertical resolution has increased to 91 vertical levels with the top level at 0.01 hPa.
Using the hindcast database we build up two sets of forecasts initialized during weak or strong vortex events. Then we compare the average skill (quantified by the anomaly correlation coefficient (ACC)) in forecasting surface climate for the two sets with the base skill in a third set of forecasts initialized when the stratospheric vortex is close to its climatological state (medium forecast set). The initial wind at 10 hPa and 60°N for the forecast start dates, which make up the weak, the strong, and the medium forecast sets, are shown in the figure 1. The selection criteria for these dates are described in the following section.

Figure 1. The four week time series of zonal mean zonal wind at 10 hPa and 60°N on the day of forecast initialization for STRONG (blue lines), MED (grey lines), and WEAK (red lines) sets. The data is from ERAI re-analysis. The lower threshold for the initializations of the STRONG set is 41.2 m s−1 (80th percentile level of NDJFM [u]10 hPa, 60°N distribution), and for the WEAK set the upper threshold [u]10 hPa, 60°N is 0 m s−1. For MED set the lower threshold wind is 14.5 m s−1 (30th percentile level of the distribution) and the upper threshold is 36.0 m s−1 (70th percentile level of the distribution). The threshold criteria is applicable only on the initial conditions (see section 2 of the text for more detail). The dots show the mean weekly zonal mean zonal wind values corresponding to the STRONG (blue), MED (black), and WEAK (red) sets.
Download figure:
Standard image High-resolution image2. Methods
2.1. Selection criteria for strong, medium, and weak vortex
The forecast dates which make up the weak, strong, and medium ensembles are selected based on the extended winter time (November–March, henceforth NDJFM) climatological distributions of ERAI reanalysis daily average of zonal mean zonal wind ([u]10 hPa, 60°N) at 10 hPa 60°N from 1980 to 2012.
Weak vortex dates (henceforth WEAK) are chosen to occur when the [u]10 hPa, 60°N is zero or negative on the initial day of forecast initialization consistent with one of the criteria used to define the onset of major SSW events (e.g. Charlton and Polvani 2007). Note that the forecasts that make up the WEAK ensemble do not necessarily begin on the onset day of a major SSW. The results presented are robust to other choices for the WEAK threshold between 15 ms−1 and zero.
Strong vortex (henceforth STRONG) dates are chosen to occur when the [u]10 hPa, 60°N exceeds the 80th percentile value of the NDJFM [u]10 hPa, 60°N distribution. The results presented are robust to other choices of the threshold between the 75th and 90th percentile of the NDJFM [u]10 hPa, 60°N distribution.
A third set of medium forecasts (henceforth MED) is chosen to characterize the background skill of the model when the stratospheric state is close to its climatological value. To ensure a clear separation between the WEAK and STRONG vortex forecast sets and the MED cases, forecasts initialized when the ERAI wind is between 30th and 70th percentile of the distribution are included in the MED ensemble. Forecasts are classified only on [u]10 hPa, 60°N at the initialization time for each forecast and we do not consider how the vortex evolves beyond the initial time either in the re-analysis or in the model.
As can be seen in figure 1, although there is broad persistence of both the STRONG and WEAK states on the sub-seasonal range, there are some STRONG cases in which the strength of the vortex changes rapidly. The nature of the dataset and our method of selection of cases gives a much larger number of WEAK cases than Sigmond et al (2013) study, ours contains: 36 cases for WEAK, 103 cases for STRONG and 199 cases for MED. We have performed testing to ensure that the results presented are robust to the choices of the [u]10 hPa, 60°N thresholds. As expected, increasing the sample size for the STRONG case reduces uncertainty around the estimates of skill but also reduces the overall skill for most measures; because to increase the sample size the [u]10 hPa, 60°N threshold needs to be lowered towards medium vortex cases and therefore more weaker vortex state cases are included.
2.2. Forecast skill calculation
Composites of surface climate anomalies for each forecast set are produced by taking the weekly average of the ensemble mean forecast anomaly for each of the forecasts in each set. Given that the hindcast runs are available only once per week the closest available forecast to the threshold crossing time is used. For example: if a strong vortex date falls on Tuesday then the hindcast for the following Thursday (2-days later) is used. The algorithm exclude any hindcast on this date in further selections to avoid double counting. In all cases week 1 is the average 0–6 days after initialization, week 2 is 7–13 days, week 3 is 14–20 days and week 4 is 21–27 days. The significance of surface temperature anomalies and the significant level (p-value) is calculated using bootstrap resampling. A total of one thousand samples are generated, picking randomly from available data for each case shown in the figure 1. Sample size is same as the size of data set i.e. 36 for WEAK, 103 for STRONG and 199 for MED. Sample selection is done with the replacement. The forecast skill of parameters for a given region is calculated as the ACC given by:
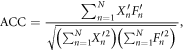
where N is size of the sample: 36 for WEAK, 103 for STRONG, and 199 for MED cases; X' is observed anomaly from climatological mean; and F' is corresponding forecast anomaly. The model data is first bias corrected for any drift during the course of integration, and the anomalies are then calculated with respect to the daily ERAI climatology for 1980–2012.
The boundaries of regions for ACC calculations are: for the WEAK cases (marked in the figure 2), the Eastern Canada region A1 (latitude 55°–75°N, longitude 265°–310°E), the North Eastern Eurasia region E1 (latitude 58°–72°N, longitude 70°–130°E), the Middle East region M1 (latitude 31°–45°N, longitude 30°–75°E); and for the STRONG cases (marked in the figure 3), the Eastern Canada region A2 (latitude 55°–75°N, longitude 265°–310°E), and Northern Eurasia region E2 (latitude 60°–80°N, longitude 20°–140°E). The ACC is calculated from the area-averaged anomalies.

Figure 2. Weekly 2 m temperature anomalies (K) following weak vortex events (WEAK cases). Left column shows the anomalies in observation (ERAI data) and the right column shows the anomalies in the forecasts from the model ECMWF. Contours represent anomalies in sea level pressure. Solid contours show positive anomaly and the dotted ones show negative. Contours are 1 hPa apart (at −1.5, −0.5 0.5, ...). The marked regions are A1 (in the Eastern Canada region), E1 (in the Northern Eurasia region), and M1 (in the Middle East region). Positive temperature anomalies are shaded in red and the negative temperature anomalies in blue. They are shaded only if the weekly average exceeds 0.4 °C.
Download figure:
Standard image High-resolution image
Figure 3. Weekly 2 m temperature anomalies (K) following strong vortex events (STRONG cases). Left column shows the anomalies in observation (ERAI data) and the right column shows the anomalies in forecasts from the model ECMWF. Contours represent anomalies in the sea level pressure. Solid contours show positive anomaly and dotted show negative. Contours are 1 hPa apart (at −1.5, −0.5 0.5, ...). The marked regions are A2 (Eastern Canada region) and E2 (Northern Eurasia region). Positive temperature anomalies are shaded in red and negative temperature anomalies in blue. They are shaded only if the weekly average exceeds 0.4 °C.
Download figure:
Standard image High-resolution image3. Results
Prior to presenting the predictability of surface temperature and circulation for the STRONG vortex forecast set, we first analyse the WEAK vortex forecast set to provide a benchmark for the strong vortex cases and for comparison to previously published results (Sigmond et al 2013). Figure 2 shows that for the WEAK cases, observations (ERAI) show a strong negative NAM pattern in sea-level pressure (positive anomalies at the pole and negative anomalies in mid-latitudes). This pattern is strongly present in weeks 2 and 3 after the initialization and decays slightly but is still present in week 4 (figure 2, left column). The strong negative NAM pattern is associated with warm anomalies in Eastern Canada and the Middle East and cold anomalies in Northern Eurasia. The ECMWF model (figure 2, right column) is able to capture both the negative NAM signature and its impact on surface temperature with very good fidelity in weeks 2 and 3 and with some fidelity in week 4. The model is also able to capture 2–3 °C of positive temperature anomaly observed in the Middle Eastern region during week 2 to week 4. The model is able to capture this surface signature because it is able to capture the strong negative NAM signature throughout the stratosphere and troposphere and to persist this significant anomaly throughout the forecast period to week 4 (supplementary figure S2). In the lower stratosphere, this signature represents, on average, a large positive geopotential height anomaly over the polar cap consistent with displacement or breakdown of the polar vortex, which persists throughout the forecast (supplementary figure S3).
An oppositely signed anomaly in surface climate features is present for the STRONG vortex set. The left column of figure 3 shows the strong positive NAM anomaly in sea-level pressure following strong vortex events, with negative pressure anomalies over the polar cap and positive pressure anomalies in the mid-latitudes. Particularly in week 3, the ability of the model to reproduce the observed anomalies in the surface pressure field is impressive, for example compare the position of the high pressure anomaly over Alaska and the position of the low pressure anomaly over Great Britain in ERAI and model forecasts in week 3. The positive NAM pattern is also associated with significant surface temperature anomalies. There are strong positive temperature anomalies in Northern Eurasia. There also are some observable negative anomaly patches in the Eastern Canada region but not as visible and significant as the positive temperature anomaly for the WEAK cases in this region. Throughout week 2 to week 4 regions in northern Eurasia and Scandinavia are 1–2 °C warmer and the model is able to capture this regional mean anomaly (figure S1). The positive NAM signal is also well captured by the ECMWF model, with a similar degree of detail as that seen for the WEAK set. Again, as for the WEAK case, this signal is associated with the ability of the model to capture and maintain the slowly evolving strong vortex anomaly throughout the stratosphere and troposphere (supplementary figure S4), a large negative geopotential height anomaly over the polar cap in the lower stratosphere (supplementary figure S5).
Having demonstrated the ability of the ECMWF model to reproduce the mean circulation following strong and weak vortex events, we now assess the degree to which this results in a gain in forecast skill on the sub-seasonal range. Figure 4 shows weekly forecast skill for the NAM index in the stratosphere and troposphere for the STRONG, WEAK and MED cases. There is no significant difference between the skill of the three cases in week-1 in either the troposphere or the stratosphere. In the lower stratosphere (figure 4 top panel), the skill of the week 3 forecast for both the WEAK and STRONG vortex sets is enhanced compared to the MED forecast set, with ACCs of more than 0.6 for both cases. The p-values for the difference in the MED and WEAK, and the MED and STRONG cases are 0.01 and 0.07 respectively as shown in the figure. As the skill in MED sets decays in week 4, forecast skill for the WEAK set as well as STRONG sets still remain higher in comparison to MED case with p-values less than 0.01. Note, however, that skill in the WEAK set is higher than the skill in STRONG set in week-4. The enhancement of skill in forecasting the polar lower stratosphere for the forecasts initialized during extreme events in the stratosphere also results in enhanced forecast skill in the surface circulation (figure 4 lower panel), with a similar enhancement of forecast skill in week 4 for the WEAK and STRONG sets. It is important to be clear that this rather coarse skill metric does not fully account for the skilful forecasts of some of the smaller scale features seen in the figures 2 and 3, but it does indicate the extent to which state-dependent forecast skill is present in the model on the sub-seasonal range for both WEAK and STRONG cases.

Figure 4. Weekly forecast skills (ACC) for the NAM index at 100 hPa and at 1000 hPa following the weak vortex (WEAK) and the strong vortex (STRONG) cases. NAM is defined as the mean geopotential height anomaly averaged poleward of 60° N. The thick red bars show the forecast skill when model is initialized on the WEAK dates and the blue bars when the model is initialized on the STRONG dates. The grey bars show the model skills for the MED cases when the vortex is neither very strong nor very weak and is of the medium strength. Thin brown error bars show the 95% confidence level calculated from the bootstrap sampling. The p-values are calculated for the difference in skills between the MED case and WEAK case (red font) and between the MED case and STRONG case (blue font). The p-values indicate the probability that the difference in the skills in WEAK or STRONG cases and MED cases is just by chance and not because of the anomalous stratospheric state at the model initialization time. The skill differences in MED and WEAK (STRONG) cases are significant when the thick error bars are not overlapping and the p-values are less than 0.05 (95% confidence level).
Download figure:
Standard image High-resolution imageThe contribution to surface forecast skill of the persistence of stratospheric anomalies has previously been assessed using simple statistical models (e.g. Baldwin et al 2003, Christiansen 2005). Although Baldwin et al and Christiansen use slightly different methodologies, the both suggest a correlation coefficient of 0.25–0.3 between the observed lower stratospheric NAM and the month ahead tropospheric NAM.
Given the additional state-dependent skill of the large-scale atmospheric circulation present in the forecasts, we now assess the extent to which there is additional skill for surface temperature. Figures 2 and 3 clearly show that there are a number of regions in which the model is able to reproduce the positive and negative temperature anomalies consistent with the large-scale flow patterns. Therefore we choose to focus our attention on these regions to assess the potential benefit of the state-dependent skill in the forecasts. For the WEAK case, this means Middle Eastern region, and Eastern Canada and Northern Eurasia and Scandinavia. The week-by-week forecast skill for these regions and for both the WEAK and STRONG cases are shown in figure 5. The enhanced forecast skill for the regions in the Eastern Canada and Northern Russia, when model is initialized during an SSW is also shown in earlier study using a different dynamical model (Sigmond et al 2013) and a slightly different case selection criterion and averaging period. In the WEAK cases we found enhanced forecast skill for Eastern Canada in week 4, and the Middle East in week 3 and week 4 (figure 5, first and third panels), with almost double the forecast skill in week 4 in both regions. In the Northern Eurasia region there is no additional forecast skill in WEAK case. For the strong vortex set (STRONG case) the cold anomalies in the eastern Canada region are very weak but for completeness we marked the same region as in the WEAK case and calculated the forecast skill. We did not find any difference in the forecast skill between the MED and STRONG case in this region. In the region of Northern Eurasia we have a slightly enhanced skill in week 3 but not in week 4. Note however that this additional skill in week 3 for the STRONG case is not significant at the 0.10 level (p-value = 0.12).

Figure 5. Weekly forecast skill (ACC) for the regions indicated in the figures 1 and 2. First three panels (red and grey shading) show the skill for the Eastern Canada (A1), Northern Eurasia (E1), and the Middle East (M1) regions following the weak vortex events (WEAK set) and the last two panels (blue and grey shading) show the skill for the Eastern Canada (A2), and Northern Eurasia (E2) regions following the strong vortex events (STRONG set). Red bars show the skills following the WEAK and blue bars show the skill following the STRONG cases. Light-blue bars show the skill in the MED cases. Error bars show the standard error calculated from the bootstrap sampling. The p-values are calculated for the difference in skills between the MED and WEAK (STRONG) cases. Additional forecast skill in the WEAK or STRONG cases are significant when the thick error bars are not overlapping and the p-values are less than 0.05 (95% confidence level).
Download figure:
Standard image High-resolution image
4. Conclusions and discussion
Many of the original studies which examined the surface impacts of annular mode variability (Baldwin and Dunkerton 2001, Thompson et al 2002) suggested that both negative and positive annular mode anomalies, associated with weak and strong vortex events, could have large impacts at the surface and contribute to enhanced predictability of surface climate anomalies. Although the ability of seasonal forecast models to capture a predictable surface signal associated with the seasonal mean impact of weak events (SSW events) has been demonstrated before, to our knowledge this is the first time that similar state-dependent predictability has been demonstrated on the sub-seasonal scale for strong vortex events. In the ECMWF model, the greatest enhancement of sub-seasonal skill during week-3 and week-4 is in the tropospheric circulation patterns for both classes of events.
There are more mixed results for the forecast skill in regional mean temperature with significant enhancement in some regions when the model is initialized during weak vortex events but not during strong vortex events. Recent studies (e.g. Scaife et al 2014) have shown that large ensemble size is often required to capture seasonal predictability, and it may be the case that the small ensemble size of the hindcast dataset makes it difficult to discern changes in skill in regional surface temperature. We plan to test this further using the sub-seasonal to seasonal prediction project dataset with larger ensemble sizes and a multi-model ensemble of sub-seasonal forecasts.
There may also be important dynamical reasons that the WEAK and STRONG cases should not be considered direct opposites. For example, as shown in figure 1, none of the WEAK events considered results in a transition to winds beyond the STRONG threshold over the next four weeks, whereas there are a number of STRONG events in which winds transition to WEAK events and even lead to an SSW event, during the period of the model forecasts. SSW events are often preceded by anomalously strong zonal winds in the stratosphere (e.g. Charlton and Polvani 2007). Tests in which an additional persistence criterion is used to select STRONG events suggest that this might be one way to further sub-select STRONG events, which increase skill in surface temperature forecasts, but the further reduction in sample size using this method precludes confident attribution of this effect.
Nonetheless, the results presented here show that there is significant practical benefit that can be derived from sub-seasonal forecasts initialized during both weak and strong vortex events in the stratosphere. Although weak events are relatively rare, occurring on average in two out of every three winters (Charlton and Polvani 2007), strong vortex events are more common due to the strongly skewed nature of the probability density function (PDF) of stratospheric winds. Sub-seasonal forecasts are typically initialized at least once per week, meaning that it is likely that they routinely sample extreme stratospheric vortex states.
Acknowledgments
OT and AC acknowledge the support for The Stratospheric Network for the Assessment of Predictability (SNAP) by the Natural Environmental Research Council (NERC) (Grant H5147600).