

Abstract
Russian regions containing permafrost play an important role in the Russian economy, containing vast reserves of natural resources and hosting large-scale infrastructure to facilitate these resources' exploitation. Rapidly changing climatic conditions are a major concern for the future economic development of these regions. This study examines the extent to which infrastructure and housing are affected by permafrost in Russia and estimates the associated value of these assets. An ensemble of climate projections is used as a forcing to a permafrost-geotechnical model, in order to estimate the cost of buildings and infrastructure affected by permafrost degradation by mid-21st century under RCP 8.5 scenario. The total value of fixed assets on permafrost was estimated at 248.6 bln USD. Projected climatic changes will affect 20% of structures and 19% of infrastructure assets, costing 16.7 bln USD and 67.7 bln USD respectively to mitigate. The total cost of residential real estate on permafrost was estimated at 52.6 bln USD, with 54% buildings affected by significant permafrost degradation by the mid-21st century. The paper discusses the variability in climate-change projections and the ability of Russia's administrative regions containing permafrost to cope with projected climate-change impacts. The study can be used in land use planning and to promote the development of adaptation and mitigation strategies for addressing the climate-change impacts of permafrost degradation on infrastructure and housing.
Export citation and abstract BibTeX RIS
Introduction
The high latitudes of the Northern Hemisphere require imminent attention due to rapidly changing climatic conditions (AMAP 2017). One of the major socio-economic concerns of climate change in Northern regions is related to the presence of perennially frozen ground—or permafrost. Simply defined, permafrost is ground which remains at temperatures below 0 °C for at least two consecutive years. Permafrost significantly affects geomorphic, ecologic, and hydrologic processes in the high latitudes. It also impacts human activities; for example, unique and costly engineering designs and practices had to be developed to maintain the thermal stability of permafrost during the construction and lifespan of infrastructure. An increase in permafrost temperatures can greatly reduce the ability of frozen ground to carry loads imposed by structures (Instanes and Anisimov 2008). Moreover, the thawing of ice-rich sediments can result in ground subsidence and uneven surface deformations, which can further undermine the stability of engineered structures (Nelson et al 2001, Hong et al 2014). Although disturbances of the natural environment associated with the construction and support of infrastructure has a pronounced effect on thermal—and hence engineering—properties of permafrost, these disturbances are anticipated and frequently accounted for in proper engineering designs. However, rapidly changing climatic conditions were usually not fully considered in past engineering practices (Khrustalev et al 2011, Streletskiy et al 2014). Numerous studies have revealed wide-spread increases in soil temperature, warming and degradation of permafrost, attributable to changes in climate in Northern Eurasia (Romanovsky et al 2010, Drozdov et al 2015, Streletskiy et al 2015a, 2017, Romanovsky et al 2018). Simultaneously, several reports indicate an increase of infrastructure damage throughout Russia's permafrost regions over the last two decades (Kronic 2001, Anisimov et al 2010, Streletskiy et al 2014). Moreover, modeling simulations suggested that projected climatic changes are likely to result in further deterioration of infrastructure in many permafrost regions, which is concerning considering the disproportionally high economic input of these regions to the Russian economy (Streletskiy et al 2012b, Shiklomanov et al 2017b). Recently, several studies have provided quantitative assessments of potential economic impacts of climate-induced permafrost changes on various types of public infrastructure in Northern America (Larsen et al 2008, Melvin et al 2017). However, little attention has been given to the vast permafrost regions of Northern Eurasia. Some studies have estimated the potential long-term macroeconomic effects of the complete thawing of Russian permafrost by the year 2050 to be on the order of 1%–2% of Russian GDP (Porfiriev 2016, Kattsov et al 2017, Porfiriev et al 2017). However such scenarios did not account for realistic projections of climatic and permafrost changes, and thus can be considered as a useful but highly theoretical economic exercise.
This paper builds on previous work to provide estimates of the economic impacts of climate change anticipated for the mid-21st century, on buildings and infrastructure located in permafrost regions of Russia, using an ensemble of climate projections. Permafrost and engineering models, climate projections, and infrastructure inventories are used to identify the built environments at risk of damage due to projected climatic change. We use the assets preservation adaptation strategy, which assumes that the existing infrastructure is meant to be sustained in the foreseeable future, to provide economic estimates. The evaluation of potential costs, associated with replacement of damaged infrastructure relative to regional and federal budgets, are based on publicly-available statistical data on costs for various types of fixed assets and residential real estate, and other regional economic data. Results are presented in the form of maps and tables depicting the monetary costs associated with climate-induced infrastructure damage, and such costs relative to gross regional product (GRP). To our knowledge, this is the first comprehensive assessment of the cost of climate change impacts on buildings, structures and infrastructure located in the permafrost regions of Russia.
Background
Permafrost occupies nearly 65% of the territory of the Russian Federation, and profoundly affects the natural environment, traditional and nontraditional sectors of the economy, and socioeconomic conditions of the Russian Northern and Eastern regions. Despite having limited extent in the European part of Russia, permafrost is a very common phenomenon east of the Ural Mountains. There are several large Russian administrative regions where permafrost underlies a significant portion of the regional territory. For example, Chukotka Autonomous Okrug (CAO) and Republic of Sakha (Yakutia) are almost entirely located on permafrost. The properties of permafrost, as well as climatic and environmental conditions vary among the regions. At the broad geographic scale, permafrost is usually classified on the basis of its areal continuity (Brown et al 2002). Permafrost is considered 'continuous' when more than 90% of an area is underlain by permafrost; permafrost is defined as 'discontinuous' or 'sporadic' when percentages are lower. Considering the uneven distribution of permafrost in large administrative regions, a sub-regional analysis may be more appropriate for estimating impacts of permafrost degradation on regional population, infrastructure, and economy.
Resource extraction remains a primary driver of economic development in Russian permafrost regions. Within Russia, more than 15% of oil and 80% of gas production was concentrated in the Arctic regions in 2016. Oil and gas contributed nearly 30% of Russia's consolidated budget revenue, and over half of export revenue (Simola and Solanko 2017). Other natural resources extracted from these regions, including non-ferrous and rare-earth metals, also contributed greatly to the Russian economy. In 2010, Russia accounted for 71% of gross domestic product (GDP) generated by the Circumpolar Arctic zone (Huskey et al 2015). The contributions of the Russian permafrost regions—which extend far beyond the Arctic—to the national and global economy, were even higher.
Population density and the level of socioeconomic development are highly variable across Russian permafrost-affected regions. Major contributing factors are the availability and importance of natural resources, accessibility, and historic circumstances. For example, the most populous and developed areas are located in the southernmost permafrost regions along the Trans-Siberian railroad, which was built in the early 20th century. The Baikal-Amur Railroad brought intensive development to more northern permafrost-affected areas during the 1970s–1980s. However, development in the majority of Russian permafrost regions is characterized by sparse and isolated urbanized settlements of various sizes (Streletskiy and Shiklomanov 2016). These were originally established for a variety of reasons, including support of mineral resource extraction (e.g. coal, gas, oil, ore), local administration, and transportation (e.g. Northern Sea Route and river transportation). Russia's permafrost cities are characterized by a high density of diverse urban and industrial infrastructure. They often contribute substantially to their respective regional economies. The anticipated negative impacts of climatic changes on infrastructure in such densely-developed areas can cause disproportionate consequences for regional economies.
A geographic disconnect between resource-rich Siberia and distant population, industrial, and financial centers in the European parts of Russia provides significant logistical challenges. Over the last hundred years, a complex transportation networks consisting of pipelines, airports, permanent and seasonal roads, local and federal railroads, river and oceanic ports have been developed to allow the flow of goods, services, and people between isolated production centers in Siberia and consumers in European Russia and abroad. Majority transportation facilities and linkages in Siberia are located in or traverse through permafrost zones.
The intensive economic development of Russian permafrost regions has been made possible by the evolution of methods for permafrost engineering and construction (Shiklomanov 2005, Shiklomanov et al 2017a). These methods are generally expensive; the construction, maintenance, and support of buildings and diverse infrastructure within Russian permafrost regions has required continuous and substantial investments in labor and material resources over the course of a century. Ongoing and projected changes in climate conditions, which were not anticipated during construction, could be a significant risk to infrastructure built on permafrost, and could result in increased regional and federal economic burdens (Porfiriev 2016, Kattsov et al 2017, Porfiriev et al 2017).
The northern regions of Eurasia are warming at a rate 2.5 times faster than the global average (Roshydromet 2017). The climate-induced warming and degradation of permafrost is also well documented in many Russian regions (Oberman and Shesler 2009, Drozdov et al 2015, Streletskiy et al 2015a, Romanovsky et al 2018). Several studies have attributed the increase in reported infrastructure damage in the northern regions of Russia to climate-induced permafrost changes (e.g. Khrustalev and Davidova 2007, Anisimov et al 2010, Khrustalev et al 2011, Grebenets et al 2012, Streletskiy et al 2012a, Shiklomanov and Streletskiy 2013). For example, it was estimated that a 1.5 °C increase in mean annual air temperature (MAAT) could potentially trigger deformation of almost all foundations in the city of Yakutsk in Republic of Sakha (Yakutia) (Khrustalev and Davidova 2007). More recent assessments have attributed a 5%–20% decrease in bearing capacity of permafrost foundations in a number of Russian cities due to observed climatic changes (Streletskiy et al 2012a, Streletskiy and Shiklomanov 2016). Furthermore, a widespread reduction in permafrost bearing capacity throughout Russia is expected by mid-21st century (Shiklomanov et al 2017b). However, the economic significance of such changes remains largely unknown, as costs related to permafrost degradation have not been fully integrated into climate change impacts assessments for Russia (Porfiriev et al 2017). This paper attempts to estimate the costs associated with maintaining the present levels of infrastructure in the Russian administrative regions affected by climate-induced permafrost changes by the mid-21st century.
Study area
Our study area corresponds to the Russian permafrost regions, as defined by the International Permafrost Association Circum-Arctic Map of Permafrost and Ground Ice Conditions (hereafter the IPA map) (Brown et al 2002). The IPA map classifies permafrost based on: (1) its extent (the percent of occupied area) into continuous (90%–100%), discontinuous (50%–90%), sporadic (10%–50%), and island (less than 10%) permafrost zones; and (2) permafrost ice content into high, moderate, and low ice content classes.
The Russian administrative division used in this study is based on the Russian Census of 2002. The 2002 Census allows more spatially-detailed regional analyses, since several Arctic regions were merged together in latest 2010 Russian census. The latest available (2016) population data for each of the 2002 administrative regions were obtained from the Russian Federal Statistics data portal (http://cbsd.gks.ru/).
Out of 28 permafrost-affected Russian administrative regions, only 14 have more than 50% of their territory underlain by permafrost. In some administrative regions, permafrost is found in areas with almost no population and/or development. For example, in the European part of Russia, one fifth of Murmansk Oblast contains permafrost. However, permafrost in that region is sporadic, making it possible to avoid perennially frozen sediments during construction. Similarly, 10% of the Arkhangelsk Oblast is underlined by permafrost, but the region contains mostly rural villages with traditional subsistence economies and lacks major infrastructure. Several Siberian (Altay Kray, Republics of Tuva, Kemerovo, Irkutsk Oblast, Buryat Republic, Zabaykale and Amur Oblast) and Far Eastern (Sakhalin Oblast) regions have no significant population or infrastructure in their rather extensive permafrost areas. Infrastructure development is also restricted in regions with mountain permafrost (e.g. Perm Kray, Sverdlovsk and Chelyabinsk Oblast). Due to the minimal economic impact of climate-induce permafrost warming and thawing in those regions, they were excluded from the analysis. As a result, the analysis focused on nine Russian administrative regions where economic activity is significantly affected by the presence of permafrost (figure 1).
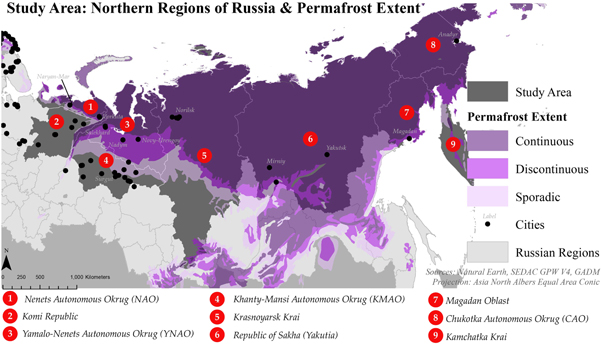
Figure 1. Permafrost distribution and administrative division of Russia. The boundaries of nine administrative regions considered in this study are shown in gray. Location of major cities is shown with black circles.
Download figure:
Standard image High-resolution imageMethods and data availability
Infrastructure inventory and fixed assets on permafrost
The infrastructure inventory for selected regions was created using latest available official statistics from the Rosstat, which provides data for annual costs of residential real estate (thereafter buildings) and for the following five categories of capital fixed assets: (1) non-residential commercial and social structures (e.g. hospitals, schools, universities, airports, railway stations etc) (2) critical infrastructure (e.g. roads, railroads, pipelines, bridges), (3) heavy machinery and industrial equipment, (4) transportation machinery (e.g. vehicles, ships, trains), (5) intangible assets, such as intellectual property. The total original cost of each fixed asset category (e.g. structures and critical infrastructure) aggregated to the level of Russian administrative regions was used. Although almost half of Russian infrastructure has a residual value below 40%, the full cost of fixed assets, which does not account for the amortization and depreciation, is used in the official statistics since a substantial amount of infrastructure in use greatly exceeded its live expectancy and has a residual value of 0 (Porfiriev et al 2017). The spatial extent of some regions, such as Sakha—Yakutia Republic (which is comparable in size to the European Union), and the uneven distribution of regional development requires analysis at sub-regional scale. To alleviate this problem it was assumed that the spatial pattern of the fixed assets within a given region corresponds to that of population: higher and denser population indicates higher fixed assets. As a result, the cost of fixed assets in a given location (e.g. municipality) was estimated using the following equation:

where:
FAm—cost of fixed assets in a municipality
FAreg—cost of fixed assets in an administrative region;
Pm—population of the municipality;
Preg—population of the administrative region.
Following the methodology of Porfiriev et al (2017), only stationary categories of fixed assets, such as structures and critical infrastructure (thereafter infrastructure) were considered for the analysis. It was assumed that other assets could be moved from the areas negatively impacted by permafrost degradation. The Rosstat data on costs of residential real estate was supplemented with the residential buildings inventory from the Russian State Fund for Assistance in the Reform of Housing and Communal Services (ReformaGKH 2018). This source provides data on major characteristics of the residential buildings, such as postal address, year of construction, number of apartments. In order to integrate the residential real estate into the geodatabase, postal addresses were converted to geographic coordinates within ArcGIS 10.5.
Since the exact extent of permafrost under infrastructure is unknown, it was implied that in areas of significant development, permafrost continuity corresponds to the lowest bounds of the permafrost continuity zones. In other words, we assumed that 90% of infrastructure is underlain by permafrost in continuous, 50% in discontinuous, and 10% in sporadic permafrost zones. For island permafrost, it was assumed that permafrost was avoided during construction. As a result, the total regional capital cost of fixed assets directly affected by permafrost was estimated using the following equation:

where
TC is the total cost of infrastructure affected by permafrost in the region,
C is the total cost of infrastructure on continuous permafrost,
D is the total cost of infrastructure on discontinuous permafrost,
S is the total cost of infrastructure on sporadic permafrost.
Climatic conditions
The outputs from six GCM models (CanESM2, CSIRO-Mk3-6-0, GFDL-CM3, HadGEM2-ES, IPSL-CM5A-LR, and NorESM1-M), which participated in the 5th Climate Model Intercomparison Project (CMIP 5), were used to assess climatic changes projected for the mid-21st century. These models were selected based on their ability to accurately reproduce observed surface air temperature trends for the Russian Arctic regions (Anisimov et al 2013, AMAP 2017). CMIP5 GCM output is available at 1 × 1° lat/long for the Northern Eurasia. Daily means of surface air temperature and precipitation, produced by six GCM models were averaged to compile the decadal climatology of daily temperature and precipitations for the present (2006–2015), and mid-21st century (2050–2059) periods. The Representative Concentration Pathway (RCP) 8.5 scenario was used for mid-21st century projections as it represents the most likely near-term scenario and provides the worst-case outcome for risk assessment and gives the upper limit of potential costs.
Permafrost–geotechnical modeling
An equilibrium model of permafrost-climate interactions was used to estimate permafrost temperature and active layer thickness (ALT) within the study area under present and mid-21st century climatic conditions. The model is based on the Kudryavtsev solution of nonlinear heat transfer equations with phase changes through snow, vegetation, organic, and mineral substrate with variable thermal properties (Shiklomanov and Nelson 1999, Sazonova and Romanovsky 2003). Daily means of air temperature and precipitation were used as climatic forcing. Snow depth was estimated from precipitation using average snow density of 300 kg m−3. The model was extensively validated by empirical observations (Shiklomanov and Nelson 1999, Streletskiy et al 2012c) and was used in climate change applications in Russia (Anisimov and Reneva 2006, Shiklomanov and Streletskiy 2013, Streletskiy 2015b, Shiklomanov et al 2017b).
The differences in permafrost properties between two decades were calculated and scaled to 0.25° grid using ordinary kriging. The average, minimum, maximum and standard deviation of permafrost estimates produced with the climate outputs from six individual GCMs were calculated for each grid node to evaluate central tendency and variability due to differences in climatic forcing.
Impacts of permafrost degradation on infrastructure
Within the framework of this study, we have considered two major risks to buildings and infrastructure associated with permafrost degradation under projected climatic conditions: (1) ground subsidence and (2) a decrease in the ability of permafrost to carry structural load (or bearing capacity). Ground subsidence is associated with the melting of spatially-heterogeneous ground ice, accompanied by the consolidation of sediments under progressive thickening of the active layer. This process can be a major hazard for critical infrastructure (e.g. roads, railroads) and, as a result, can negatively impact the connectivity and accessibility of northern communities by land. The bearing capacity of foundations on permafrost is dependent on permafrost characteristics. Permafrost warming, accompanied by increase in the ALT, can reduce the ability of foundations to support buildings and structures, leading to deformations and ultimately structural failure.
Spatial estimates of the potential thaw subsidence across Russian permafrost regions were produced using an approach developed by (Nelson et al 2001). The method utilizes ground ice content information from the IPA Permafrost map and relative climate-induced changes in the ALT, as estimated by the permafrost model forced by GCM-produced decadal climates. The following formula was used to estimate ground subsidence.

where
S—is thaw subsidence (m),
dZ the difference in active-layer thickness between contemporary and mid-21st century decadal periods (m)
I—ground ice content (%),
Bearing capacity was estimated using a geotechnical model developed by (Streletskiy et al 2012b). The model estimates the maximum structural load which can be carried by a standard foundation pile inserted to a given reference depth into the permafrost. To apply this model for spatial assessments of potential changes in stability of buildings and structures on permafrost, we assumed that these buildings and structures were erected on piles with ventilated crawl spaces. Such 'passive principle of permafrost construction' is aimed at maintaining the frozen state of the ground during construction and the lifespan of buildings (Shur and Goering 2009). It is the most commonly used approach to construction in Russian permafrost regions. The ground thermal regime is assumed to be unaffected by thermal input from the structure and no engineering solutions (except for the ventilated crawl space) were assumed to have been implemented to control ground thermal regime over the lifespan of the structures. No snow accumulation or vegetation growth was assumed possible under the buildings (Khrustalev et al 2011). The model input consists of spatially and temporally variable permafrost conditions (temperature and active-layer thickness) and standard pile characteristics. While foundation can vary between structures, the use of standard pile characteristics is suitable for assessing differences in geotechnical properties of permafrost between different territories and over various time intervals (Grebenets et al 2012). The relative changes in bearing capacity due to climate-induced changes in permafrost properties between two decadal climatic periods were used to assess the potential risks to infrastructure, regardless of structure-specific engineering designs. This method was previously applied for evaluation of ongoing (e.g. Streletskiy et al 2012a, Streletskiy and Shiklomanov 2016) and future (e.g. Shiklomanov et al 2017b, Streletskiy 2015b) changes in permafrost bearing capacity for several large cities on permafrost in Russia.
Spatial estimates of potential ground subsidence and changes in permafrost bearing capacity, attributable to changes in climatic conditions between the present and mid-21st century, were used to delineate areas with climate-induced risks to buildings and infrastructure.
Estimating the economic impacts of projected permafrost changes
To estimate the economic impacts of projected permafrost changes on human infrastructure we have applied the 'stressor-response approach' (Melvin et al 2017), which considers environmental stressors (e.g. ground subsidence, decrease in bearing capacity) and infrastructure replacement costs. The asset preservations strategy, which assumes maintaining the present quantity of all engineered structures to the mid-21 century, was used for analysis. Within the framework of the stressor-response model, the following stressor thresholds triggered the response: (1) for infrastructure: the ground subsidence exceeding 0.10 m; (2) for residential buildings and non-residential structures: ≥50% decrease in foundation bearing capacity. It was assumed that crossing these thresholds caused substantial damage to assets, requiring their replacement. The regional costs, associated with climate-induced permafrost hazards, were estimated as a ratio of cost of asset affected by environmental stressors to the total regional costs of the asset. The 2016 Gross Regional Products data were used to estimate the replacement costs of assets under the risk of being damaged due to permafrost changes relative to regional budgets. The costs were converted from Russian Rubles to USD using the reference Purchase Power Parity conversion of 24RUB/USD, as suggested by the Organization of Economic Cooperation and Development (OECD 2018). The integrative spatial analysis was performed using ArcGIS 10.5 and spatial database containing all available socio-economic (e.g. population, infrastructure, cost of assets) and environmental (climate, permafrost) data.
Results and discussion
Climate change by mid-21 century in the permafrost regions of Russia
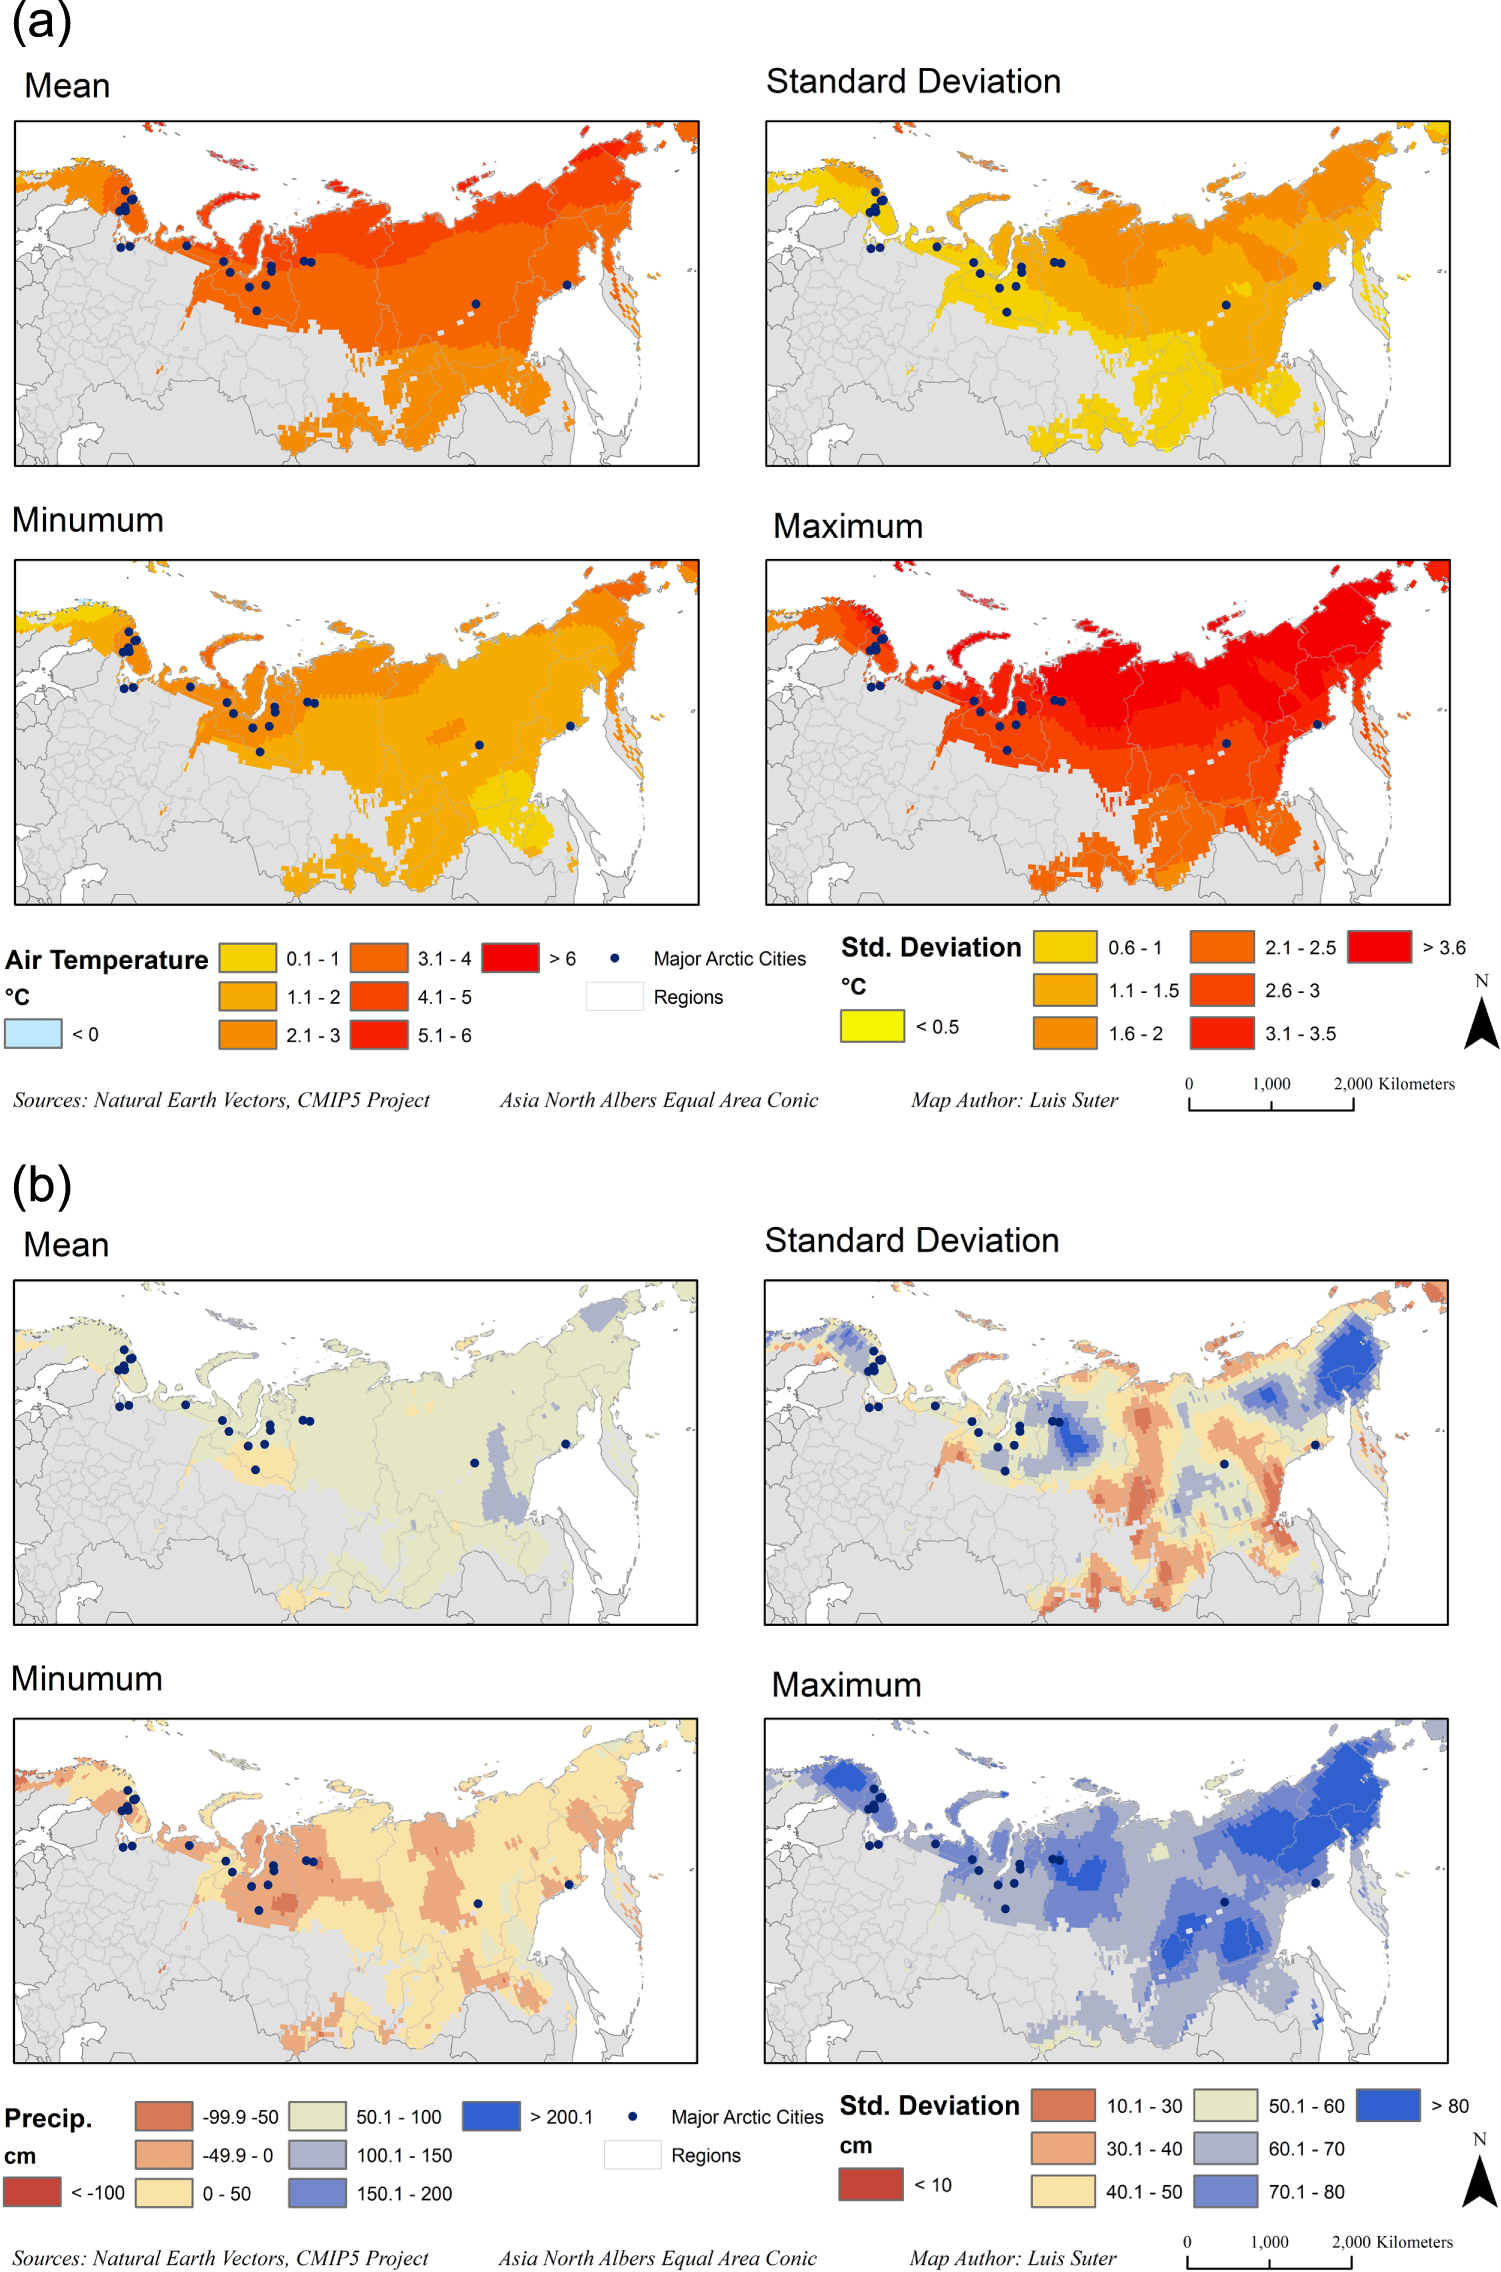
The average increase in the MAAT between decades of 2006–2015 and 2050–59 projected by ensemble of six CMIP 5 models under the RCP 8.5 scenario for Russian permafrost regions is 3.8 °C (figure 2(a)). The highest and lowest temperature increases are projected by the GFDL and the CSIRO models respectively. The spatial pattern of projected MAAT increase is consistent for six models: regions bordering the Arctic Ocean (e.g. NAO, YNAO, and CAO) have generally higher projected temperature increases. Below average increases are found in the southern permafrost regions (e.g. Komi Republic, KMAO, Kamchatka Krai, Magadan Oblast). The large North–South gradient in MAAT increases are evident within the large administrative regions such as Krasnoyarsk Krai and Sakha Republic: the MAAT in the northern parts of these regions are projected to increase by more than 5 °C while the southern parts by less than 3 °C (table 1). The models-produced precipitation changes between decades of 2050–2059 and 2006–2015 are less consistent (figure 2(b)). Similarly to temperature, GFDL projected the highest precipitation increases and CSIRO the lowest. However, the range of projected precipitation changes is much larger than MAAT, especially in coastal areas. Generally, regions influenced by Atlantic and Pacific maritime air masses are projected to have higher precipitation increases comparing to more continental areas. Komi Republic and CAO showed the highest precipitation increase of >85 mm, while central parts of West Siberian and Sakha Republic was characterized by <60 mm increases (table 1). The six-model ensemble average precipitation increase for the Russian permafrost regions is 70 mm.

Figure 2. (a) Mean annual temperature and (b) total precipitation, change between decades of 2005–2015 and 2050–2059 under RCP 8.5 scenario produced from six CMIP5 models.
Download figure:
Standard image High-resolution imageTable 1. Changes in climate and permafrost characteristics in the study regions by 2050–2059 relative to 2006–2015.
| District | MAAT, °C (min, max) | Precipitation, mm (min, max) | MAGTa, °C (min, max) | ALTb, m* (max) | Bearing capacity, % (min, max) | Ground subsidence, cm (min, max) |
|---|---|---|---|---|---|---|
| Komi Republic | 3.61 | 84 | 3.49 | 0.50 | −32 | 12 |
| (3.19, 4.08) | (63, 96) | (2.98, 4.03) | (0.68) | (−17, −54) | (3, 29) | |
| Nenets AO | 3.90 | 75 | 3.85 | 0.39 | −33 | 14 |
| (3.39, 4.84) | (60, 94) | (3.35, 4.77) | (0.74) | (−21, −45) | (3, 29) | |
| Khanty-Mansi AO | 3.35 | 48 | 3.08 | 0.18 | −31 | 7 |
| (3.10, 3.54) | (28, 85) | (2.92, 3.24) | (0.42) | (−12, −48) | (3, 18) | |
| Yamalo-Nenets AO | 3.87 | 59 | 3.77 | 0.57 | −30 | 14 |
| (3.33, 4.74) | (32, 87) | (3.06, 4.80) | (0.76) | (−6, −48) | (4, 30) | |
| Krasnoyarsk Krai | 3.99 | 74 | 3.99 | 0.56 | −27 | 11 |
| (2.41, 5.47) | (44, 96) | (2.02, 5.50) | (0.68) | (−8, −53) | (1, 27) | |
| Republic of Sakha (Yakutia) | 3.81 | 74 | 3.87 | 0.53 | −20 | 13 |
| (2.85, 5.21) | (38, 114) | (2.80, 5.25) | (0.60) | (−3, −50) | (4, 25) | |
| Kamchatka Krai | 3.53 | 66 | 3.53 | 0.37 | −30 | 7 |
| (2.46, 4.00) | (49, 83) | (2.66, 4.03) | (0.63) | (−12, −51) | (3, 25) | |
| Magadan Oblast | 3.66 | 78 | 3.71 | 0.53 | −23 | 15 |
| (3.41, 4.01) | (51, 108) | (3.38, 4.08) | (0.60) | (−4, −42) | (3, 24) | |
| Chukotka AO | 4.51 | 89 | 4.55 | 0.59 | −27 | 13 |
| (3.72, 5.66) | (58, 129) | (3.74, 5.70) | (0.71) | (−4, −48) | (3, 28) |
aMAGT—mean annual ground temperature. bALT—active layer thickness (for areas where near-surface permafrost remains by 2050–2059).
Permafrost degradation and related hazards
The projected air temperature and precipitation (snow) increases, will have significant effect on permafrost temperature and the thickness of the active layer (table 1). Permafrost changes are most pronounced in the continuous permafrost zone of northern regions, especially in NAO and CAO. The magnitude and spatial pattern of projected permafrost changes corresponds well to observed permafrost trends in Russia where permafrost temperature has increased by up to 2 °C over 30 year period, with some sites as much as 1 °C over the last decade (Romanovsky et al 2010, Drozdov et al 2015). ALT was estimated to increase by more than 0.5 m with northern parts of NAO, YNAO and CAO experiencing more than 0.7 m increase, while regions located on discontinuous permafrost have generally lower increases of up to 0.4 m. These trends are in line with historical trends characteristic of the Russian permafrost regions, where sites generally showed 0.1–0.2 m increases per decade (Streletskiy et al 2015b).
The projected increases in permafrost temperature and the thickness of the active layer will greatly affect engineering properties of permafrost causing decrease in its ability to support structures. Our estimates using mean of six-GCM ensemble suggest that the several Russian permafrost regions will experience decrease in bearing capacity of more than 50% by the decade of 2050–2059 (figure 3(a)). The pattern of bearing capacity change is somewhat different from projected changes in permafrost temperature. For example, the higher increases of permafrost temperature are expected in the most northern regions (e.g. Chukotka AO), while the highest decrease in permafrost bearing capacity is projected for the southern, most populated and developed regions of NAO, YNAO, KMAO and Komi Republic. This stems from nonlinear dependence of permafrost bearing capacity with temperature. Bearing capacity of cold permafrost is less sensitive to changes in ground temperature relative to warmer permafrost. This makes southern permafrost regions more vulnerable to loss of bearing capacity per degree of ground temperature change. The areas of substantial oil and gas development and cities like Salekhard, Nadym, Novyy-Urengoy, Vorkuta, and Norilsk and many municipalities located in the northern part of Krasnoyarsk Krai and Sakha Republic are expected to experience substantial decreases in bearing capacity.

Figure 3. (a) Changes in permafrost bearing capacity (%) and (b) ground subsidence (m) between decades of 2005–2015 and 2050–2059 under RCP 8.5 produced from six CMIP5 models.
Download figure:
Standard image High-resolution image
The assessment of projected active-layer increases in regions characterized by ice-rich permafrost was used as an indicator of potential ground subsidence. Ice-rich permafrost regions of Sakha Republic and YNAO are projected to have the highest ground subsidence. This is likely to decrease stability of critical infrastructure and negatively impact accessibility of the economic centers (table 1). For example, roads and railroads in the vicinity of Yakutsk (the major urban center in Republic of Sakha (Yakutia)) are expected to be negatively affected by ground subsidence despite relatively small changes in bearing capacity projected for the city buildings. In YNAO, the projected increase in ground subsidence is likely to impact linear structures associated with oil and gas production (e.g. pipelines) which can destabilize the economic activities in the regional centers like Nadym and Novyy-Urengoy (figure 3(b)).
Population and infrastructure
According to our estimates, the total population of the Russian permafrost regions was 5.4 mil, or about 4% of the total Russian population in 2016. Almost five million people resided in the nine regions selected for the analysis in this study. Four regions: Komi Republic, YNAO, KMAO, and Sakha have a combined population of almost 4 million (table 2). In YNAO, KMAO and Magadan Oblast, more than 80% of population was urban, while CAO and Sakha had a slightly lower urbanization of 70%. Several large cities located in the study area: Magadan, Labitnangy, Nadym, Norilsk, Novyy Urengoy, Salekhard, Vorkuta, and Yakutsk had combined population of almost 0.9 million, which is comparable to the total population of the North American Arctic (Alaska and Northern Provinces of Canada).
Table 2. Major demographic and economic characteristics of the study regions on permafrost.
| Region | Gross Regional Product (2016), Bln USD | Population (1000 s) | Urban Population (1000 s) | Population by Permafrost Extent Zone (C, D, S + I/No Permafrost). % | Key Economic Activities | Largest Cities on Permafrost | Total cost of fixed assets, Bln USD | Cost of structures, Bln USD, | Cost of infrastructure, Bln USD | Cost of buildings, Bln USD, | Cost of structures potentially affected, Bln USD, | Cost of infrastructure potentially affected, Bln USD | Cost of buildings potentially affected, Bln USD, |
|---|---|---|---|---|---|---|---|---|---|---|---|---|---|
| Komi Republic | 8.497 | 856.8 | 667.1 | 8, 1, 4/87 | Coal, timber | Vorkuta; Inta | 127.15 | 11.58 | 81.42 | 28.6 | 0.88 | 6.18 | 2.17 |
| Nenets AO | 3.81 | 43.9 | 31.8 | 72, 7, 15/6 | Oil and gas | Naryan-Mar | 31.47 | 2.87 | 20.15 | 2.37 | 2.15 | 15.09 | 1.77 |
| Khanty-Mansi AO | 45.203 | 1626.8 | 1500.4 | 2, 3, 35/60 | Oil | Khanty-Mansiysk, Surgut | 468.89 | 34.99 | 345.09 | 89.63 | 0.52 | 5.17 | 1.34 |
| Yamalo-Nenets AO | 29.271 | 534.1 | 446.9 | 45, 43, 12/0 | Gas, Oil | Salekhard, Nadym | 419.42 | 38.76 | 309.49 | 20.55 | 17.23 | 137.55 | 9.13 |
| Krasnoyarsk Krai | 26.335 | 443.5 | 323.5 | 8, 2, 2/88 | Metals, port | Norilsk, Dudinka, Igarka | 134.47 | 28.98 | 70.61 | 88.43 | 2.58 | 6.29 | 7.88 |
| Republic of Sakha (Yakutia) | 12.948 | 959.7 | 627.8 | 91, 7, 2/0 | Coal, gas diamonds | Yakutsk, Mirny | 72.52 | 15.63 | 38.08 | 30.31 | 13.35 | 32.52 | 25.88 |
| Kamchatka Krai | 2.955 | 316.1 | 246.0 | 2, 3, 35/60 | Gas | NA | 20.86 | 4.5 | 10.95 | 13.08 | 0.16 | 0.38 | 0.46 |
| Magadan Oblast | 2.25 | 146.4 | 139.8 | 31, 66, 0/3 | Metals, coal, | Magadan, Susuman | 10.79 | 2.32 | 5.66 | 5.09 | 1.30 | 3.17 | 2.85 |
| Chukotka AO | 1.007 | 50.2 | 34.7 | 89, 0, 0/11 | Metals | Anadyr, Pevek | 5.89 | 1.27 | 3.09 | 1.18 | 1.17 | 2.86 | 1.09 |
| Permafrost regions total | 132.276 | 4977.5 | 4018 | 1291.46 | 140.9 | 884.54 | 279.24 | 39.34 | 209.21 | 52.58 | |||
The total value of fixed assets in nine administrative regions on permafrost was 1.29 trillion USD, or about 17% of Russia's total. Almost 79% of fixed assets in permafrost-affected regions were in non-residential buildings and critical infrastructure categories worth of 140.9 bln USD and 884.5 bln USD, respectively. Residential real estate was valued at 279.2 bln USD. The largest contribution to overall cost of assets was provided by the West Siberian regions of YNAO and KMAO. The values of fixed assets in CAO and Magadan Oblast were the lowest among nine regions. Details on distribution of fixed asset costs among regions are shown in table 2.
The amount and cost of infrastructure affected by permafrost varies among nine study regions (table 2). Although the Komi Republic is mainly located outside the permafrost region, the highly-developed coal industry center of Vorkuta is built on permafrost. As a result, as much as 8% of unmovable fixed assets in Komi are affected by permafrost. On the other hand, due-to the large expanse of permafrost in the neighboring Nenets Autonomous Okrug (NAO), approximately 75% of its infrastructure is erected on permafrost while the total value of fixed assets in NAO is four times smaller than in Komi Republic. Permafrost regions of YNAO, located in West Siberia, contain 17.23 bln USD worth of structures and 137.55 bln USD worth of critical infrastructure, which corresponds to 44% and 66% of the total cost of these types of assets on permafrost in Russia. The high cost of infrastructure on permafrost in YNAO is attributable to intensive oil and gas development. The infrastructure and population are concentrated in several areas of continuous (Yamalskiy and Tazovskiy) and discontinuous (Salekhard, Labytnangy, Novyy Urengoy, Nadym) permafrost zones of YNAO. Further south, in the Khanty-Mansi Autonomous Okrug (KMAO), substantial population resides within the sporadic permafrost zone (Kogalym, Beloyarskiy, Raduga). Although oil- and gas-related infrastructure transverse permafrost regions of KMAO, the value of permafrost-affected assets in KMAO is less than 2% of the total regional cost of fixed assets. In Central Siberia, more than a half of Krasnoyarsk Krai is occupied by permafrost. However, the permafrost regions of Krasnoyarsk Krai are sparsely populated except the Norilsk—Dudinka urban and industrial region, which contains almost 9% of the regional assets and located within continuous permafrost zone. To the east, the Republic of Sakha has more than 85% of assets located in permafrost areas, particularly in the cities of Yakutsk, Neryungri and Mirnyy. In the Far East of Russia the majority of CAO assets are in the continuous permafrost zone around the city of Anadyr. Although majority of Magadan Oblast is underlined by permafrost, the infrastructure is concentrated in vicinity of Magadan in a discontinuous permafrost zone. Overall, about 56% of assets are located in permafrost regions of Magadan Oblast. Although the value of assets in Kamchatka Krai exceeding that of CAO and Magadan Oblast combined, only less than 4% of these assets are affected by permafrost.
The total cost of fixed assets affected by permafrost in the nine administrative regions in 2016 was 248.6 bln USD or 7.5% of Russian GDP for that year. The total value of residential real estate on permafrost was estimated to be 52.6 bln. A highest total costs of real estate on permafrost are estimated for Sakha (25.9 bln), YNAO (9.1) and Krasnoyarsk Krai (7.9 bln). However, the relative proportion of buildings on permafrost is highest for CAO (92%), followed by Sakha (85%), and NAO (75%).
The cost of permafrost degradation by the mid-21st century
The cost of projected climate–induced permafrost changes is based on average values of the six climate models and provides the best point-estimate of buildings and infrastructure affected by loss of bearing capacity and ground subsidence. The agreement between the climate input and associated changes in permafrost estimates vary in-between and within the regions adding to various degree of uncertainty of estimated costs of climate impacts (table 1, figures 2 and 3). For example, Komi Republic is characterized by close agreement between climate models, while CAO has substantial variability in both temperature and precipitation estimates resulting in various degree of uncertainty of permafrost estimates. In order to provide standardized measure of variability about the mean that can be used across the study regions, the deviation of 5% and 1 cm around the mean were used for the bearing capacity and ground subsidence assessments, respectively. According to average estimates, the total cost of infrastructure impacts associated with the climate-induced permafrost changes in Russia would reach 105.07 bln USD by the mid-21st century. Among the nine Russian administrative regions with permafrost the highest costs are expected in YNAO and Sakha with 52.33 bln USD and 21.26 bln USD, respectively (table 3). Komi Republic, NAO, and Krasnoyarsk Krai would incur 8.5 bln to 10 bln USD in additional costs while projected costs for KMAO (1.46 bln USD), CAO (1.90 bln USD), Magadan Oblast (1.0 bln USD) and Kamchatka Krai (0.1 bln USD) will be relatively low. However even relatively small changes in permafrost bearing capacity and ground subsidence may substantially increase these estimates, particularly in the regions east of Krasnoyarsk Krai (table 3).
Table 3. Percentage of buildings, structures and infrastructure affected by permafrost degradation by the mid-21 century and associated regional costs.
| Administrative region | Buildings affected (%) | Structures affected (%) | Infrastructure affected (%) | Cost of buildings affected (bln USD) | Cost of structures affected (bln USD) | Cost of infrastructure affected (bln USD) | Mean total cost of impacts (bln USD; +/− variability) | Cost of impacts relative to GRP (2016) (%; +/− variability) |
|---|---|---|---|---|---|---|---|---|
| Komi Republic | 100.0 (100.0/100.0) | 94.7 (89.6/99.8) | 89.1 (89.1/89.1) | 2.17 (2.17/2.17) | 0.83 (0.79/0.88) | 5.51 (5.51/5.51) | 8.51 (8.46/8.55) | 2.2 (2.2/2/2) |
| Nenets AO | 99.0 (0.3/99.1) | 40.0 (35.9/44.2) | 40.0 (36.2/43.8) | 1.75 (0.01/1.75) | 0.86 (0.77/0.95) | 6.04 (5.46/6.61) | 8.65 (6.24/9.31) | 5.0 (3.6/5.4) |
| Khanty-Mansi AO | 4.1 (0.0/60.9) | 0 (0.0/28.2) | 27.2 (27.2/27.2) | 0.05 (0.0/0.82) | 0.00 (0.15/0.00) | 1.41 (1.41/1.41) | 1.46 (1.41/2.37) | 0.1 (0.1/0.1) |
| Yamalo-Nenets AO | 99.8 (79.1/ 99.8) | 30.5 (24.6/36.5) | 27.6 (22.5/ 32.6) | 9.11 (7.22/9.11) | 5.26 (4.23/6.28) | 37.96 (30.88 /45.05) | 52.33 (42.33/60.44) | 4.0 (3.2/4.6) |
| Krasnoyarsk Krai | 74.4 (0.1/99.4) | 4.1 (0/27.8) | 63.1 (62.6/63.6) | 5.87 (0.01/7.83) | 0.11 (0.0/0.72) | 3.97 (3.94/4.00) | 9.94 (3.94/12.55) | 0.8 (0.3/1.1) |
| Republic of Sakha (Yakutia) | 6.5 (0.0/97.7) | 64.8 (41.1/88.5) | 33.6 (29.6/37.6) | 1.69 (0.0/25.3) | 8.65 (5.48/11.82) | 10.93 (9.63/12.23) | 21.26 (15.11/49.34) | 3.7 ( 2.6/8.5) |
| Kamchatka Krai | 0.0 (0.0/0.0) | 27.0 (9.1/44.9) | 5.8 (3.00/8.6) | 0.00 (0.0/0.0) | 0.04 (0.01/0.07) | 0.02 (0.01/0.03) | 0.07 (0.03/0.10) | 0.1 (0.0/0.1) |
| Magadan Oblast | 2.6 (0.0/97.2) | 5.1 (0.0/43.3) | 25.8 (24.2/27.5) | 0.08 (0.0/2.77) | 0.07 (0.0/0.56) | 0.82 (0.77/0.87) | 0.96 (0.77/4.20) | 1.0 (0.8/4.2) |
| Chukotka AO | 0.6 (0.6/81.0) | 74.6 (41.2/100) | 35.7 (34.6/36.8) | 0.01 (0.01/0.88) | 0.87 (0.48/1.17) | 1.02 (0.99/1.05) | 1.90 (1.48/3.11) | 4.2 (3.3/6.9) |
| TOTAL | 53.8 (29.9 /95.2) | 19.7 (11.9/39.7) | 18.8 (16.7/20.9) | 20.71 (9.41/50.63) | 16.69 (11.77 /22.60) | 67.67 (58.59 /76.75) | 105.07 (79.76/149.98) | 1.8 (1.3/2.5) |
*The values show the percent of building, structures and infrastructure affected by the average loss of bearing capacity using ensemble of six CMIP5 models and variability associated with (mean −5%, mean +5%), and average subsidence and variability associated with (mean −1 cm, mean +1 cm).
The incurred costs, attributable to specific permafrost-related environmental stressor (e.g. ground subsidence and loss of bearing capacity), vary between the regions. In the Komi Republic and NAO about third of costs is associated with damages to residential buildings and non-residential structures due to the loss of permafrost bearing capacity. In YNAO and KMAO, majority of expected costs (about 73% and 96%) will result from the deformation of infrastructure due to ground subsidence. In Sakha, the ground subsidence and the loss of bearing capacity will have almost equal economic impact: 49% and 51% respectively. In Krasnoyarsk Krai, 60% of the projected cost is associated with potential damages to residential buildings due to the high susceptibility to permafrost-related infrastructure damage in major urban centers of Norilsk and Dudinka. This is the only region where relative impacts of permafrost degradation on residential housing is higher than on non-residential structures and infrastructure.
To consider the ability of regions to address potential climate impacts, it is critical to evaluate the additional costs incurred due to changing climate in relation to overall economic prosperity of regions. A region with high population, diverse and developed infrastructure, and stable tax base is likely to cope with negative economic impacts of climate change better than a less-developed region. Although the regional economic conditions can fluctuate, the present-day GRP can be used as a proxy for the potential prosperity. To assess the economic resilience of nine Russian permafrost regions to infrastructure damages associated with climate-induced permafrost damage, the estimates of the total regional costs of all potentially-damaged infrastructure were spread equally over the 45 years and related to 2016 GRP of each region. Although such approach does not account for potential transient increase in infrastructure damage and/or potential changes in GRP, it provides a crude measure of the economic ability of each region to mitigate impacts of climate change.
Based on our economic resilience estimates, the financial burden associated with the mitigation of negative impacts related to permafrost degradation is the highest for the NAO, YNAO, and CAO (4%–5% of annual GRP). Although NAO and YNAO are relatively prosperous regions, the amount of critical infrastructure expected to be affected by the ground subsidence in these regions is significant, comparative to their respective GRPs. In CAO, the projected amount of infrastructure damages is much lower. However, this less economically-developed region has a much smaller GRP resulting in high relative costs and low economic resilience. The relative cost of mitigating negative permafrost impacts are also high in Sakha and Komi Republic where additional 3.7% and 2.2% of annual GRP respectively will be required to maintain the existing level of infrastructure. Magadn Oblast and Krasnoyarsk Krai are expected to spend under 1% of their GRPs on mitigating impacts of permafrost degradation. However, for Krasnoyarsk Krai it accounts to a significant additional cost of approximately 10 bln USD. Krasnoyarsk Krai can be considered as a special case due to its enormous size, large GRP, and diversity of environmental conditions. Only norther portion of the region has permafrost, and the permafrost infrastructure is concentrated predominantly in the Norisk-Dudinka urban industrial complex resulting in high economic resilience of the overall region to projected climate-induced permafrost changes. Although KMAO and Kamchatka Krai are much smaller than the Krasnoyarsk Krai, majority of their infrastructure is also located predominantly in non-permafrost areas resulting in smallest relative economic cost of mitigating projected damage to permafrost infrastructure of just under 0.1% of their respective GRPs.
The goal of this research was to evaluate the role of climatically driven changes of permafrost on structures and infrastructure and associated costs at regional scales regardless of the variability in specific construction designs and building standards that were discussed in previous works (Shur and Goering 2009, Streletskiy et al 2012b). The role of non-climatic factors, both human (building standards, adequate maintenance, snow redistribution, waterlogging) and natural (changes in soil moisture and ice content, and frost heave, changes in geochemistry and salinity depressing freezing point of water) should further be considered for more granular analysis. Construction methods such as implementation of longer piles, use of thermosiphons, and proper planning and land use (such as regular snow removal, storm water management) may have significantly offset the negative changes associated with climate warming and decrease the projected costs. However, the improper operation of the structures, snow accumulation, waterlogging and absence of storm water management may accelerate the permafrost degradation and further deteriorate geotechnical environment, therefore increasing the cost of permafrost change.
Conclusions and perspectives
The state of Russian economy strongly depends on the extraction and transportation of mineral resources from the northern and eastern parts of the country affected by the presence of permafrost. Permafrost regions have less than 4% of total Russian population, but account for almost 17% of total Russian cost of fixed assets. These estimates highlight the importance of permafrost in the Russian economy. Almost 80% of the fixed assets on permafrost are in structures and infrastructure which are immobile and therefore highly susceptible to damage due to climate-induced changes in permafrost-conditions. While YNAO and KMAO are administrative regions with highest amount of assets, it is YNAO and Sakha Republic that have the most assets directly affected by permafrost.
The total value of fixed assets that are directly affected by permafrost is estimated to be almost 250 bln USD, which is roughly 7.5% of Russian GDP. Residential real estate on permafrost worth 53 bil USD. Majority of residential housing is concentrated in Sakha Republic, followed by YNAO and Karsnoyarsk Krai. However, the relative proportion of residential buildings affected by permafrost is highest in CAO, followed by Sakha and NAO.
Changes in climatic conditions are expected to increase permafrost temperature and the thickness of the active layer which, in turn, can destabilize geotechnical environment and affect buildings and structures on permafrost. Under the RCP8.5 scenario, climate-induced changes in permafrost conditions (e.g. permafrost temperature and the active-layer thickness) are expected to result in substantial decrease of bearing capacity and, in regions with ice-rich permafrost, increase in differential ground subsidence. These changes are estimated to affect 54% of all residential buildings on permafrost with combined worth of 20.7 bln USD. Moreover, 20% of commercial and industrial structures and 19% in critical infrastructure with a total cost of 84.4 bln USD will be negatively affected by climate-induced permafrost changes. Such high percentage of vulnerable infrastructure can negatively impact the economy of the Russian permafrost regions. The financial burden associated with the mitigation of negative impacts related to permafrost degradation varies from less than 0.1% of GRP in KMAO and Kamchatka Krai to >3% in NAO, YNAO, Sakha, and CAO.
Overall, the widespread impacts of climate-induced permafrost changes are expected to have a pronounced negative effect on infrastructure throughout the Russian permafrost region by the mid-21st century. The potential economic impacts of permafrost changes are estimated to be quite high. Mitigation of negative impact of permafrost degradation will impose additional economic stress on regional and the national Russian economies. While the permafrost infrastructure in the North America and Scandinavia consists primarily of relatively small residential buildings and lightweight industrial facilities, the Russian Arctic is dominated by the massive, heavy-weight, apartment buildings and structures. This might require development of unique and possibly more costly adaptation and mitigation strategies to address negative impacts of permafrost changes in the Russian context. Such strategies are currently under development, at least locally. For example, in the city of Norilsk, the existing foundations on permafrost are reused to support lighter buildings and structures engineered in accordance with the rapidly changing ground thermal regime (Shiklomanov et al 2017a).
While our estimates intent to provide an upper limit of the economic impacts by using the most severe climatic projections (e.g. RCP8.5), they do not account for many direct and indirect linkages and feedbacks between climate, permafrost, and socio-economic systems which can amplify negative economic impacts. These, among others, might include changes in surface and subsurface hydrology, intensified costal erosion, changes in accessibility. The combined economic costs of such changes can greatly increase the estimates provided in this study. However, accounting of such changes requires significant additional research at more localized spatial scales. The establishment of long-term monitoring permafrost network is essential in order to minimize the costs of permafrost changes at federal and state levels, while local municipalities and industries on permafrost should have permafrost monitoring as part of their planning and operational activities.
Acknowledgments
This research was supported by U.S. National Science Foundation (NSF) grants ICER-1558389 and 1717770 'Belmont Forum Collaborative Research: ARCTIC-ERA: ARCTIC climate change and its impact on Environment, infrastructures and Resource Availability', and OISE-1545913 'PIRE: Promoting Urban Sustainability in the Arctic'. Permafrost current state and modeling of future conditions was funded by Russian Foundation for Basic Research (RGBR) project 18-05-60004 'Terrestrial and submarine Permafrost Degradation of the Western sector of the Russian Arctic under climate change: current state, trends, forecast of changes in environmental conditions', the analysis of implications of climate change on administrative regions of the Russian Arctic was funded by RFBR project 18-05-60088 'Urban Arctic resilience in the context of climate change and socio-economic transformations'. Economic analysis in this work funded by RFBR project 18-05-60252 'Regional mechanisms of the Arctic climate variability and their impact on predictability and economic development of the Arctic regions of Russian Federation'; and RFBR joint project 18-00-00600 'Investigating risks of Russia's socio-economic development and the risk governance strategies within global climate change context' (including RFBR18-00-00596 'Scenarios of global climate change and assessments of corresponding impacts on socio-economic development of Russia in the 21st century' and RFBR 18-00-00599 'Analysis and governance strategies of climate risks of the Russia's long-term socio-economic development). Opinions, findings, conclusions, and recommendations expressed in this paper are those of the authors, and do not necessarily reflect the views of NSF or RFBR. We thank two anonymous reviewers for constructive and insightful comments on this manuscript.