
Abstract
Lithium deposition is observed in situ using a microfluidic test cell. The microfluidic device rapidly sets up a steady concentration gradient and minimizes ohmic potential loss, minimizes electrolyte usage, and shows good repeatability. Dendrite growth is observed at different current densities for electrolytes containing lithium hexafluorophosphate or lithium bis(trifluoromethane sulfonyl) imide (LiTFSI) in mixtures of propylene carbonate (PC) and dimethyl carbonate. Dendrites are formed at shorter times in electrolytes containing LiTFSI and high amounts of PC. The time to first observed dendrites increases linearly (for all electrolyte compositions) with a resistance given by the Tafel slope of the lithium reduction polarization curve.
Export citation and abstract BibTeX RIS
Lithium metal is an ideal negative electrode material because it is the lightest metal and very electronegative ( vs the standard hydrogen electrode). These properties lead to a battery system with a high energy density that is attractive for powering electric vehicles.1 Lithium metal batteries consist of lithium (Li) negative electrode, a liquid, solid polymer, or hybrid-gel electrolyte, and a Li insertion compound positive electrode, usually a Li metal oxide. Liquid electrolytes consist of a Li salt, such as lithium hexafluorophosphate
  , in polar aprotic liquid solvent containing ethers and/or alkyl carbonates. Polymer electrolytes consist of a Li salt in a polymer matrix like polyethylene oxide. A hybrid-gel electrolyte consists of both solid polymer and a liquid polar aprotic electrolyte. A passivating layer, called the solid-electrolyte interphase (SEI), forms immediately on the negative electrode when Li is contacted with the electrolyte. The SEI prevents Li corrosion because Li is thermodynamically unstable with all organic solvents.2 The SEI consists of reduction products of the electrolyte and has a major impact on most areas of battery performance, including power density, cycle efficiency and life, and safety.3
At the negative electrode Li is deposited via the following reaction as the battery charges
All attempts to commercialize rechargeable lithium metal batteries since they were first proposed in the early 1970s have failed due to poor cycling and safety performance caused by rough Li deposits formed on the negative electrode during cell charging.4–6 These deposits often take branch or bush like morphologies referred to as dendrites. Dendrites are common during electrodeposition of most metals, e.g., copper, only as the current density approaches the limiting current density.7 However, dendrites form and spread during Li deposition during any polarization after a given time.8, 9 The exact reason for the propensity of Li to assume dendritic morphology is unclear. It is known that local variations of SEI composition and thickness will lead to an uneven current distribution and thus unsmooth deposits.10 The condition of the Li electrode substrate is also known to play a large role in the initiation of dendrites.11
Dendrites grow larger with successive charge/discharge cycles and can eventually lead to active material becoming "free" or "dead." Uneven dissolution often leaves tips that are not in contact with the electrode.12 The Li in the tip of such a dendrite is now electrochemically inactive, decreasing the amount of available Li and the cycling efficiency. This free Li is extremely active chemically because of its large surface area.12 Dendrites can also traverse the separator and cause the battery to short circuit. A short may cause current to rapidly pass through the battery, producing heat that causes thermal runaway, leading possibly to battery explosion.13
Polymer electrolytes are known to inhibit dendrite formation due to the mechanical strength of the separator, but they require an operating temperature around  to obtain conductivities necessary for good battery performance.1 They are also inherently safer than liquid electrolytes because their lack of volatility slows the reaction between the polymer and Li preventing thermal runaway.8 Hybrid-gel electrolytes that attempt to combine the high conductivity of liquid electrolytes with the mechanical strength of solid polymer electrolytes have also been shown to delay the onset of dendrites.14 However, these also exhibit the poor safety performance common with liquid electrolytes.1 Additives are also commonly used to form a good SEI layer that restricts dendrite formation and propagation.12 Other methods used to control dendrites are increasing stack pressure,11, 15 stirring the electrolyte,16 and using pulse plating.17
Epelboin et al.18 first directly observed dendrites using transmission electron microscopy in 1980. Yamaki and co-workers19 observed in situ Li deposition from a liquid electrolyte using optical microscopy in 1993. They found the amount of needle-like Li deposits decreased and cycle life increased with decreasing current density. Osaka et al.20 used a similar method and discovered that adding a second electrolyte component to propylene carbonate, in this case dimethyl ether, provided for better cycling efficiency and smoother deposits.20 Brissot et al.21 published a series of papers that used in situ optical microscopy observations of Li deposition using a solid polymer electrolyte at  . They observed needle shaped dendrites approximately
  in width at
  and attributed their formation to a nonuniform SEI. Bush-shaped dendrites,
  across, were observed at
  . They attributed the formation of these dendrites to a low local concentration of Li near the dendrite. Dendrites were also observed at
  after
after  that shorted the
  wide cell after
  .21 The experimental setup used earlier that combines an optical cell with a microscope to record Li deposition is used for many different liquid and solid electrolytes in the literature.
Dolle et al.22 used in situ SEM to obtain live observations of the Li/polymer interface. These are the best observations of Li dendrites due to the high resolution  and three-dimensional nature of the pictures. They observed longer and thicker dendrites at
  than the small "mossy-like" deposits found at
  . Dendrite growth was observed not only from the tip but also from the base. Further, they also observed a short circuit. Most of the current passed through the dendrite at the time of the short. As a result, Li in the dendrite melted and the polymer burned, stopping dendrite growth.22
Microfluidic devices, with flow channel dimensions usually of  , are common in the fields of medical analysis, environmental monitoring, biochemical analysis, and microchemistry.23 This work uses a microfluidic device, where Li is deposited on copper (Cu) electrodes with an area of
  . Genders et al.24 showed experimental data of Li deposition on
  Cu electrodes was free of ohmic effects. Flow systems with a high Pećlet number
  and a low Reynolds number
  are known to quickly form a steady diffusion layer.25 Willey and West26 demonstrated this experimentally in a microfluidic device for
  between 1200 and 13,000 and
  1–13. This eliminates mass transfer issues caused by a growing diffusion layer. Ambiguities caused by the onset of free convection when studying deposition in a stagnant electrolyte are also eliminated by this device. Willey et al.27 showed experimentally for high Wagner numbers
  the current distribution is uniform across an electrode in the direction of the flow in a similar microfluidic device. Therefore, any deposit roughness will not be caused by a nonuniform current distribution. The microfluidic device in this work uses a relatively small quantity of electrolyte. The time that the first lithium dendrite is observed during galvanostatic deposition shows good experimental repeatability.
The present paper systematically describes the effects of current density, type of electrolyte salt, and electrolyte solvent composition on dendrite initiation and propagation using in situ optical observation with standard electrochemical tests. Liquid electrolytes with "poor" solvents are used to study the worst case scenarios. The hope is that information learned from these scenarios will apply to better liquid and gel-hybrid electrolytes.
Experimental
The experimental setup consisted of a microfluidic flow cell that contained copper working electrodes (WEs) which Li was deposited on. Li was galvanostatically deposited using a Princeton Applied Research model 273A potentiostat. Li deposition was recorded using a Carl Zeiss Stemi 2000-C optical microscope equipped with a PixeLink 623-C digital camera. The (WE) were a Cu wire with a  (bare) diameter with Teflon insulation. The WEs were electropolished in o-phosphoric acid (Fisher Chemical). A new electrode was used for every experiment. The counter electrode (CE) and reference electrode (RE) was another Cu wire located downstream. The flow channels were cut out of
  thick silicone rubber and were
  wide and
  long. The rubber did not swell or react with the electrolyte for at least
  . The wires were embedded into the side of the flow channel. In experiments with a separate RE, like the linear sweep voltammetry used to obtain the Li reduction polarization curves, a third Cu wire located downstream from the CE was used as the RE. Lithium was in situ electrodeposited onto the RE using conditions described by Zhou and Notten28 to produce a reliable Li RE that would be stable for many days.28 Also for these experiments the CE was always located
  downstream from the WE. Electrolyte was introduced to the cell using a New Era Pump Systems NE-500 syringe pump from
  Becton-Dickinson syringes at a rate of
  . This flow rate corresponded to a
  of 4650 and a
  of
of  for
for 
 in propylene carbonate (PC) when using the viscosity and diffusion coefficient reported by Kondo et al.29 The limiting current density (discussed below in more detail) was between 120 and
  for this electrolyte, corresponding to a diffusion layer thickness of 13 and
  . The Wa for this electrolyte was calculated to be 24–96 (depending on the average current density) so the current distribution would be uniform. Figure 1 is a schematic of the experimental setup. The entire system is contained in an argon (Tech Air UHP grade) filled glove box containing under 100 parts per million water. All electrolytes were purchased from Electrolyte Ferro and used as received. Each experiment was repeated five times and the standard deviation was shown by the error bars. A Dell Optiplex GX620 was used to control the potentiostat, digital camera, and the syringe pump.
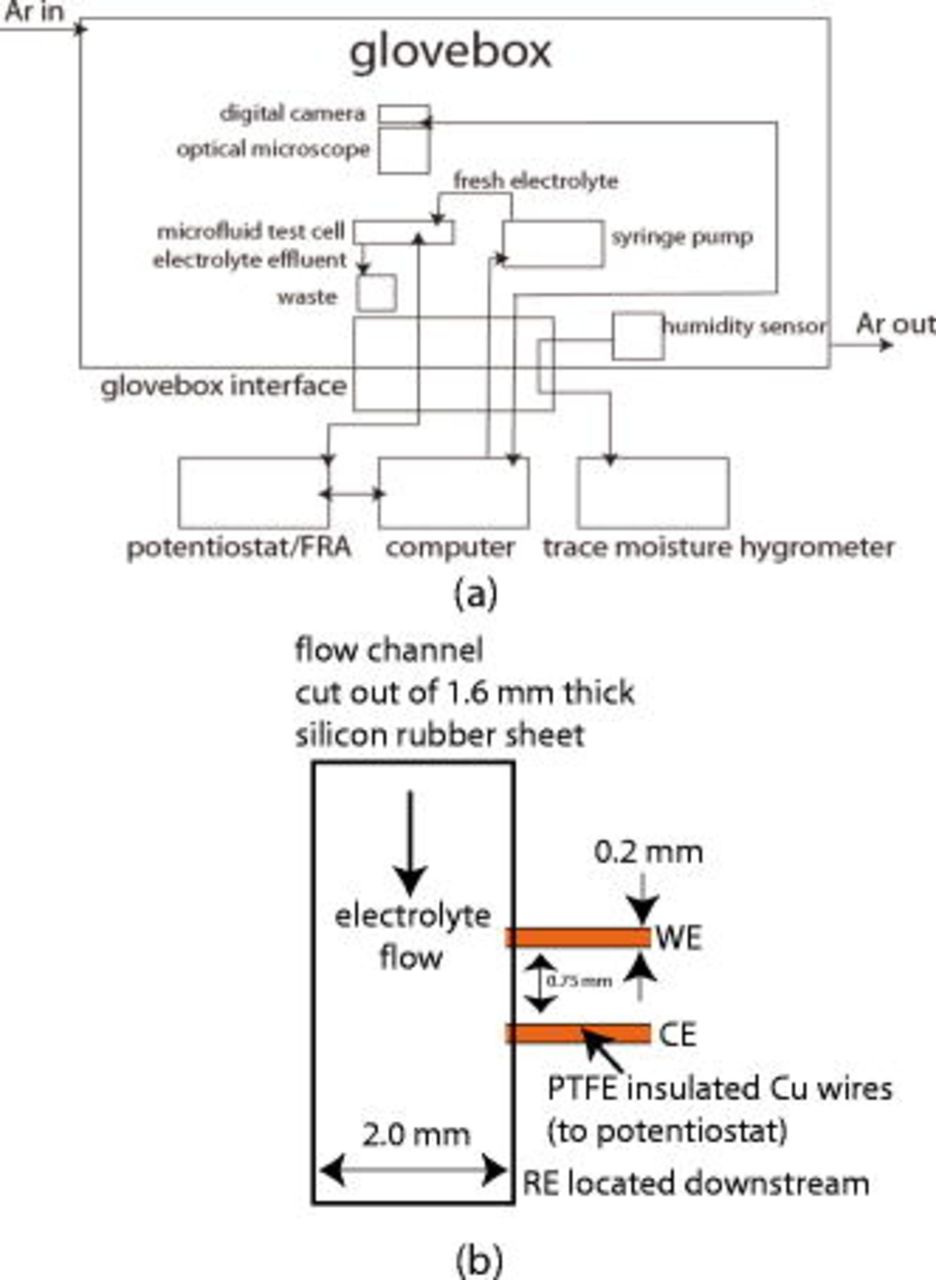
Figure 1. Schematic of test station. (a) The complete test setup showing all equipment. (b) Detail of a section of the microfluidic cell.
Dendrite Initiation Studies
Figure 2 shows side views of the WE obtained during galvanostatic Li deposition. The electrolyte flows past the wire face, from the top to the bottom of the picture. From this view, we can record how far a dendrite has grown from the deposit so it is good for measuring dendrite velocities. However, only a portion of the electrode can be seen from this view so that much of the substrate face is not visible, only the deposit growing out of it is visible. Lithium is deposited from 
 in ethylene carbonate (EC):ethyl methyl carbonate (EMC) (3:7 by weight) at a rate of
  in this experiment. We can see the first dendrite formed around
  . This time is referred to as the time of first observed dendrite,
  . The dendrite quits growing from the tip at
  and starts growing from the base, a phenomenon also observed by Dolle et al.22 In this experiment, the dendrite grows against the direction of fluid flow. While dendrites appear to originate at the electrode edge (as shown here) in greater than half of the depositions, they also first form in the center of the electrode a significant portion of the time. Further, dendrites spread across the electrode regardless of where the first dendrite forms.
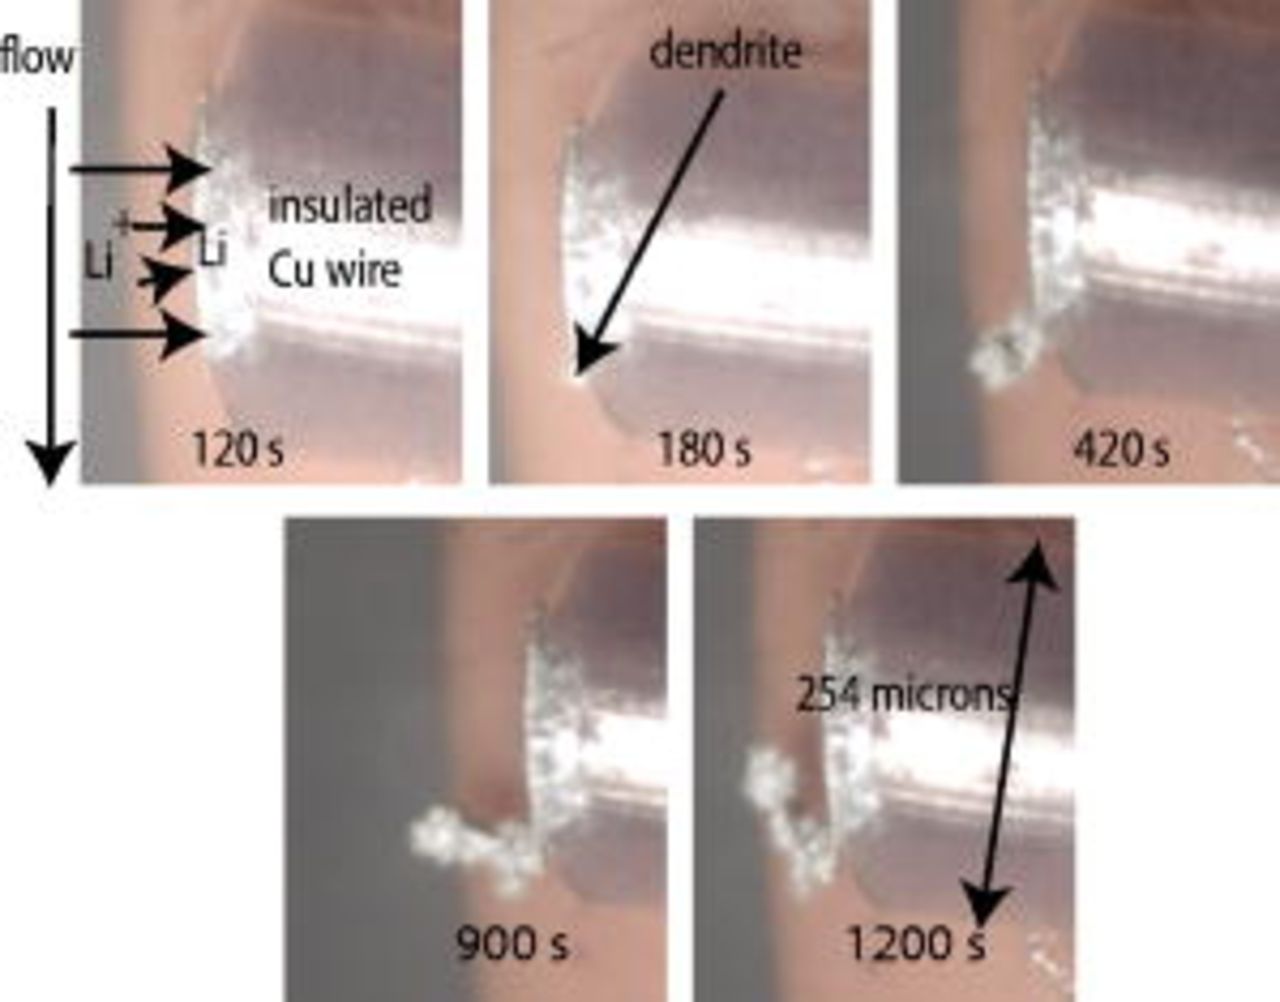
Figure 2. Sample pictures obtained using the side view cell setup. Lithium is deposited at a rate of  from
from 
 in EC:EMC (3:7 by weight). The dendrite is first observed at
  in this deposition.
Figure 3 depicts another type of picture that views the whole electrode. Lithium was deposited from 
 in PC:dimethyl carbonate (DMC) (3:1 by weight) at
  in this experiment. A small rough spot forms at a charge density of
  . This charge is called the charge density of first observed dendrite,
  . This rough spot may not have been seen in the top view pictures shown in Fig. 2. This view was used to determine
  and
and  because small details are observable at an earlier time.
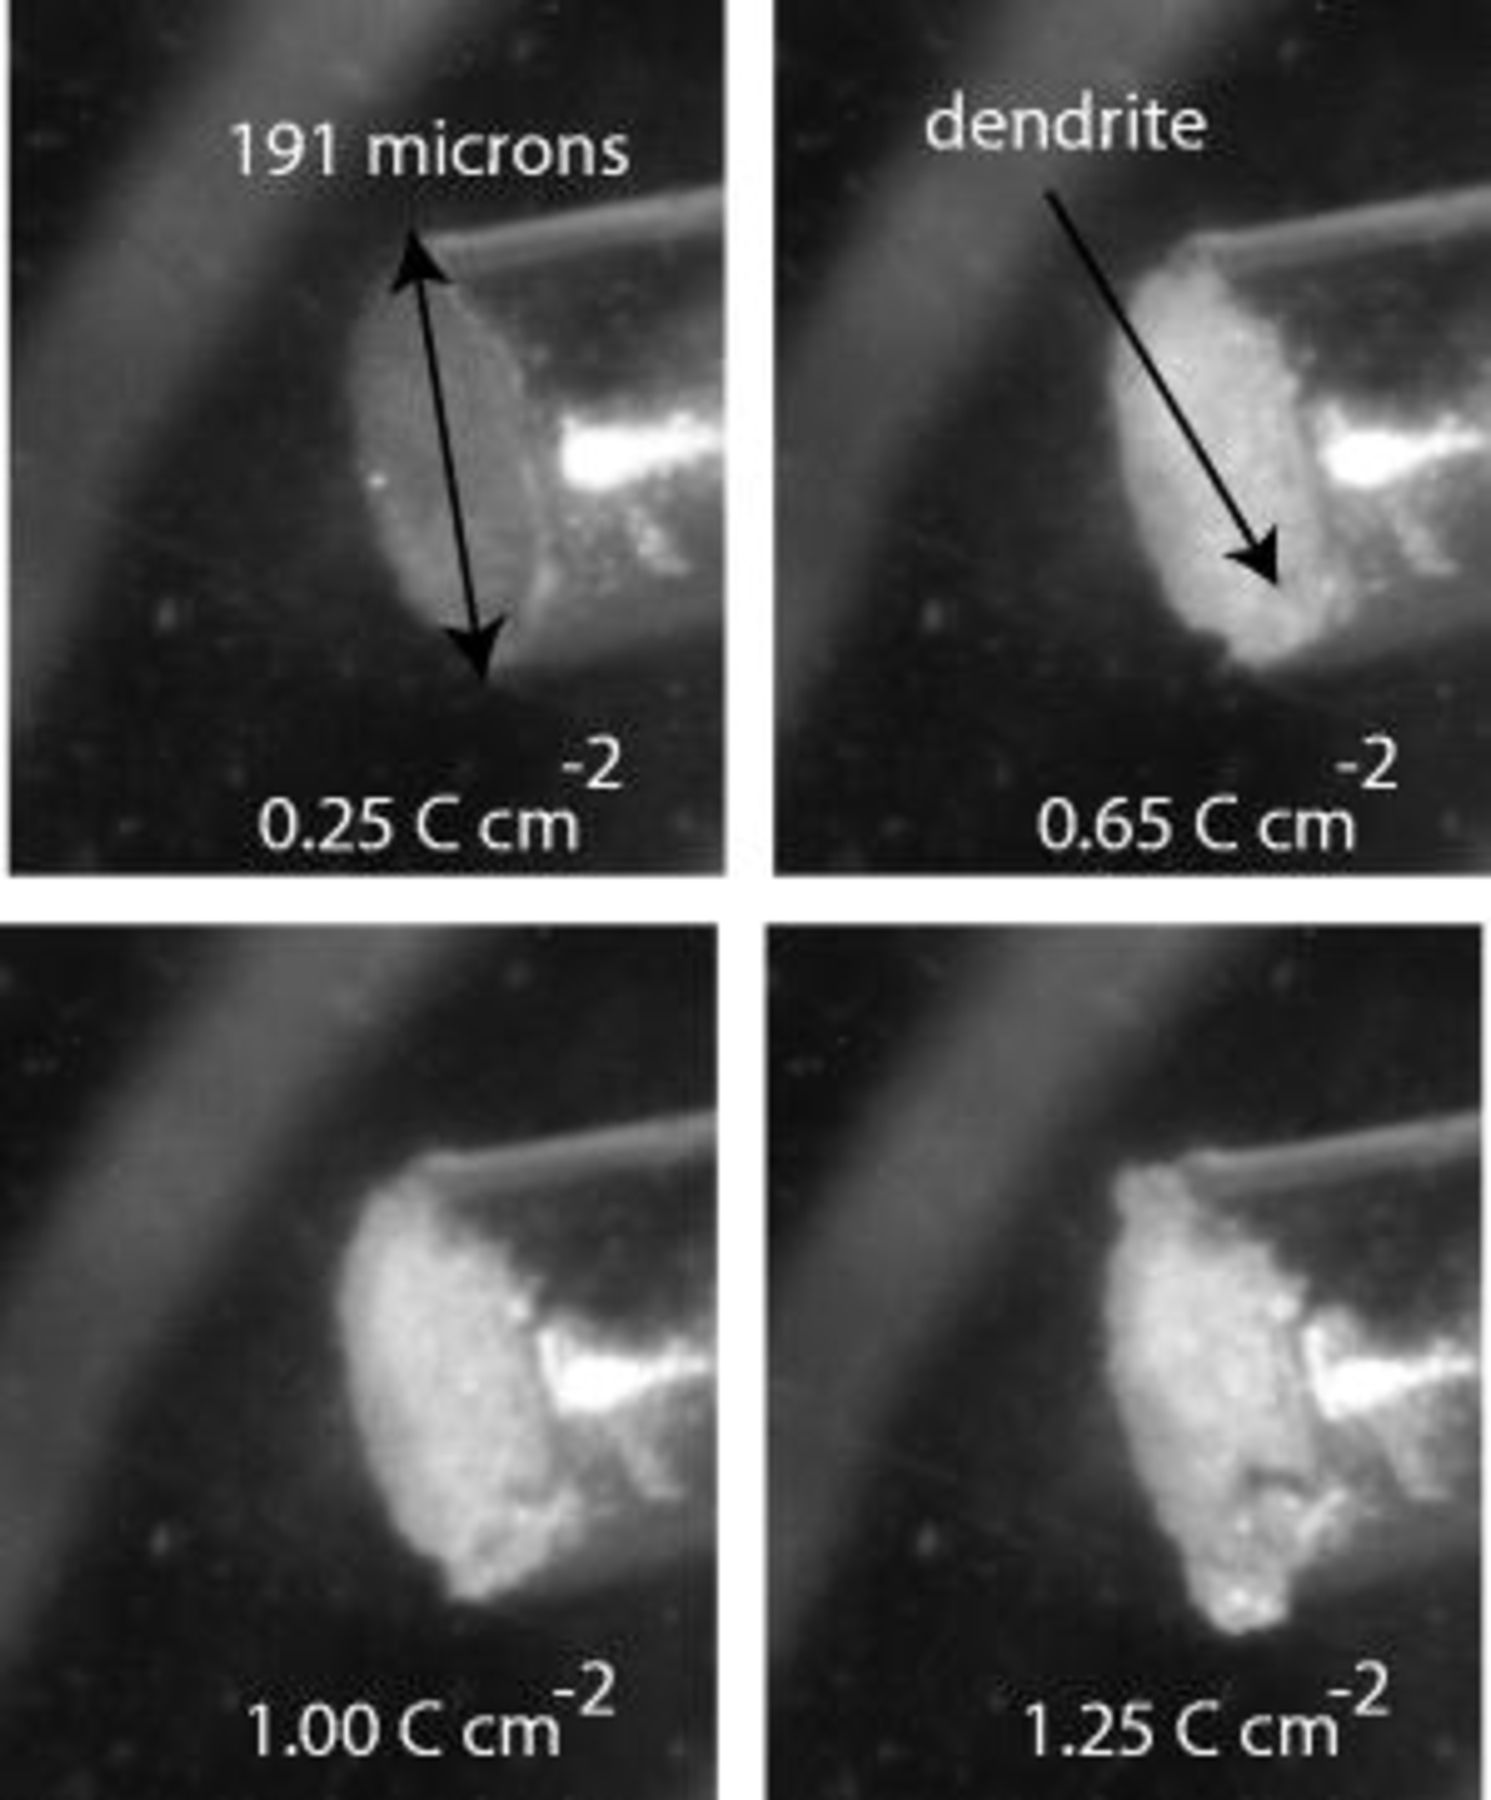
Figure 3. Sample pictures obtained using the electrode view of lithium deposition. Lithium is being deposited at a rate of  from
from 
 in PC:DMC (3:1 by weight). The charge density at first observed dendrite,
  , is
, is  in this case.
Figure 4 shows how Li, deposited from the 25% PC electrolyte, propagates over the electrode. The maximum distance is measured in the normal direction from the substrate to the dendrite tip over time to obtain the dendrite growth rate normal to the electrode, as a function of time shown in Fig. 5. The three-dimensional velocity is not actually going to zero; usually the dendrite branches out in a new direction parallel to the electrode. The growth rates are on the order of those predicted by Monroe and Newman,9 as well as those experimentally observed by Brissot et al.21 Dendrite growth rates quickly become relatively high, attaining values between 0.5 and  . Our image resolution is approximately
  , so the experimental setup is able to observe dendrites shortly after their formation. It should be noted that the data observed in Fig. 5 is just for one set of experiments, where one large dendrite is formed. Often, even under the same conditions, many smaller dendrites are observed across the electrode surface. Dendrite tip velocity for this situation is often lower, presumably because of competition among the tips.
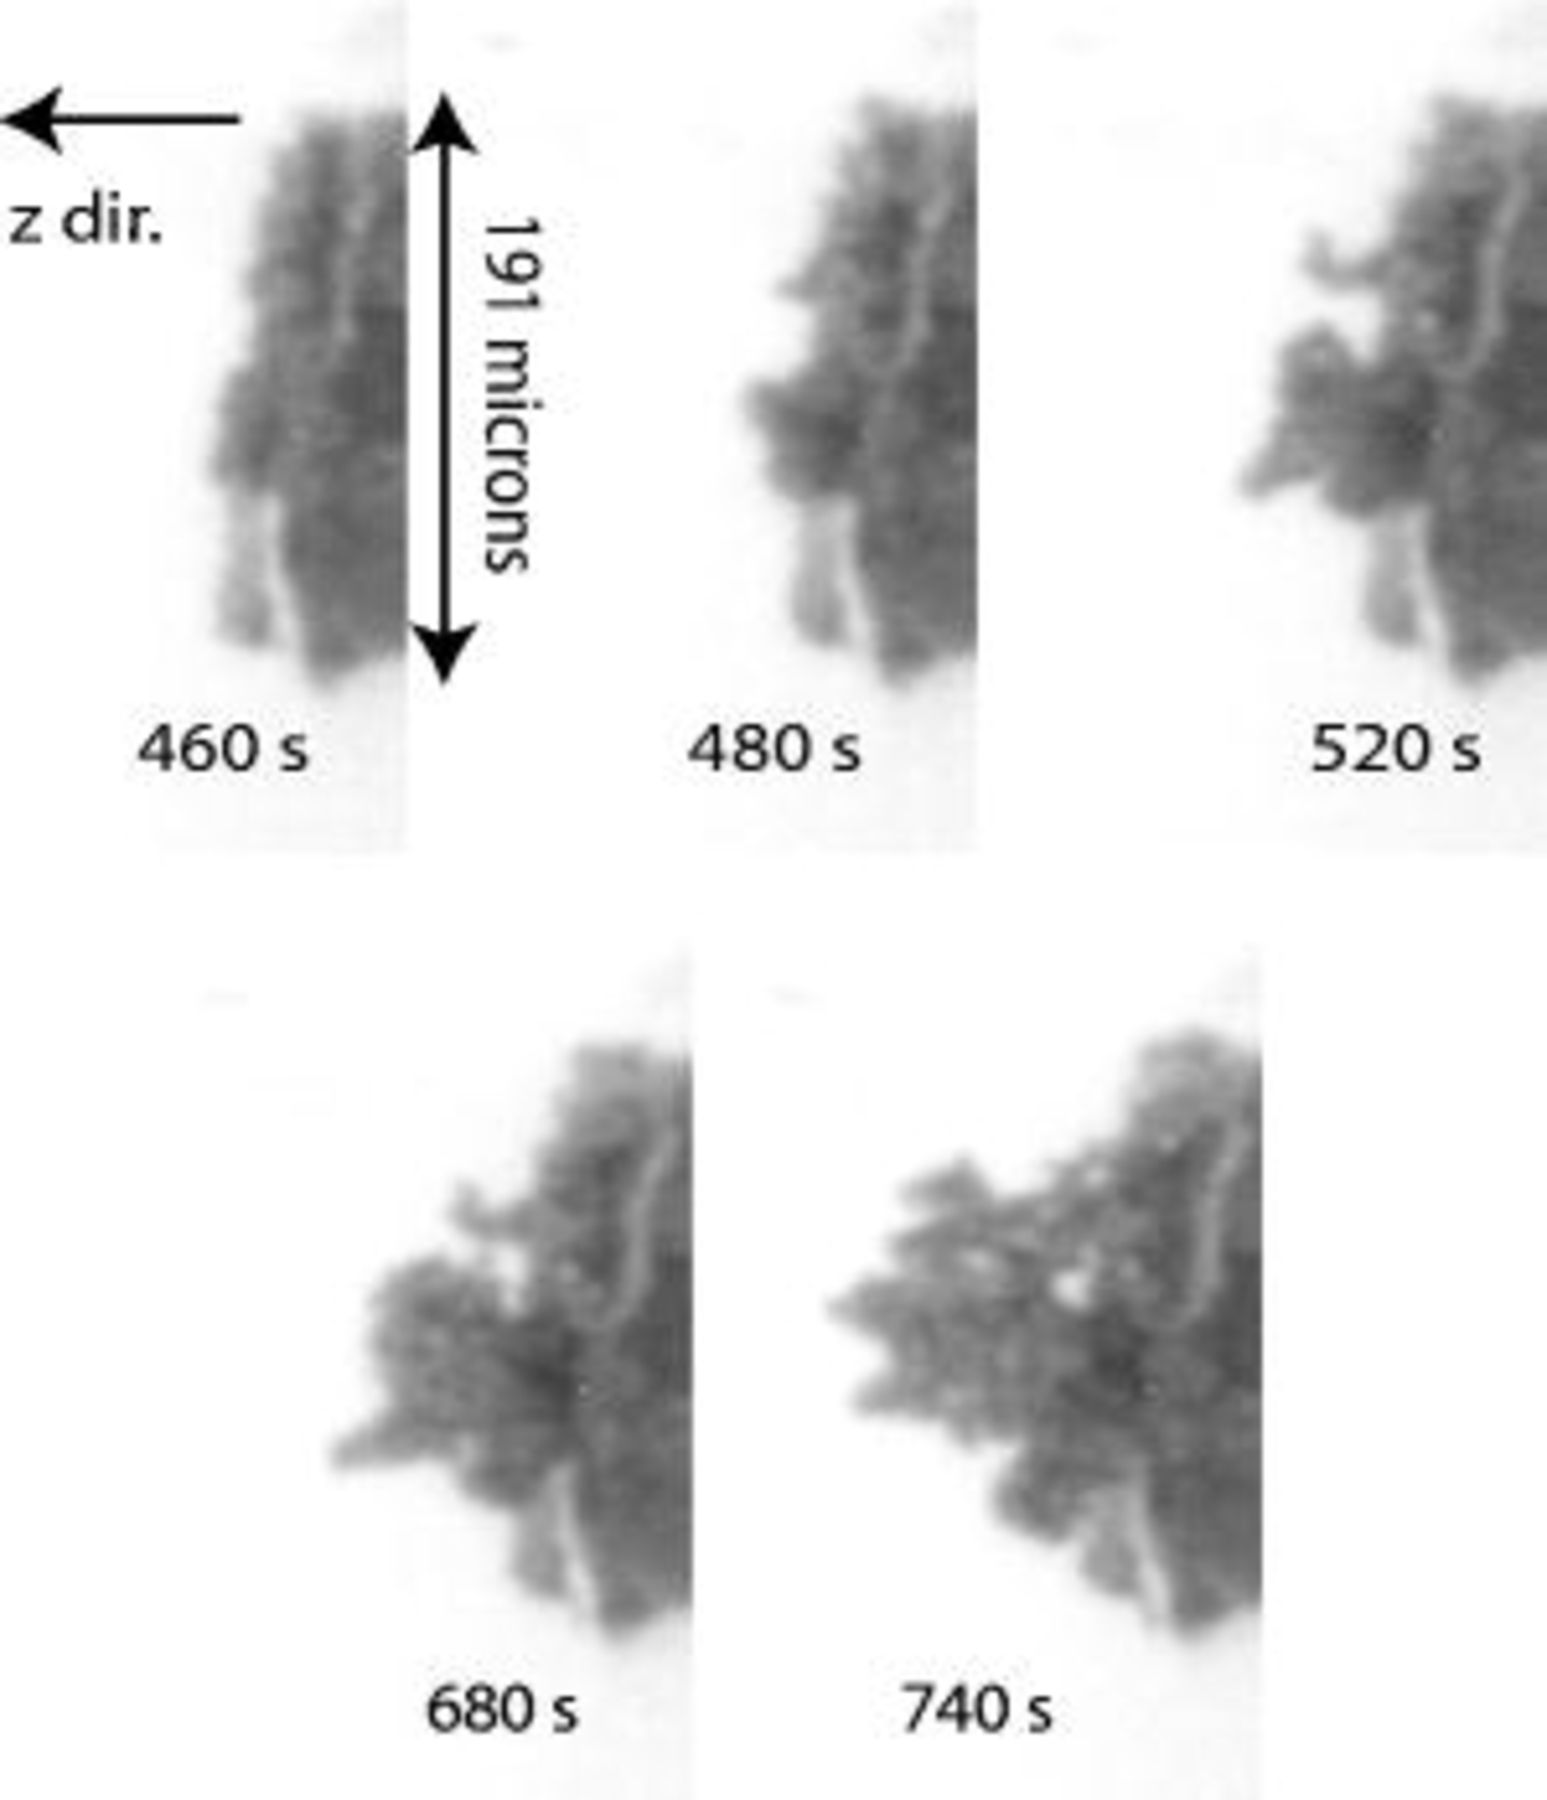
Figure 4. Sample pictures of dendrite propagation. Lithium is deposited from 
 in PC:DMC (1:3 by weight) at a current density of
  in these pictures.
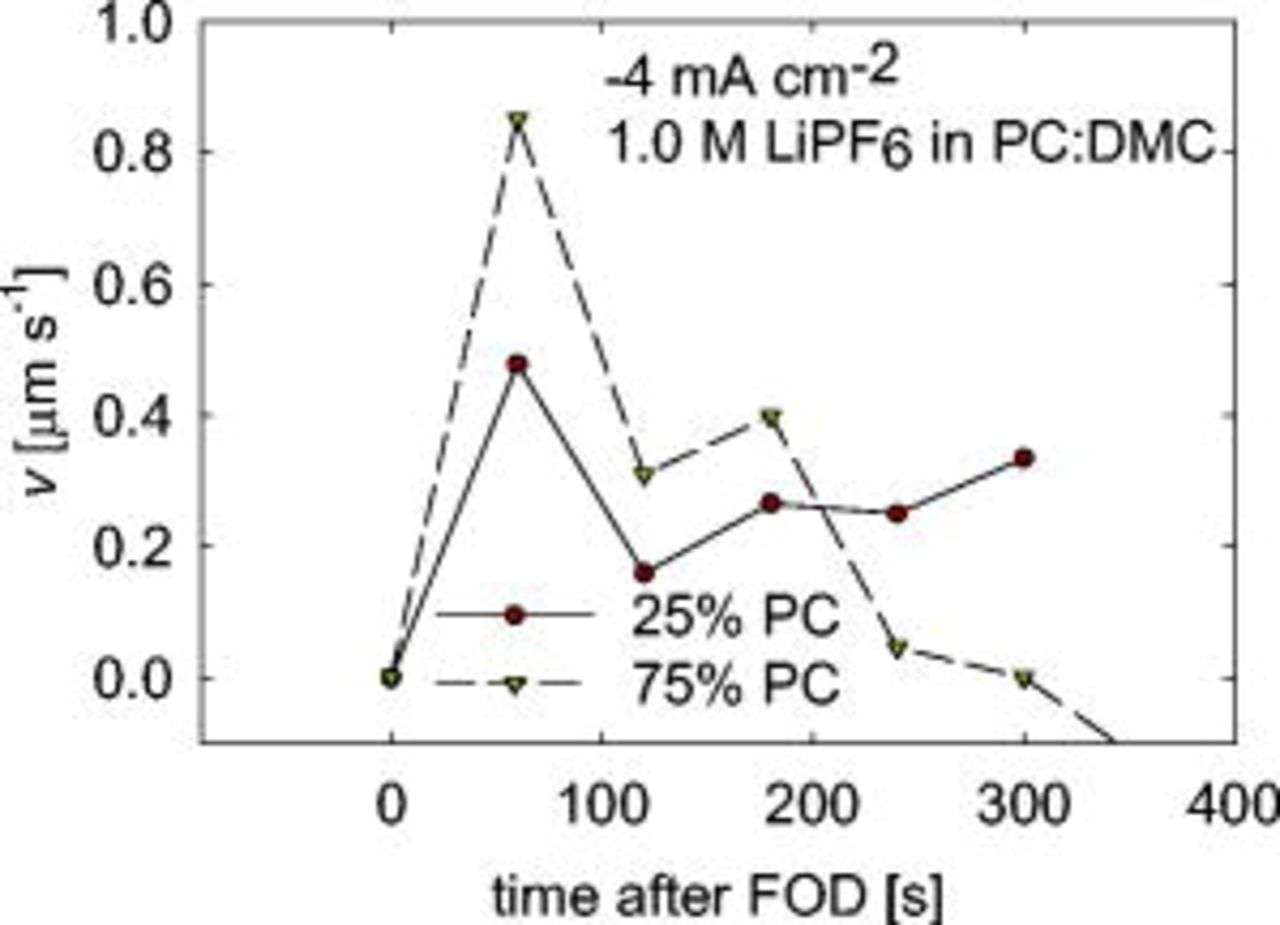
Figure 5. Dendrite tip velocity as a function of the time. The time denoted as zero is the  for the given experiment. The red circles are the data for the pictures in Fig. 4 where
  was
was  .
.
Multiple experiments are summarized in Fig. 6 to show the effect of solvent composition on time of first observed dendrite,  . The ratio of two common cosolvents, PC and DMC, is varied and results are shown for two different current densities. The salt concentration is maintained constant at
 . Solvents containing a majority of PC more quickly form dendrites. Also,
  increases linearly with decreasing PC content. The time
  increases by a factor of 3–4 when the current density doubles for all electrolyte compositions except for pure DMC.
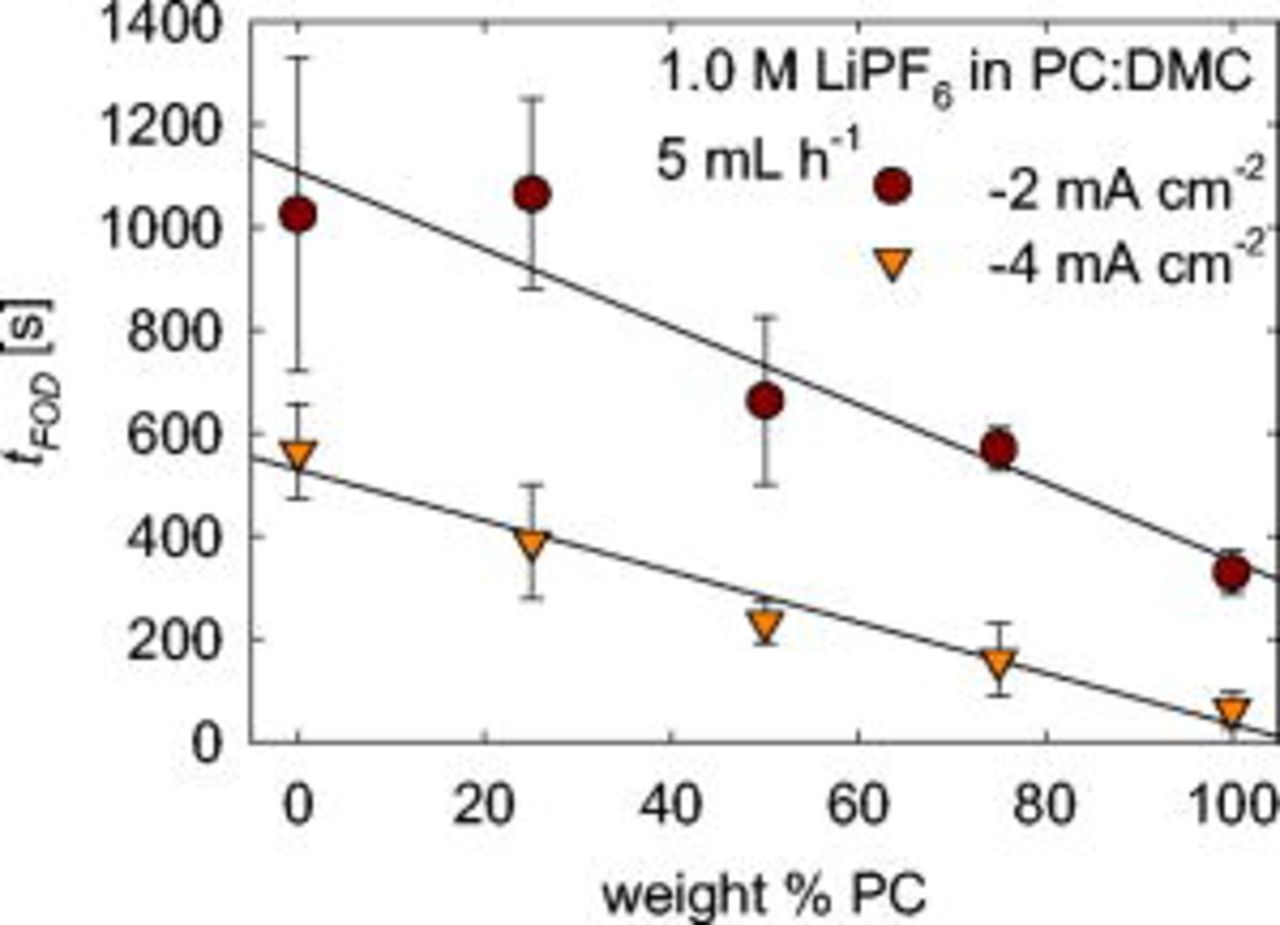
Figure 6. Effect of solvent composition on  .
.
The effect of current density,  , on
, on  and
and  is shown in Fig. 7 and 8. Figure 7 shows that
  increases as
  decreases. The charge at first observed dendrite for the electrolyte salt
  is about twice that of lithium bis(trifluoromethane sulfonyl) imide (
 , LiTFSI). One reason may be that trace water impurities will react with the
  anion to form HF, whereas
  does not react to form HF. HF is known to result in smooth lithium deposits.30 However,
  levels out at around
  as
as  decreases below
  for
for  . Such results show more than deposit thickness must be considered in predicting when dendrites are likely. Figure 8 shows that
  decreases with increasing
  for both salts. Again the
  for
for  is approximately twice that of LiTFSI.

Figure 7. Effect of  on
on  for two lithium salts.
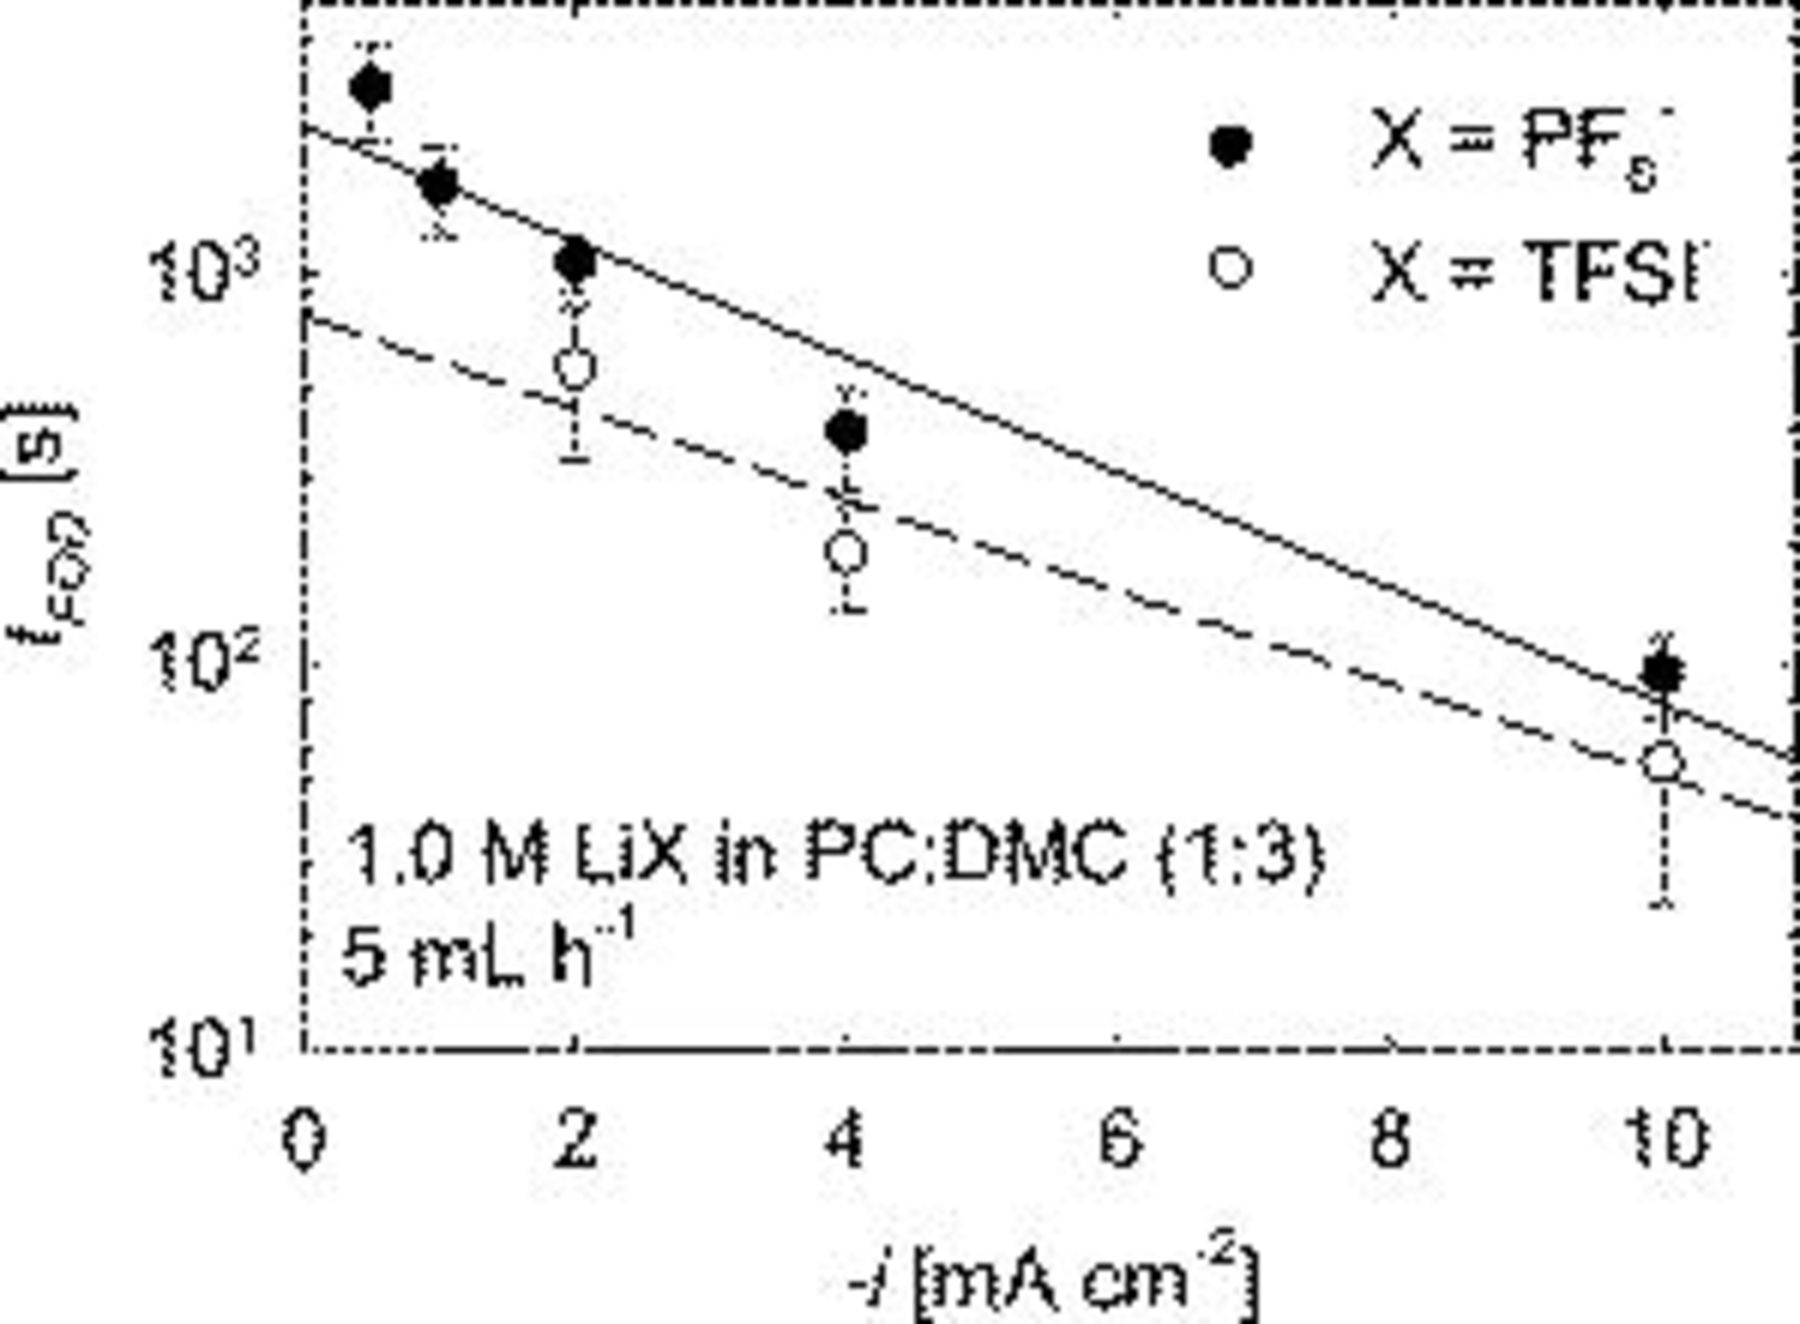
Figure 8. Effect of  on
on  for two lithium salts.
Experimental observations show dendrites or other instabilities will form for most metals, e.g., copper, as  increases above 80% of the limiting current density,
  .7 However, we found
  is not a good predictor of when Li dendrites will form. In comparison with common plating systems, dendrites are not expected to form during any of the experiments in this paper because
  never passes 20% of
  , which was measured to be between 50 and
  depending on the solvent composition. The limiting current density decreased with increasing amounts of DMC. The results are not shown here because the electrode surface roughened in electrolytes containing mostly PC at polarizations before
  was obtained making it difficult to obtain repeatable measurements. If mass transfer plays a dominant role, it may be expected that
  would decrease with increasing amounts of DMC because
  increases. However,
  increases with increasing amounts of DMC. These results suggest that the mass transfer of lithium to the electrode might not be the cause of lithium dendrite initiation.
However, the above statement may only apply to flow systems. For systems with a stagnant electrolyte, i.e., a battery, the diffusion layer will continue to grow. The interpretation of stagnant electrolytes is also complicated by free convection. We have performed experiments using the microfluidic device with no flow (results not shown for brevity) and dendrite initiation occurs faster in a stagnant electrolyte than when the electrolyte is flowing. The dendrites also branch more quickly and more often in a stagnant electrolyte. Our experimental setup removes the effect of a time-varying Li ion diffusion layer. The flow system demonstrates that dendrites will form under conditions where mass transfer is not an issue. However, we cannot definitively say that mass transfer does not play a role in the lithium dendrite initiation in batteries because it is possible that the diffusion layer could grow large enough that mass transfer becomes an issue.
The Tafel equation relates the current density to the overpotential, η, and is valid for high polarizations, typically greater than  . It is used here to define a resistance that is correlated to
  . The first derivative of the Tafel equation with respect to η is25
where the Tafel slope, β, can be written as

In Eq. 3, α is the apparent charge transfer coefficient,  is Faraday's constant,
  is the ideal gas constant, and
  is the temperature. Tafel plots, used to estimate β, are shown in Fig. 9. The data are obtained by plating Li to a thickness of
  at
at  on the Cu WE in the given electrolyte, and then taking the polarization curve at
  . The values of β range from
  for
for 
 in pure DMC to
  for
for 
 in pure PC. According to the previous equations, α varies from 0.11 for pure DMC to 0.24 for pure PC. Newman notes α values are usually between 0.2 and 2.0 (Ref. 25), whereas Bard and Faulkner say they are between 0.3 and 0.7 for most systems.31 Because these values are on the low end of the expected range, there may be another resistance that is slowing Li deposition. This is especially true since the reduction of Li involves only one electron transfer. This resistance may be the transport of current through the SEI via a high field conduction mechanism. Regardless of the physical explanation for the Tafel slope, a Tafel resistance,
  , which is the local slope of the polarization curve assuming Eq. 2 can be written as
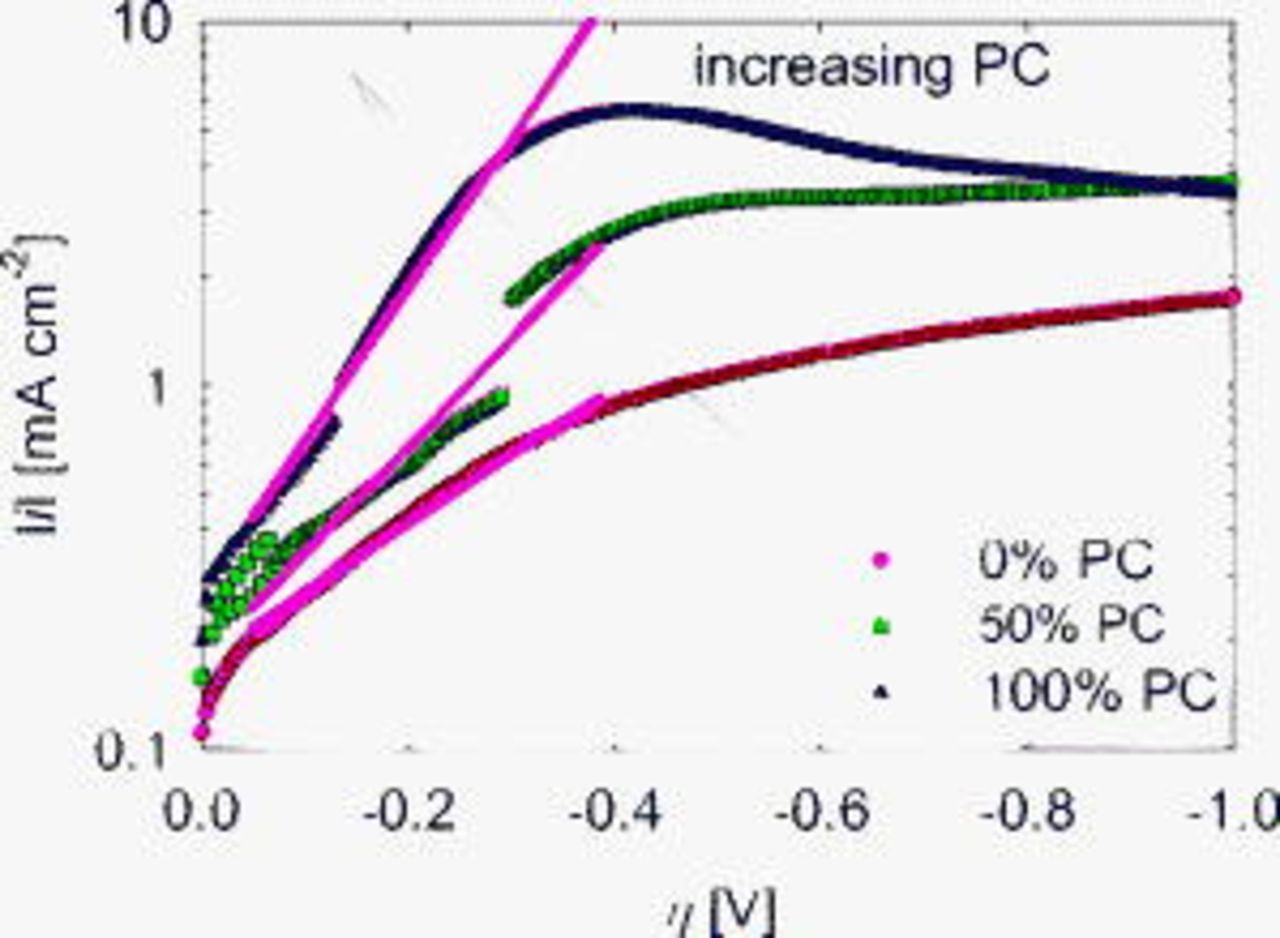
Figure 9. Lithium reduction polarization curves used to determine β. η is the overpotential.
Figure 10 shows an increase in  with
with  . The line in Fig. 10 is fit only to the points from the electrolytes with PC and DMC solvents. The
 in EC:EMC (3:7) and
  LiTFSI in PC:DMC (1:3) data are, however, included and fit well to the trend. This shows that the type of solvent or salt does not affect the relationship between
  and
and  . Dendrites are inhibited as the Tafel resistance increases. Presumably, such an observation may inform theoretical dendrite studies, which have not, as of yet, explicitly treated the SEI. For example, this correlation may suggest that the local SEI may thicken near an incipient dendrite. The effect of resistance on
  agrees with recent work by Park et al.32
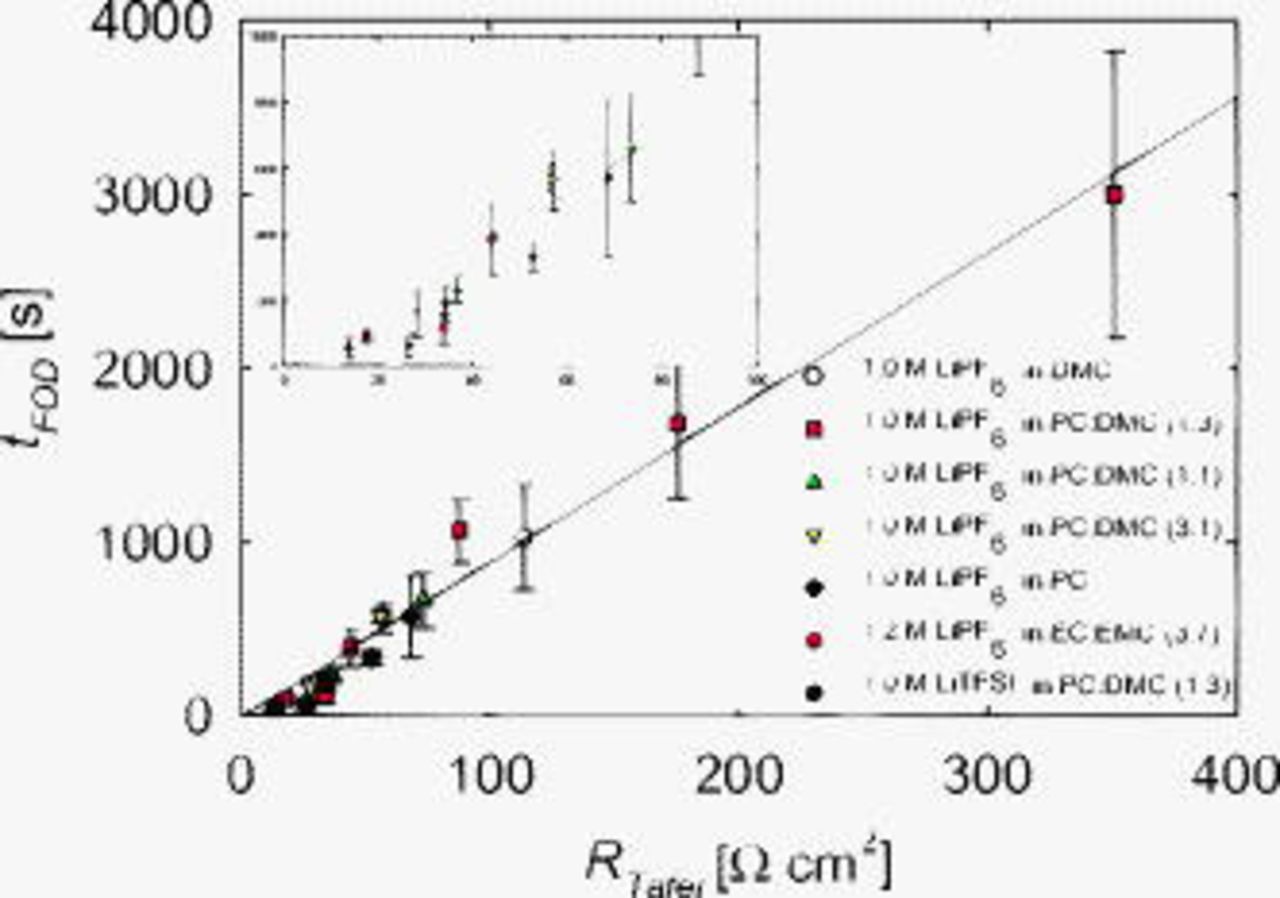
Figure 10. Effect of  on
on  . The line is fit to the
 in PC:DMC data. The inlay is a magnification of the low resistance data.
Dendrite Propagation Studies
The dendrite tip velocity,  , is measured using methods described previously. The current density at the dendrite tip,
  , can be estimated by
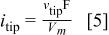
The molar volume of Li is denoted by  in Eq. 5. This calculated current density is even less than the actual current density due to branching discussed earlier. Figure 11 shows
  for deposition from
 in PC:DMC(1:3) over a period of
  after the time of first observed dendrite. The calculated current density is similar for the averaged current densities of 2 and
  . That the current density at the dendrite tip only varies slightly when the average current density is doubled suggests that the deposition may be mass transfer controlled. The dendrite tip radius, measured in the same manner described earlier, is observed to be 29 and
  during the 2 and
  depositions in
 in PC:DMC (1:3). The dendrite tip radius is measured when the dendrite tip is easily observed and well defined but before branching occurs. The dendrite with the smaller radius has the higher maximum
  . Assuming a diffusion coefficient
  , the limiting current density for a hemisphere in spherical coordinates is calculated as
  for
for  and
and  for
for  . In Fig. 11, the maximum
  is greater than the
  for both of these cases. The maximum
  is also greater than
  calculated in spherical coordinates for the electrolytes
 in EC:EMC (3:7 by weight) with Li deposited at
  (deposition shown in Fig. 2) and
 in PC:DMC (3:1 by weight) with Li deposited at
  (data shown in Fig. 5). These observations lead us to believe that even though dendrite initiation may not be correlated with fraction of the limiting current density (averaged over the entire surface), growth quickly becomes mass transport controlled.
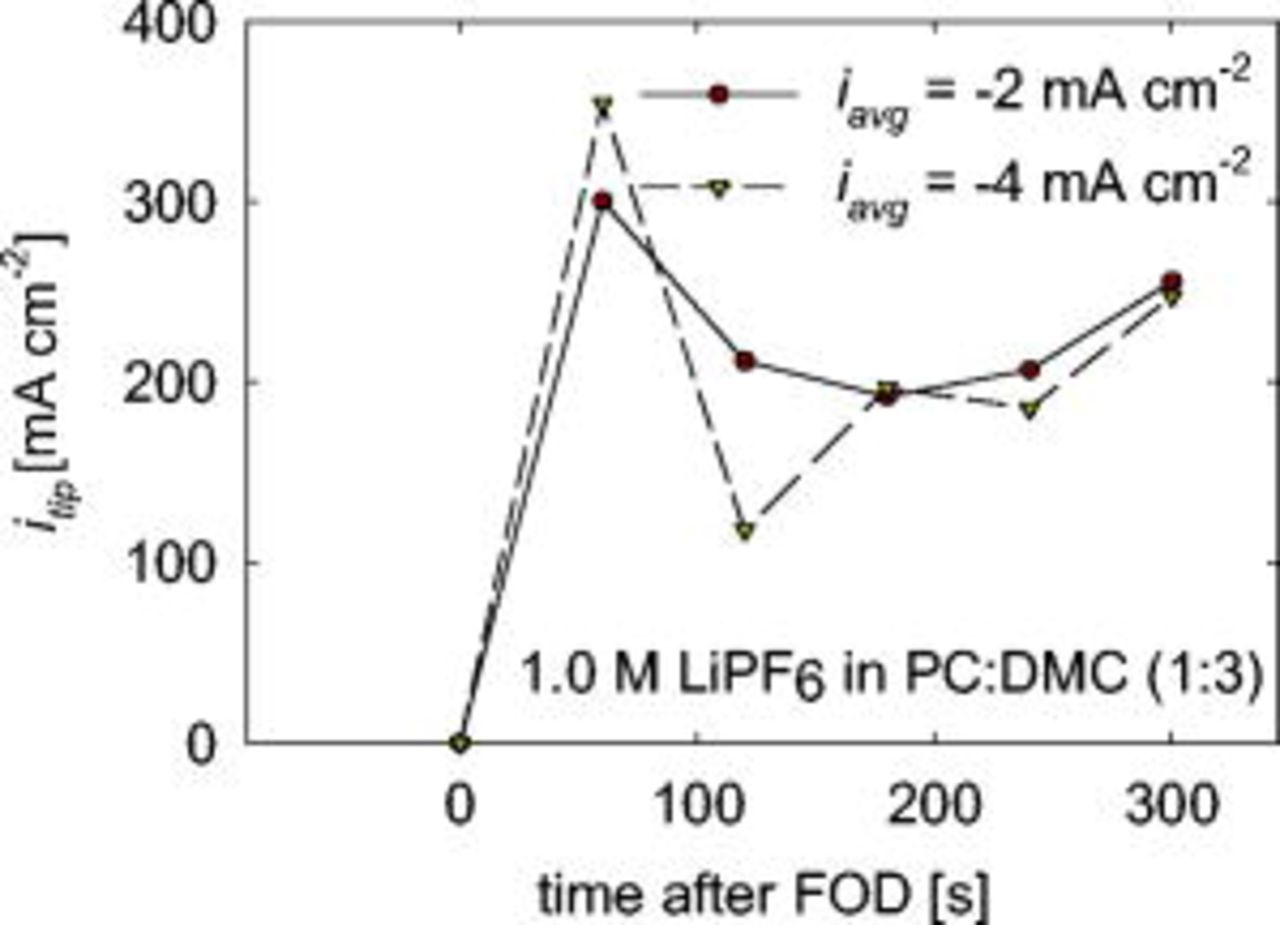
Figure 11. Current density at dendrite tip calculated with Eq. 5 as a function of time.
Conclusion
In this paper we have built a microfluidic test setup that allows for in situ observations of lithium deposition. The advantages of the microfluidic device are that it sets up well-defined transport conditions, minimizes electrolyte usage, shows good repeatability, and possesses the ability to rapidly change electrolytes. Dendrite growth rates are on the order of other experimental observations and theoretical predictions. The initiation of dendrites, shown by an increase in  , is delayed by decreasing current density and PC solvent content. Mass transport does not play a large role in dendrite initiation in the presence of fluid flow. After initiation, deposition is rapidly mass transfer controlled. The time to first observed dendrite,
  , linearly increases with the Tafel resistance,
  . This paper shows effects of current density, electrolyte salt, and electrolyte solvent composition on dendrite initiation and propagation.
List of Symbols

| Faraday's constant, 
|

| current density, 
|

| limiting current density, 
|

| current density at the dendrite tip, 
|

| charge density at first observed dendrite, 
|

| ideal gas constant, 
|

| Tafel resistance, 
|

| temperature, K |

| deposition time, s |

| time of first observed dendrite, s |

| molar volume, 
|

| velocity of the dendrite tip, 
|
| α | apparent charge transfer coefficent |
| β | Tafel slope, 
|
| η | overpotential, V |
Acknowledgments
The authors are grateful to the United States Department of Energy for their financial support under contract no. DE-AC02-05CH11231 .
Columbia University assisted in meeting the publication costs of this article.