Abstract
Single crystal positive electrode materials for lithium-ion batteries have superior properties compared to their polycrystalline counterparts as has been demonstrated by industry and academia. Single crystal LiNi0.5Mn0.3Co0.2O2 (NMC532), NMC622 and now NMC811 have been successfully commercialized. However, single crystal LiNi1-x-yCoxAlyO2(NCA) materials have not been reported yet. One simple method for producing single crystal NMC material requiring high temperature and excess lithium during synthesis creates Li5AlO4 impurities if applied directly in attempts to synthesize single crystal NCA materials. This work introduces a two-step lithiation method for single crystal LiNi0.88Co0.09Al0.03O2 synthesis, which can prevent the formation of Li5AlO4 impurities. Powder X-ray diffraction, electron backscatter diffraction, and electrochemical measurements show the viability of the two-step lithiation method. Full coin cell cycling shows that the capacity retention of the single crystal NCA samples is at least as good as their polycrystalline counterparts. It is believed that this two-step lithiation method can be used for the synthesis of single crystal NCA and other single crystal Al-containing positive electrode materials. We believe this can lead to longer lived Li-ion cells with Ni-rich positive electrode materials.
Export citation and abstract BibTeX RIS

This is an open access article distributed under the terms of the Creative Commons Attribution 4.0 License (CC BY, http://creativecommons.org/licenses/by/4.0/), which permits unrestricted reuse of the work in any medium, provided the original work is properly cited.
Ni-rich layered lithium transition metal oxides are one of the most promising positive electrode materials for lithium ion batteries.1 Many derivatives of LiNiO2, such as LiNi1-x-yMnxCoyO2(NMC) and LiNi1-x-yCoxAlyO2 (NCA) have been successfully commercialized and are of great interest in both industry and academia.2–4
For layered lithium transition metal oxide positive electrode materials, many failure mechanism studies attribute some portion of cell degradation to micro-cracks which form in the secondary particles causing impedance growth and active material loss.5–12 C. Yoon et al.13 showed that LiNiO2 cells cycled between 3–4.2 V and 3–4.3 V experienced rapid capacity fade, while cells cycled between 3–4.1 V showed relatively stable cycling. The failure of cells with upper cutoff voltages of 4.2 V and 4.3 V was attributed to particle cracking caused by the H2-H3 phase transition at high state of charge, during which the H3 phase with smaller unit cell volume was formed.14 Although the H2-H3 phase transition can be suppressed by cation substitutions according to in-situ X-ray diffraction (XRD) studies, as derivatives of LiNiO2, NCA and NMC materials also experience strong c-axis contraction and unit cell volume contraction at high states of charge.15–17 So even if the H2-H3 phase transition can be eliminated, anisotropic primary particle expansion and contraction during charge and discharge still occurs which can cause micro-cracking in the secondary particles. H. Ryu et al.18 showed that in the NMC series, the problem of micro-crack generation during cycling becomes more severe as the Ni content increases. As a result of cracking, ensuing electrolyte infiltration into particle interior can further worsen the cell performance. Similar cracking issues were also identified in the studies of NCA materials by Y. Ukyo et al.9
Micro-cracking is a widely acknowledged contributor to NMC and NCA cell failure. Therefore, numerous methods to eliminate microcracking have been reported. U. Kim et al.19 reported that doping LiNiO2 with 1 mol% of W can effectively prevent particles from cracking. K. Park et al.20 showed that doping LiNi0.9Mn0.05Co0.05O2 with boron can alter the orientation of primary particles and form a well aligned radial close packing geometry, which reduces the negative effect of particle anisotropic volume change during cycling and can alleviate cracking issues. Similar work was also reported by X. Xu et al.21 C. Yoon et al.22 showed that NMC materials with concentration gradients of Ni and Mn have improved cycling performance due to fewer cracks. A method of coating primary particles with a cation-mixed phase was introduced by H. Kim et al.,23 and it leads to improved particle integrity after cycling in LiNi0.6Mn0.2Co0.2O2 (NMC622) cells.
Micro-cracks in the secondary particles are believed to be triggered by anisotropic volume changes (during charge and discharge) of the primary particles which make up the secondaries. Therefore, a simple strategy to eliminate micro-cracks is to use single crystal positive electrode materials. Single crystal positive electrode materials are believed to maintain particle integrity during cycling.24 The advantages of commercially available single crystal LiNi0.5Mn0.3Co0.2O2 (NMC532) has been reported by J. Li et al.25 Their work showed that when appropriate electrolyte systems were used, cells using single crystal NMC532 had much longer cycle life and calendar life than cells using polycrystalline NMC532.
One method for the synthesis of single crystal NMC materials has been introduced by the authors.15,26 We showed that using excess lithium carbonate (or hydroxide) and a higher heating temperature during synthesis are two critical factors that promote single crystal growth. NCA synthesis studies have shown that the Li5AlO4 impurity is prone to form at high temperature (> 850°C), and using an excess amount of lithium source also promotes the formation of Li5AlO4.27 This means that the direct application of a simple method to prepare single crystal NMC to the synthesis of single crystal NCA leads to materials with a significant amount of Li5AlO4 impurity. In this work, we introduce a two-step method of synthesizing single crystal LiNi0.88Co0.09Al0.03O2 (NCA880903), by which the formation of Li5AlO4 can be avoided. It is believed this method can be applied to the synthesis of other compositions of NCA as well.
Experimental
Reagents used for the synthesis of LiNi0.88Co0.09Al0.03O2 included Ni0.88Co0.09Al0.03(OH)2 precursor (average particle diameter was 3 μm) provided by Guizhou Zoomwe Zhengyuan Advanced Material Co., Ltd. and LiOH•H2O (purity >99.8%, FMC Corporation). Reagents used for coin cells included 1:2 v/v ethylene carbonate. diethyl carbonate (EC:DEC, BASF, purity 99.99%), vinylene carbonate (VC, Shenzhen CapChem, purity 99.97%), and lithium hexafluorophosphate (LiPF6, BASF, purity 99.9%, water content 14 ppm).
Two-step lithiation synthesis of single crystal LiNi0.88Co0.09Al0.03O2 (SC880903)
The Ni0.88Co0.09Al0.03(OH)2 precursor was mixed thoroughly with a stoichiometric equivalent of LiOH•H2O by hand milling using a mortar and a pestle. In the first step of heating, samples with a lithium/transition metal ratio less than 1 were prepared. In this paper all metals other than lithium are classified as transition metals, even though aluminum is obviously not a transition metal. This convention is used because these metals are targeted to occupy the same positions in the crystal structure, i.e. the Ni sites in LiNiO2 which are the transition metal sites. The mixed powders were preheated in oxygen in a tube furnace at 485°C for 3 hours. A heating rate of 10°C/min was used to increase the temperature to the set point. This step causes the LiOH to melt and react initially with the NCA precursor. The preheated powders were taken out of the furnace and ground again by hand milling to eliminate areas of local LiOH excess. The ground powders were then heated in oxygen in the tube furnace at 485°C for 2 hours, and then at a temperature ranging from 850°C to 950°C for 12 hours. A heating rate of 10°C/min was used to change temperatures. The entire procedure above is referred to as the "first lithiation step".
After the samples cooled to room temperature additional LiOH•H2O was added to obtain an overall Li/TM ratio of 1.01 or 1.02. This added LiOH•H2O was thoroughly mixed with the product of the first heating using a mortar and pestle. Then the mixed samples were subjected to a second heating cycle in oxygen in the tube furnace at 735°C for 12 hours. The addition of the additional LiOH•H2O followed by heating is referred to as the "second lithiation step".
Scanning electron microscopy imaging (SEM)
SEM imaging was conducted using a Nano Science Phenom Pro G2 Desktop Scanning Electron Microscope with a backscattered electron detector. Samples were prepared by mounting the powders onto adhesive carbon tape. The images of samples were taken with an accelerating voltage of 5 kV and a current of 0.6 nA.
Powder X-ray diffraction (XRD)
Powder X-ray diffraction (XRD) was conducted to study the structure of materials using a Siemens D5000 diffractometer equipped with a Cu target X-ray tube and a diffracted beam monochromator. Diffraction patterns were collected in the scattering angle (2θ) range of 15–70° at 0.02° intervals with a dwell time of 3 s. A 1° divergence slit, 1° anti-scatter slit and 0.2 mm receiving slit were used for the measurements. The collected XRD patterns were refined (Rietveld method) using "Rietica".28
Electron backscatter diffraction (EBSD)
Samples of SC880903 for cross-sectional analysis were prepared by an ion beam cross-section polisher (JEOL IB09010CP) at the Canadian Centre for Electron Microscopy (CCEM). The SC880903 powder sample was first mixed with carbon paste (amorphous carbon powder) and propanol to make a paste. The paste was then embedded in a graphite block and then the cross-section of the block was created by a cross-section polisher with an Ar ion beam (5KV for 10 hours). Electron backscatter diffraction (EBSD) mapping was carried out using a JEOL JSM-7000F SEM at CCEM. The step size of the EBSD maps was 200 nm (each pixel is 200 nm × 200 nm).
Coin cells
Synthesized positive electrode materials were mixed with polyvinylidene difluoride (PVDF) and Super-S carbon black having a mass ratio of 92:4:4 in N-methyl-2-pyrrolidone (NMP) to make a slurry. Single side coated electrodes were made by casting the slurry onto aluminum foil with a 150 μm notch bar spreader. The electrodes were dried in an oven at 120°C for 3 hours. Dried electrodes were then calendared at a pressure of 2000 atm. The loading of electrode material was ∼12 mg/cm2. Coin cell electrodes were punched (1.2 cm in diameter) and further dried under vacuum at 120°C for 14 hours before coin cell fabrication. The electrode fabrication procedure closely followed that described by Marks et al.29
Control electrolyte used for coin cell testing was 1.0 M LiPF6 in EC:DEC (1:2 v/v). Electrolyte containing VC as an additive was formulated by adding 2 wt% of VC to the control electrolyte (2%VC electrolyte). Standard 2325 coin cells were assembled in an argon-filled glove box. Each half coin cell had a positive electrode and a Li foil negative electrode with two layers of separators (Celgard #2300) in between, and each full coin cell had a graphite negative electrode and one layer of polypropylene blown microfiber separator (BMF – obtained from 3M Co., 0.275 mm thickness, 3.2 mg/cm2). Galvanostatic charge/discharge cycling was conducted with E-one Moli Energy Canada battery testing systems.
Particle size distribution analysis
Particle size distribution analysis of the synthesized NCA powders was made after the 1st and 2nd lithiation steps. A Partica LA-950V2 laser scattering particle size distribution analyzer (Horiba) was used. Synthesized powders were added into DI water and sonicated for 30 mins before analyzing.
Results and Discussion
In early attempts to make single crystal NCA, we applied the method used in single crystal NMC synthesis, which uses excess LiOH•H2O and higher sintering temperature. We quickly learned that NCA materials tended to form the Li5AlO4 phase when higher Li/TM ratio and higher sintering temperatures were used.27 Figure 1a shows the scanning electron microscopy imaging (SEM) image of a sample made with a Li/TM ratio of 1.04 at 850°C as representative of samples made in the early attempts. Figure 1b show the full XRD pattern of this selected sample, Figures 1c and 1d show expanded views of the (104) Bragg peak and the (108)/(110) Bragg peaks. The black circles are the measured diffraction data, and the solid red lines show the calculated pattern from Rietveld refinement. The green lines show the differences between the measured and calculated patterns. Figure 1e shows the impurity region of the XRD pattern of the selected sample, and the diffraction pattern matches well with the Li5AlO4 reference diffraction pattern plotted in blue, suggesting the formation of Li5AlO4 impurities. Similar to single crystal NMC532 and NMC622, the synthesized NCA sample came out of the furnace as a "brick"-like chunk due to the excess lithium source and high sintering temperature.15,26 The Li5AlO4 impurity formation issue and the "bricking" issue demonstrated the need for a new method of single crystal NCA synthesis. Therefore, the two-step lithiation method was developed by authors.
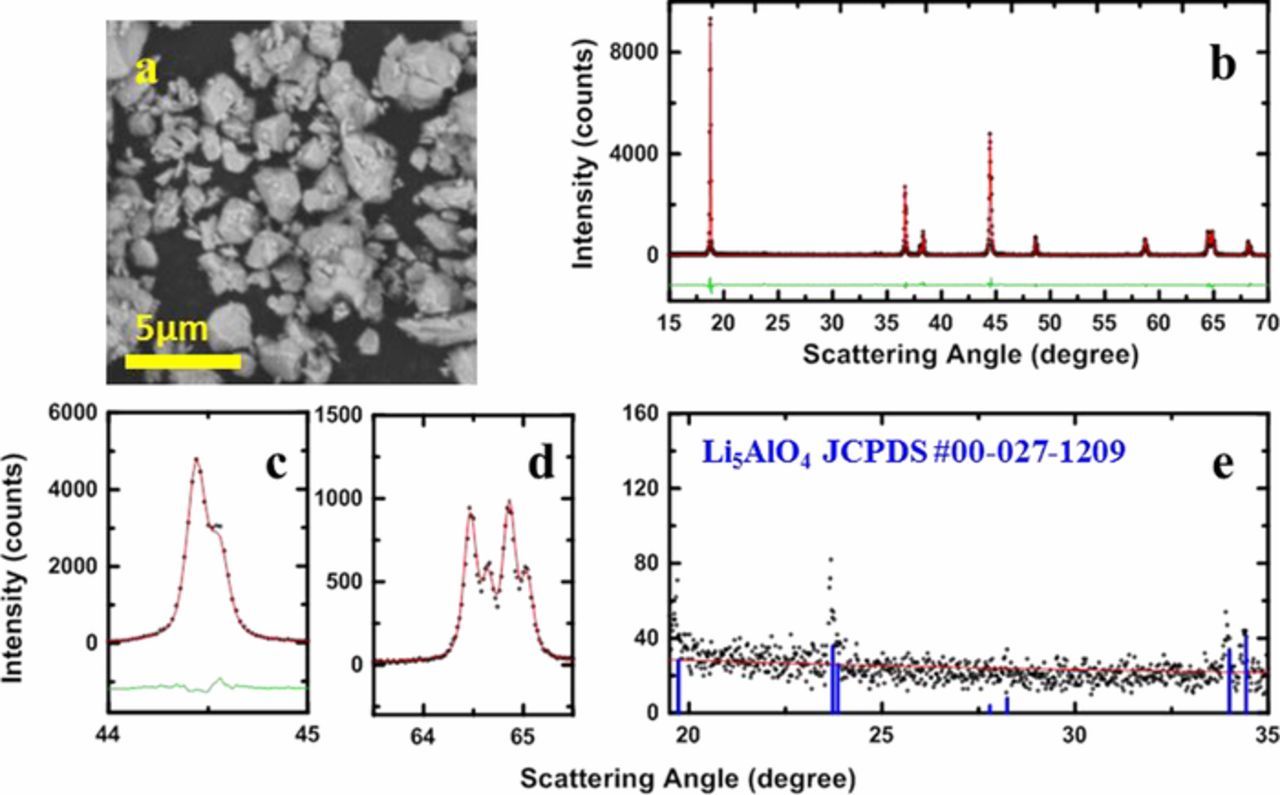
Figure 1. SEM image (a) and full XRD pattern (b) of an NCA sample made with Li/TM ratio of 1.04 at 850°C, expanded view of the (104) Bragg peak (c), expanded view the (108)/(110) Bragg peaks (d), and the impurity region in the XRD pattern (e). The reference XRD pattern of Li5AlO4 (JCPDS #00-027-1209) is marked with blue lines.
Figures 2A and 2B show the SEM images of the Ni0.88Co0.09Al0.03(OH)2 precursor. Figures 2a–2l show SEM images of the products of a variety of 1st lithiation step reactions with a 5 μm scale bar indicated. Figures 2a–2c show samples heated at 950°C with Li/TM ratios of 0.95, 0.90 and 0.80, respectively; Figures 2d–2f show samples heated at 900°C with Li/TM ratios of 0.95, 0.925 and 0.90; Figures 2g–2i show samples heated at 875°C with Li/TM ratios of 0.95, 0.925 and 0.90; and Figures 2j–2l show samples heated at 900°C with Li/TM ratios of 0.975, 0.95 and 0.90. Consistent with previous studies on single crystal NMC material synthesis,15,26 NCA material synthesized at higher temperature and with higher Li/TM ratio tends to have larger crystallite size. Single crystal NMC532 synthesis succeeds with 20% excess lithium and a ∼20°C higher sintering temperature compared to polycrystalline NMC532.14 Single crystal NMC622 synthesis succeeds with 10% excess lithium and a ∼40°C higher sintering temperature compared to polycrystalline NMC622.26,30 With a deficient lithium source, a much greater sintering temperature increase (∼100°C to ∼200°C), compared with the conventional polycrystalline NCA synthesis temperature, is needed to promote the grain growth.31 Samples shown in Figures 2c, 2f, 2g, and 2j have the desired single crystal morphology with grain sizes ranging from 2 μm to 5 μm, and these four samples were selected for the second step lithiation step.
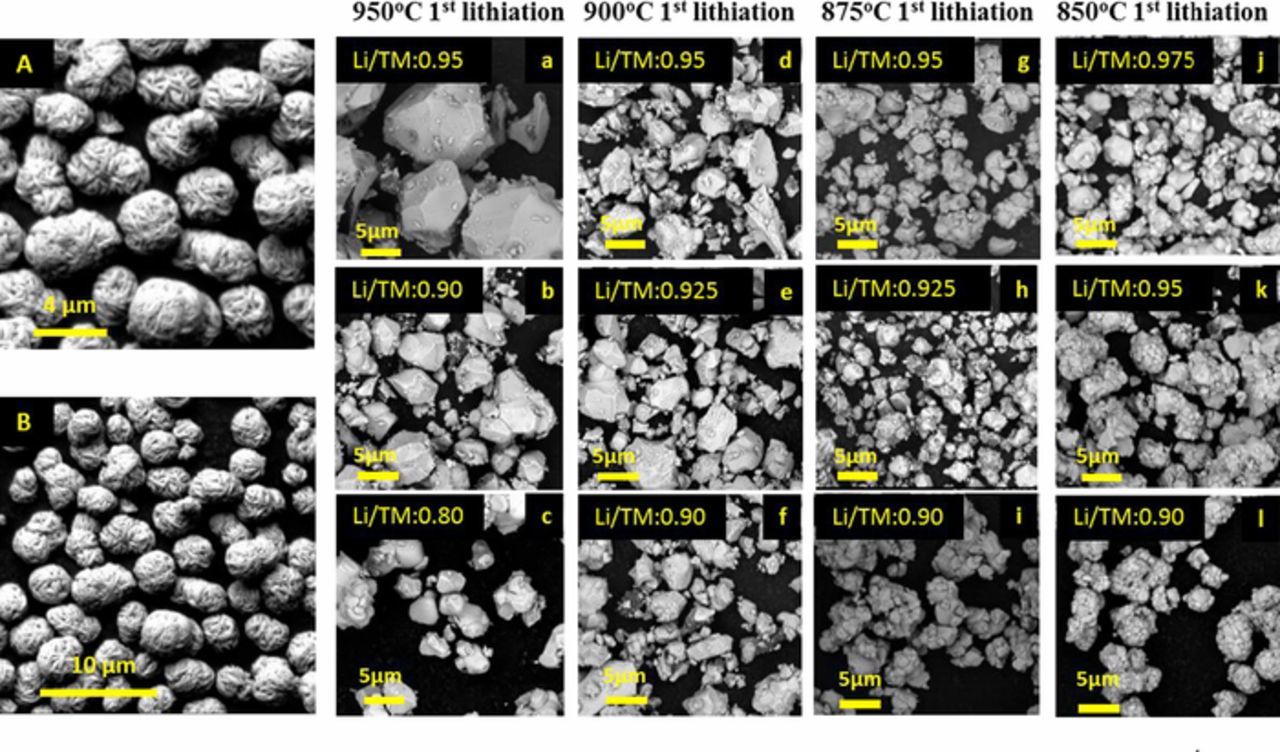
Figure 2. SEM images of Ni0.88Co0.09Al0.03(OH)2 precursors (A), (B); SEM images of 1st lithiation step products made at 950°C with Li/TM ratios of 0.95 (a), 0.90 (b), and 0.80 (c); SEM images of 1st lithiation products made at 900°C with Li/TM ratios of 0.95 (d), 0.925 (e), and 0.90 (f); SEM images of 1st lithiation products made at 875°C with Li/TM ratios of 0.95 (g), 0.925 (h), and 0.90 (i); SEM images of 1st lithiation products made at 850°C with Li/TM ratios of 0.975 (j), 0.95 (k) and 0.90 (i).
Figure 3 shows the impact of the first step lithiation conditions on the formation of the Li5AlO4 impurity. Figures 2a–2d show the impurity region between 18–35° in the XRD patterns of samples made at 950°C during the first lithiation step. Diffraction peaks of impurities like Li2CO3 and Li5AlO4 can be observed within this diffraction angle range. Figure 3e shows the the reference XRD pattern of Li5AlO4 (JCPDS #00-027-1209). All of the XRD patterns were collected using the same X-ray diffractometer, sample holder, and measuring parameters. Figure 3 shows that the peaks from Li5AlO4 became more intense as the Li/TM ratio increased from 0.6 to 0.95 at a fixed sintering temperature. To semi-quantify the amount of Li5AlO4, the ratio of the diffraction peak height (the overlapping (011) and (101) Bragg peaks) counts at ∼23.7° to the average background count rate between 23°–23.5° is defined as the Li5AlO4 impurity relative intensity. XRD patterns of samples made at 900°C, 875°C, and 850°C with different Li/TM ratios were collected in an identical way and the values of the Li5AlO4 impurity relative intensity were calculated as described above. Figure 3f shows the Li5AlO4 impurity relative intensity as a function of sintering temperature and Li/TM ratio. A clear relationship between the amount of Li5AlO4 and the synthesis conditions can be observed. As the 1st step lithiation temperature increases, more Li5AlO4 can be detected by XRD, and the formation of Li5AlO4 is also promoted by adding more LiOH•H2O. Figure 3f suggests that a two-step lithiation method could be successful. The first step with a deficient amount of lithium source and a high sintering temperature can grow the particles to form the desired single crystal morphology with a limited amount of impurity generation. A second lithiation step at lower temperature, to avoid Li5AlO4 generation can be used to adjust the lithium content to the desired value.

Figure 3. Impurity regions in the XRD patterns of 1st lithiation step products made at 950°C with Li/TM ratios of 0.95 (a), 0.90 (b), 0.80 (c), and 0.60 (d). The reference XRD pattern of Li5AlO4 (JCPDS #00-027-1209) (e). The relative intensity of the overlapping (011)/(101) Bragg peaks of Li5AlO4 as a function of Li/TM ratio and sintering temperature.
Figures 4a–4d show the SEM images of 1st step lithiation products: sample A (made with a Li/TM ratio of 0.8 at 950°C), sample B (made with a Li/TM ratio of 0.9 at 900°C), sample C (made with a Li/TM ratio of 0.95 at 875°C), and sample D (made with a Li/TM ratio of 0.975 at 850°C), respectively. Figures 4a1/4a2, 4b1/4b2, 4c1/4c2 and 4d1/4d2 show the SEM images of the 2nd lithiation products of samples (A–D) shown in Figures 4a–4d. These samples will be called A1/A2, B1/B2, C1/C2, and D1/D2, respectively, in the remaining text. It was assumed that all the lithium atoms added in the first-step lithiation were incorporated into the product of the first-step lithiation. In the 2nd step lithiation, the amount of additional LiOH•H2O to be added was determined by the desired final Li/TM ratio, and two final Li/TM ratios, 1.01 and 1.02, were selected in this work. Figure 4 shows that after the 2nd step of heating at a standard lithiation temperature of 735°C, the particle size was maintained, and no obvious existence of residual lithium compounds (these would be captured as dark spots in images taken by a backscattered electron detector) was observed.
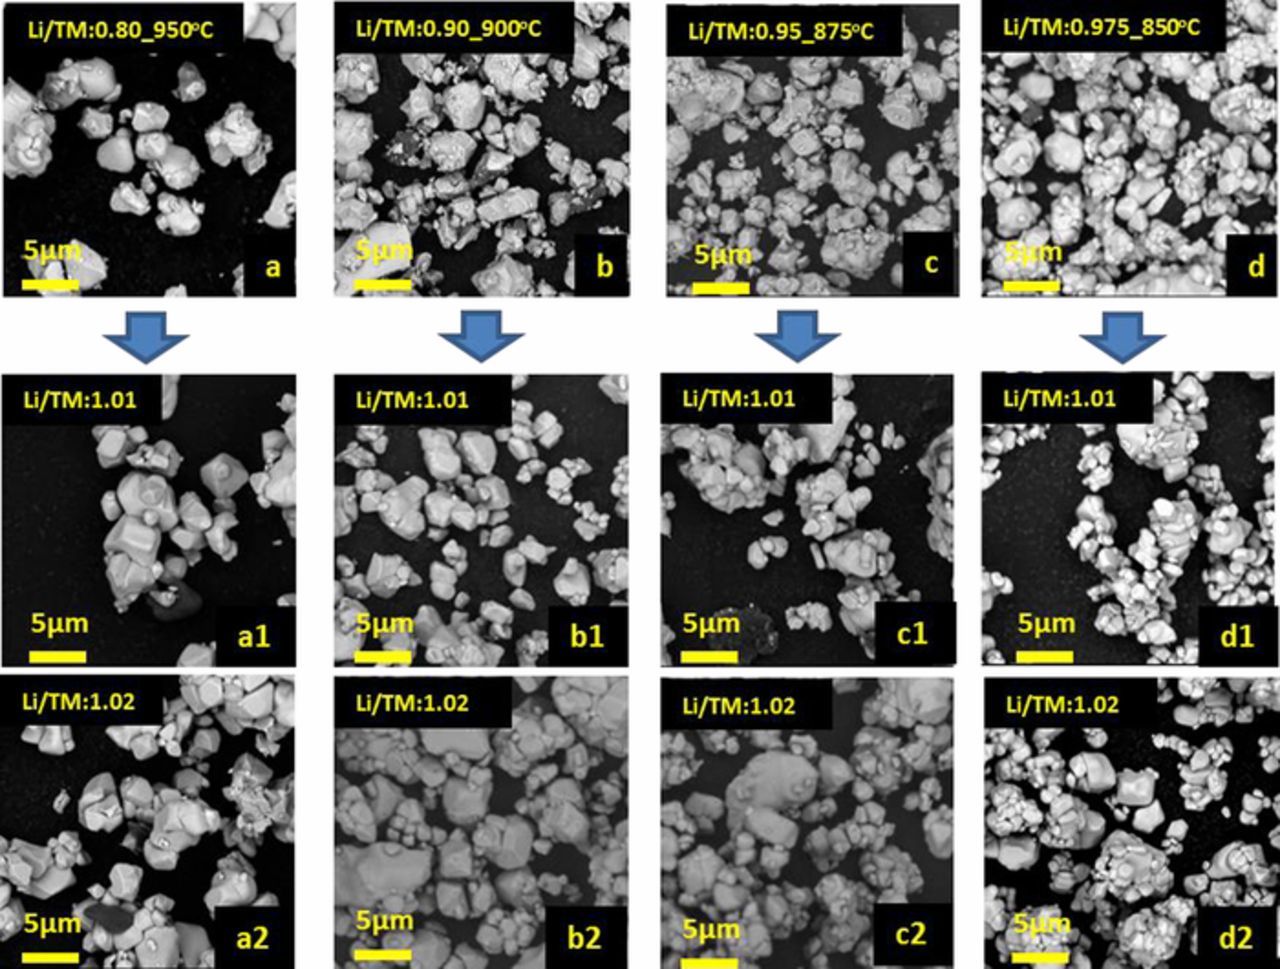
Figure 4. SEM images of 1st lithiation step products: sample A (a), sample B (b), sample C (c), and sample D (d). SEM images of 2nd lithiation step products of sample A (a1),(a2); sample B (b1),(b2); sample C (c1),(c2); and sample D (d1),(d2) with overall Li/TM ratios of 1.01 or 1.02.
Figures 5a–5d show the XRD patterns of the (104) Bragg peaks of the 1st step lithiation products from samples A, B, C, and D; Figures 5a1/5a2, 5b1/5b2, 5c1/5c2, and 5d1/5d2 show the XRD patterns of the (104) Bragg peaks of the 2nd step lithiation products, samples A1/A2, B1/B2, C1/C2, and D1/D2, respectively. Figures 5A–5A2, 5B–5B2, 5C–5C2, and 5D–5D2 show the impurity region between 18–35° in the XRD patterns of the corresponding samples. Figure 5a plots the (104) Bragg peak of sample A with a blue line, and the red dashed like marks the position of the Kα1 peak. Figure a1 and a2 show that after the 2nd step lithiation, the (104) peaks of samples A1 and A2 moved slightly toward higher angle, which indicates that more lithium has been incorporated in the structure.32 However, a "shoulder" peak can be observed in both Figure a1 and a2, and it is at the position marked by the red dashed line. The "shoulder" peaks are believed to be a remaining feature of the product of the 1st lithiation step. This suggests that the 2nd lithiation step did not fully compensate for the lithium deficiency left from the 1st lithation step. Similar "shoulder" peaks were also observed in Figure b1 and b2, and peak broadening can be observed in Figure c1 and c2. However, Figure d1 and d2 show that samples D1 and D2 have more a complete 2nd lithiation step. The change in (104) Bragg peak before and after the second- lithiation step shows that to ensure a fully lithiated final product, the extent of lithium deficiency in the 1st lithiation step needs to be relatively small.
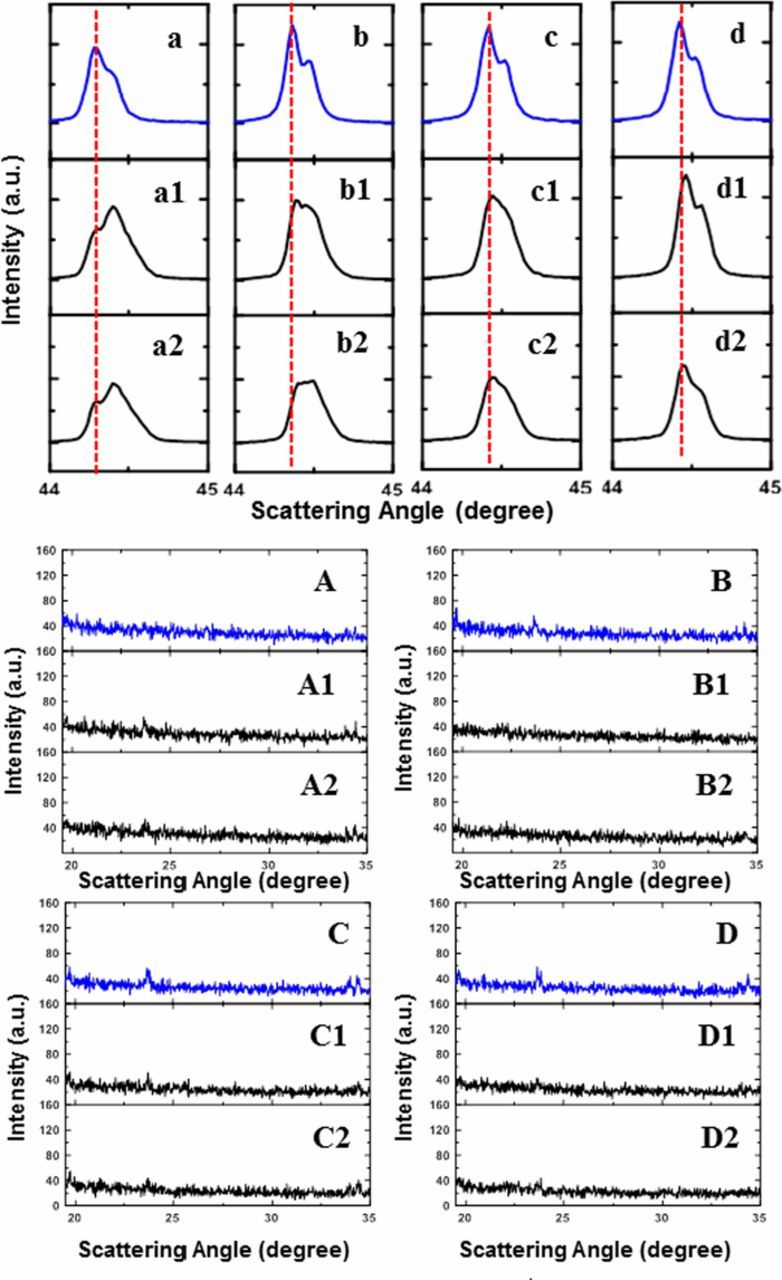
Figure 5. XRD patterns of (104) Bragg peaks of 1st lithiation step products: sample A (a), sample B (b), sample C (c), and sample D (d); XRD patterns of (104) Bragg peaks of 2nd lithiation step products of sample A (a1),(a2); sample B (b1),(b2); sample C (c1),(c2); and sample D (d1),(d2) with overall Li/TM ratios of 1.01 or 1.02. Figure 5A–5A2, 5B–5B2, 5C–5C2, and 5D–5D2 show the impurity region between 18–35° in the XRD patterns of the corresponding samples.
Considering the amount of Li5AlO4 in the samples, Figure 5A shows that there was no Li5AlO4 detected by XRD after the 1st lithiation step, while after the 2nd step of lithiation, the Li5AlO4 impurity diffraction peak is observed in Figures 5A1 and 5A2. This is consistent with the previous discussion that the 2nd lithiation step of sample A made at 950°C with a Li/TM ratio of 0.8 was not complete and some lithium was in the form of Li5AlO4. Figures 5B–5D show the existence of the Li5AlO4 impurity after 1st lithiation step, and Figures 5B1/5B2, 5C1/5C2, and 5D1/5D2 show that the diffraction peak of Li5AlO4 became less intense after the 2nd lithiation step at lower temperature. This suggests that the amount of Li5AlO4 impurity formed during the first lithiation step can possibly be reduced during the 2nd lithiation step at a lower temperature, and that the amount of additional lithium source that used needs to be carefully controlled.
To evaluate the outcome of the 2nd lithiation step, Rietveld refinement was performed on the XRD patterns of samples C, C1, C2, D, D1 and D2. The α-NaFeO2 structure in the R-3m space group was used to describe the structure. For samples C and D, which were made with Li/TM ratios of 0.95 and 0.975 in the 1st lithiation step, respectively, it was assumed that there was no lithium loss during the 1st lithiation step. Thus, the refinements on samples C and D were performed with an initial formula of [Li0.974Ni0.026]3a[Ni0.877Co0.092Al0.031]3bO2, and [Li0.987Ni0.013]3a[Ni0.879Co0.091Al0.030]3bO2, respectively. For samples C1/C2 and D1/D2, it was assumed that the final products made after the 2nd lithiation step have a Li/(NiCoAl) ratio of 1 because NCA material cannot accommodate excess lithium in its structure, so the refinements were performed with an initial formula of [Li]3a[Ni0.88Co0.09Al0.03]3bO2. In the refinements, exchange of Li and Ni between the predominantly Li layer (3a sites) and the predominantly transition metal layer (3b sites) was allowed subject to the constraint that the overall stoichiometry was fixed. Figure 6 shows the percentage of sites in the Li layer occupied by Ni in samples C, C1, C2, and samples D, D1, D2. Figure 6 shows that after the 1st lithiation step with a Li/TM ratio smaller than 1, samples C and D have 9.2(1)% and 5.2 (1)% Ni atoms in the Li layer, respectively. After the 2nd lithiation step with Li/TM ratios of 1.01 and 1.02, samples C1/C2 and D1/D2 show that the Ni/Li interlayer mixing was significantly reduced, indicating the effectiveness of 2nd lithiation step.
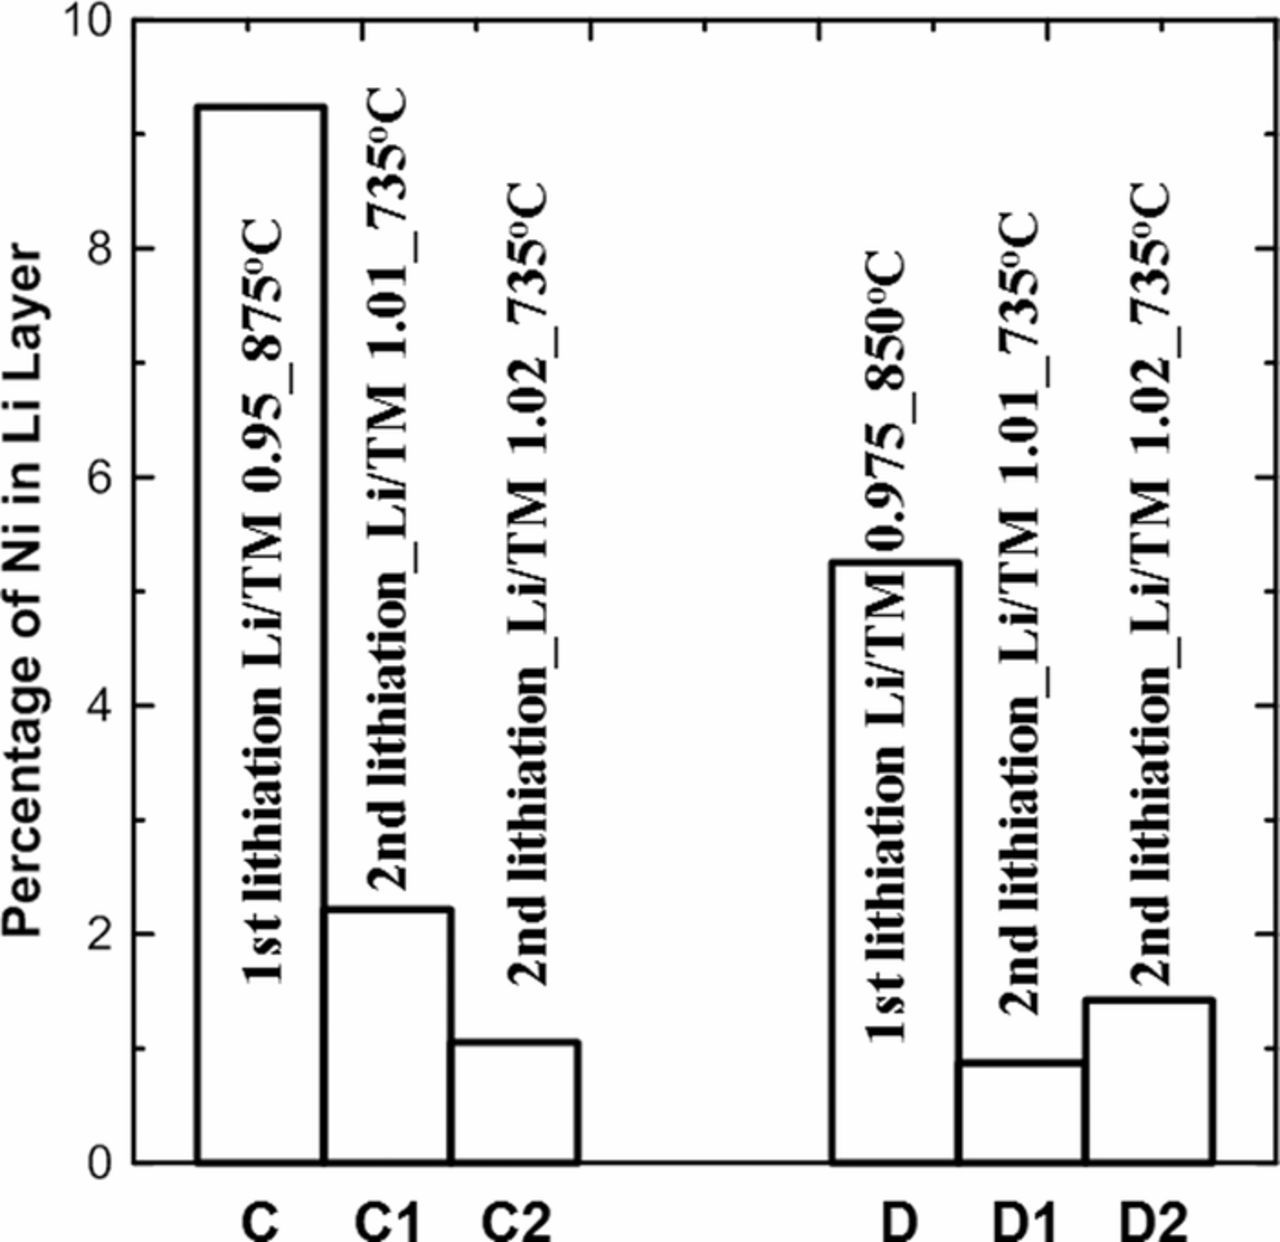
Figure 6. Fraction of sites in the Li layer occupied by Ni in the first lithiation step products (samples C/D), and the second lithiation step products (samples C1/C2 and samples D1/D2).
Sample D1, which had the smallest amount of Ni/Li mixing after the 2nd lithiation step was selected as the single crystal sample (SC880903) for further studies. Polycrystalline NCA880903 (PC880903) was made as described in Ref. 25 for comparison. Figures 7a and 7b show the SEM images of PC880903 and SC880903, respectively. The SEM image of PC880903 shows large-size dense spherical secondary particles consisting of primary particles about ∼100 nm in size. The image of SC880903 shows 2–5 μm primary particles with some agglomerates. Figure 7c shows the particle size distribution plots of sample D and sample D1 (SC880803). Figure 7c shows that the desired particle size made in the 1st lithiation step lithiaton was well-preserved after the 2nd lithiation step.

Figure 7. SEM images of PC880903 (a) and SC880903 (b). Particle size distribution plot of sample D and D1(SC880903) (c). Full XRD patterns of PC880903 (d), expanded views of the (104) Bragg peak (e), and the (108)/(110) Bragg peaks (f); full XRD patterns of SC880903 (g), expanded views of the (104) Bragg peak (h), and the (108)/(110) Bragg peaks (i).
Figures 7d–7f and 7g–7i show the XRD patterns of PC880903 and SC880903, respectively. Figures 7e and 7h show an expanded view of the (104) Bragg peak, and Figures 7f and 7i show an expanded view of the (108)/(110) Bragg peaks. The black circles are the measured diffraction data, and the solid red lines show the calculated pattern from Rietveld refinement. The green lines show the differences between the measured and calculated patterns. The expanded views of the (104) Bragg peak and the (108)/(110) Bragg peaks show that SC880903 has less peak broadening and better resolved Kα1 and Kα2 diffraction peak splitting due to better crystallinity. Table I summarizes the Rietveld refinement results.
Table I. Rietveld refinement results of PC880903 and SC880903.
| 1st Lithiation Condition | 2nd lithiation Temperature | Overall Li/TM Ratio | a (Å) (±0.0001 Å) | c(Å) (±0.001 Å) | Ni/Li Mixng (%) | RBragg | |
|---|---|---|---|---|---|---|---|
| PC880903 | Li/TM 1.02 735°C | N/A | 1.02 | 2.8690 | 14.194 | 0.61(4) | 1.86 |
| SC880903 | Li/TM 0.975 850°C | 735°C | 1.01 | 2.8718 | 14.189 | 0.88(5) | 2.13 |
Previously reported synthesis methods for making single crystal NMC532 and NMC622 showed that the sintered materials were "brick"-like chunks that needed to be re-pulverized by grinding aggressively because of the use of excess lithium source and high sintering temperature.15,26 With the two-step lithiation method, which avoids the use of excess lithium source in the 1st lithiation step, no "bricking" was observed.
To confirm if the synthesized SC880903 consists of single crystal particles, electron backscatter diffraction (EBSD) was performed on cross sections of SC880903 powders. Figure 8A shows a cross-sectional SEM image of the SC880903 sample. Figure 8B shows band contrast mapping of the selected region. The white colored grains show a quality of crystallographic match between the material and the R-3m reference lattice, and the grain boundaries can be clearly observed as dark lines due to poor match quality with the reference. Figure 8C shows an Euler map of the same region with grains colored based on their Euler angles. The three Euler angles ϕ1, Φ, and ϕ2 represent a series of rotations about the z, x, and the rotated z axes that needed to be performed on the reference crystal orientation to match the orientation of a grain in the sample. Thus in Figure 8C, grains with different colors have different orientations. Figures 8B and 8C show that most particles are single crystal grains, while some large sized particles consist of small grains. This indicates the synthesized material consists both mono-dispersed single crystal particles and agglomerates, and this is also observed in commercial single crystal NMC532 materials.25 More optimization of the heating process or the addition of some post heating processing needs to be considered to improve material quality.
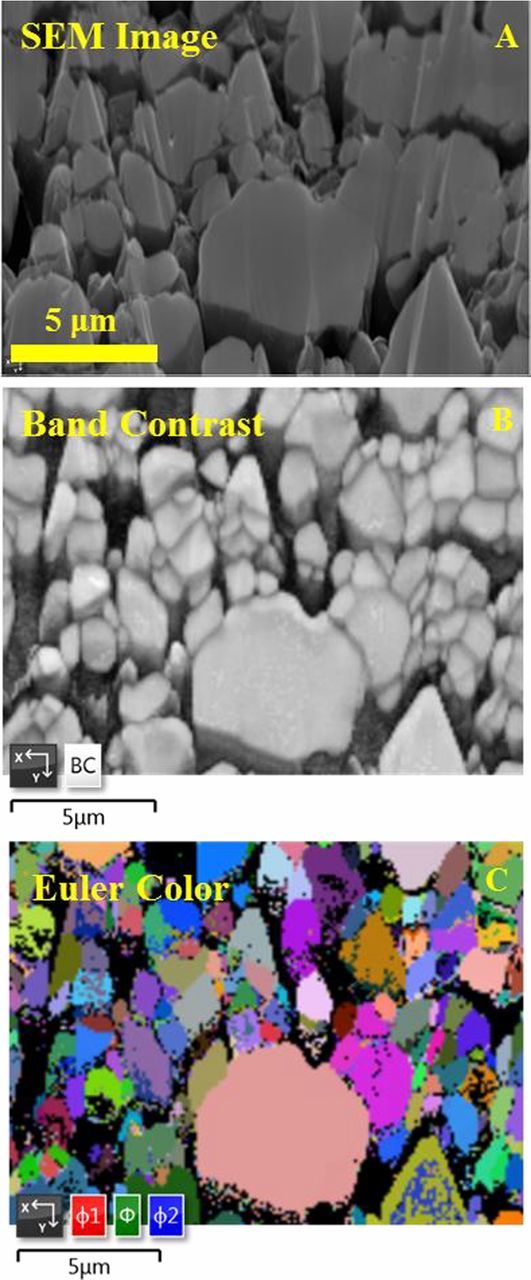
Figure 8. Cross-sectional SEM images of SC880903 (A), where the white rectangular box marks the region where the EBSD mapping was performed. The band contrast EBSD map (B) and the EBSD orientation map (C) of the selected region. The three Euler angles φ1, Φ, and φ2 represent a series of rotation about the z, x, and rotated z axes. Each color indicates a specific crystal orientation of the grains.
Figure 9 shows some of the electrochemical measurements made on the SC880903 and PC880903 samples. Figure 9a shows the cell voltage as a function of specific capacity, and Figure 9b shows the corresponding differential capacity versus voltage (dQ/dV vs. V). Cells were cycled with a current density of 10 mA/g (∼C/20) at 30°C in control electrolyte, and duplicate cells are represented by solid and dashed lines in the same color. SC880903 shows slightly smaller specific capacity compared with PC880903 presumably due to the longer Li+ diffusion path in SC880903. The same dQ/dV vs. V features suggest that SC880903 made by two-step lithiation has the same electrochemical features as conventional PC880903. The diminished "kinetic hindrance" peaks at 3.5–3.6 V of SC880903 indicates that Li+ diffusion is kinetically hindered in this voltage range, which is consistent with the larger single crystal grains.
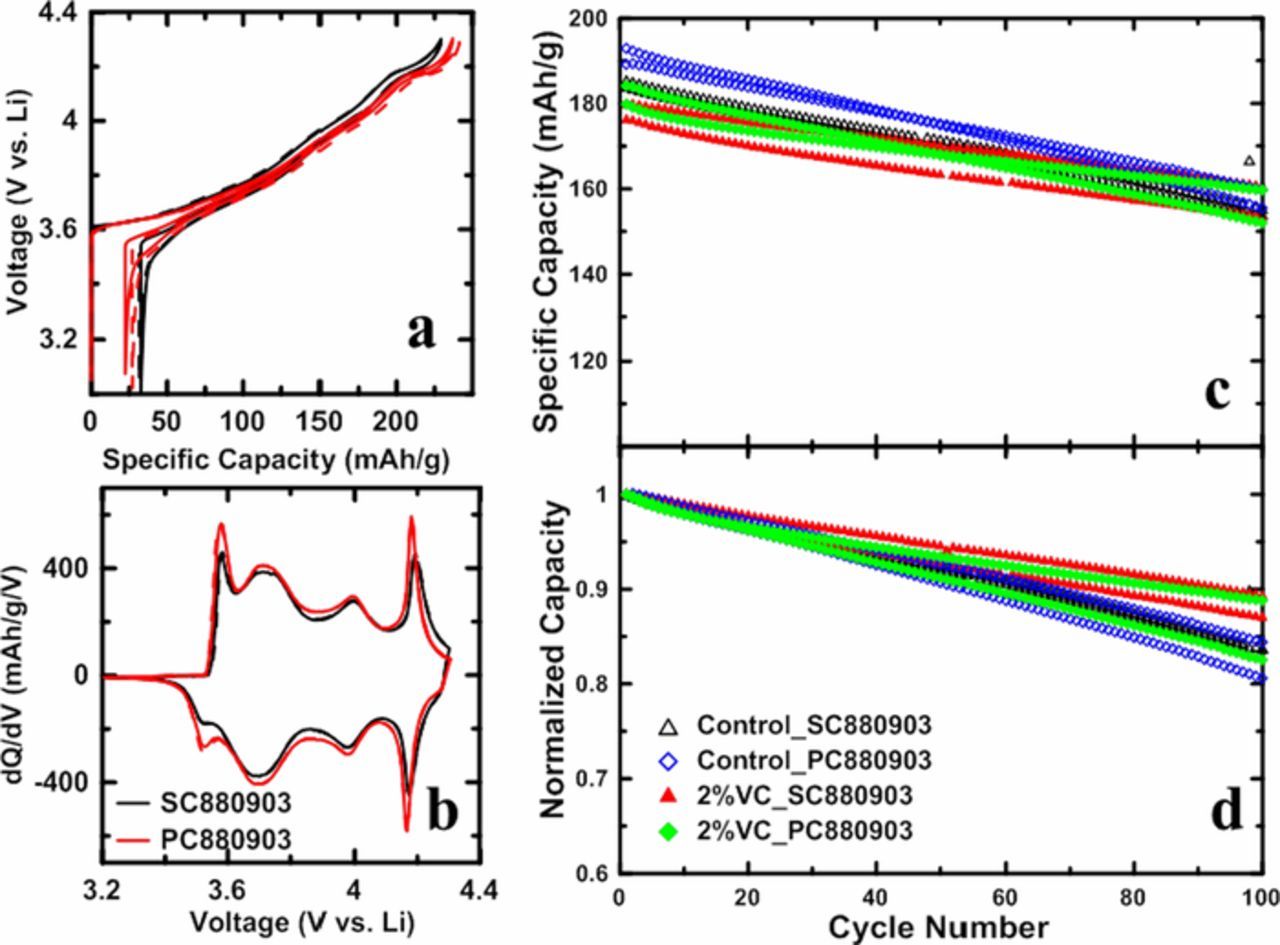
Figure 9. Cell voltage as a function of specific capacity for SC880903 and PC880903 samples (a); differential capacity as a function of cell voltage (dQ/dV vs. V) for SC880903 and PC880903 samples (b). The half cells were cycled with a current density of 10 mA/g (∼C/20) at 30°C. Specific capacity (c) and normalized capacity (d) as a function of cycle number for SC880903 and PC880903 full coin cells with control electrolyte and 2%VC electrolyte, cells were cycled with a current density of 40 mA/g (∼C/5) at 30°C.
Figure 9 also shows specific capacity (9c) and normalized capacity (9d) as a function of cycle number for PC880903 and SC880903 samples in both control electrolyte and 2%VC electrolyte. Full coin cells were cycled with a current density of 40 mA/g (∼C/5) at 30°C. This set of cycling data illustrates that the capacity retention for the single crystal sample is at least as good as the polycrystalline sample when 2% VC is used. J. Li et al.25,33 have shown that electrolyte additives are critical for single crystal positive electrode materials to demonstrate the benefits of particle integrity preservation. We are optimistic that with appropriate electrolyte additives, single crystal NCA can show many advantages over polycrystalline NCA, but this requires extensive further efforts.
Conclusions
In summary, this work introduced a two-step lithiation method for single crystal NCA synthesis. When a deficient amount of lithium source is used in the 1st lithiation step, the formation of Li5AlO4 can be suppressed with particle growth unaffected, and "bricking" of the product can be eliminated as well. The 2nd lithiation step at lower temperature with additional lithium source can reduce the Li/Ni interlayer mixing caused in the 1st lithiation step. XRD, EBSD and electrochemical measurements indicate that this method can produce impurity-free single crystal NCA synthesis. It is believed that this method can also be applied in the synthesis of other single crystal positive electrode materials containing aluminum. The full coin cell cycling shows that the capacity retention of single crystal NCA synthesized with the two-step lithiation method is comparable to conventional polycrystalline NCA samples when 2%VC was used as an electrolyte additive. More efforts focusing on synthesis optimization and post synthesis processing are necessary for material quality improvement. Electrolyte additive development for single crystal NCA will be essential for the single crystal materials to show great advantages over conventional polycrystalline counterparts.
Acknowledgments
The authors thank NSERC and Tesla Canada for the funding of this work under the auspices of the Industrial Research Chairs program. Hongyang Li thanks the Nova Scotia Graduate Scholarship program for financial support. Ning Zhang thanks the China Scholarship Council for generous support.
ORCID
J. R. Dahn 0000-0002-6997-2436