Abstract
It has been very difficult to remove smaller ceria particles from silicon dioxide surfaces. One of the likely reasons is that the smaller ceria particles with a higher surface concentration of Ce3+ are more strongly coupled with silicon dioxide surfaces via strong Ce-O-Si bonding. Here, we show that some equimolar solutions containing H2O2 and either NH4OH or KOH, aided by ultrasonic cleaning, and at high pH can almost completely remove even 10 nm sized ceria particles from silicon dioxide film surfaces. The particles on the oxide surface before and after cleaning were imaged using atomic force microscopy and counted. The optimal composition of H2O2-NH4OH solutions was identified by investigating ten solutions with different compositions using an augmented simplex-centroid method along with four H2O2-KOH solutions. Equimolar mixtures of H2O2 and NH4OH or KOH with the highest possible perhydroxyl ion concentration [HO2−] showed ∼99% cleaning efficiency for 10 nm ceria particles. We propose that the strong Ce-O-Si bonding can be ruptured effectively by the nucleophile HO2−, formed by the decomposition of H2O2 in the high pH environment, and show that [HO2−] is highest in equimolar solutions. The cleaning efficiencies for 10 nm, 30 nm and 90 nm particles correlate very nicely with [HO2−].
Export citation and abstract BibTeX RIS

This is an open access article distributed under the terms of the Creative Commons Attribution Non-Commercial No Derivatives 4.0 License (CC BY-NC-ND, http://creativecommons.org/licenses/by-nc-nd/4.0/), which permits non-commercial reuse, distribution, and reproduction in any medium, provided the original work is not changed in any way and is properly cited. For permission for commercial reuse, please email: oa@electrochem.org.
In current complimentary metal-oxide semiconductor (CMOS) devices, the minimum feature size has shrunk below 14 nm.1,2 These advanced devices require stringent conditions along the entire manufacturing process to prevent defects that can lead to device failure and reliability issues. Hence, defects caused by residual particles, foreign materials, scratches, corrosion, etc. should be avoided during chemical mechanical planarization (CMP) process.3–5 Indeed, post-CMP cleaning has become a crucial step to eliminate many of these defects.1,5,6 Wet cleaning is customarily used to clean residual particles, organic residues, and metallic contaminants from surfaces.6–8 Wet cleaning solutions such as aqueous ammonia-peroxide-mixture (APM), hydrochloric acid-peroxide-mixture (HPM), and sulfuric acid-peroxide-mixture (SPM) are commonly employed to clean the wafers with each mixture removing specific contaminants.8
Cleaning is achieved by either physical cleaning such as PVA brush scrubbing and mega-sonication or chemical cleaning through under-cut or bond rupture and particle lift-off or their combination.9–12 Standard Clean 1 (SC1) solution consisting of 1:1:5 (v/v/v) mixture of NH4OH (30 wt%)/H2O2 (30 wt%)/Deionized water (DIW) combined with brush scrubbing at low megasonic powers has been widely used to remove residual particles on various surfaces after polishing.7,8 However, it has been very difficult to eliminate particles smaller than 50 nm by either physical or chemical means as they strongly adhere to the wafer surface due to higher surface reactivity.13,14
With shrinking feature sizes, smaller and smaller abrasive particles are being used in CMP slurries to obtain defect-free surfaces. In order to improve the efficiency of cleaning solutions for such small particles, additives such as tetra methyl ammonium hydroxide (TMAH),15 organic acids,12 surfactants,16–18 and complexing agents containing amine or carboxyl functional groups have been investigated and proven to be more or less effective for cleaning metal surfaces after CMP.19–21 Although ceria-based slurries have been widely used for SiO2 polishing due to high material removal rate (MRR) and selectivity, especially for STI structure formation,22–25 there are very few reports describing their efficient removal from SiO2 surfaces, especially for particles smaller than ∼100 nm.26,27 Hence, to facilitate the use of smaller ceria particles in polishing slurries for 14 nm and future technology nodes, it is essential to understand the cleaning mechanism for smaller ceria particles and improve their cleaning efficiency.
The concentration of Ce3+ species at the particle surface increases with decreasing size.28–30 The higher Ce3+ concentration on the surface of the smaller ceria particles can increase the formation of strongly bound Ce-O-Si structures, making their removal very difficult.
In this study, we propose H2O2-based solutions containing NH4OH or KOH at high pH for removal of sub-50 nm ceria particles in an ultrasound-aided environment. Based on response surface methodology (RSM) coupled with an augmented simplex-centroid design, we identified mixtures of H2O2 (30wt%) and NH4OH (30 wt%) or KOH (30wt%) that achieved a cleaning efficiency of ∼99% for 10 nm ceria particles at pH ∼ 13, as determined by AFM-based particle counting. In contrast, the cleaning efficiency of the SC1 solution for the same 10 nm ceria particles is below 20%. The perhydroxyl anions (HO2−) formed from the decomposition of H2O2 at high pH in the optimized compositions appear to disrupt the strong Ce-O-Si bonds and assist cleaning.
Experimental
Materials
Three different colloidal ceria slurries (HC10, HC30, and HC90, hereafter referred to as 10 nm-ceria, 30 nm-ceria and 90 nm-ceria slurries, respectively) were obtained from Solvay. The natural pH of all the three slurries was 4.5. Ammonium hydroxide (30 wt% NH4OH), potassium hydroxide (99.98% KOH), and hydrogen peroxide (30 wt% H2O2) were purchased from Ricca Chemical Co., Alfa Aesar, and Fisher Chemical, respectively. 30 wt% and 33 wt% KOH solutions were prepared by dissolving KOH pellets in DIW. 2000 nm thick oxide films deposited on 200 mm diameter Si wafers by plasma-enhanced deposition using tetraethyl orthosilicate (PETEOS) were bought from DK Nanotechnology and were diced into 1 × 1 cm2 pieces for cleaning experiments. Sodium silicate solution (Na2O(SiO2)x, SiO2 ∼ 26.5%) was purchased from Sigma Aldrich. Two types of silicate-covered ceria particles, A and B, were prepared by adding 0.01 wt% or 0.1 wt% sodium silicate solution, adjusted to pH 5.0, to 5 wt% 10 nm-ceria dispersions and mixing them for 60 min. The resulting suspensions were centrifuged for 30 min at 6000 rpm, the solids collected were dried in a convection oven at 120°C for 12 hrs and then analyzed by Fourier Transform Infrared (FT-IR) spectroscopy.
Preparation of NH4OH-peroxide and KOH-peroxide solutions
Ten different H2O2-NH4OH solutions (single, binary, and ternary mixtures) were prepared with different concentrations of H2O2 (30 wt%) and NH4OH (30 wt%) in DIW based on an augmented simplex-centroid method (details in section Statistical analysis) along with the SC1 cleaning solution which is a 1:1:5 (v/v/v) mixture of H2O2 (30 wt%)/NH4OH (30 wt%)/DIW. Four different solutions of KOH-peroxide mixtures were also prepared by mixing H2O2 (30 wt%) and KOH (30 wt%) or KOH (33 wt%) in different volumetric ratios. The pH of the solutions was not adjusted.
Material characterization
Morphological characterization (shape and size distribution) of ceria particles was performed using a transmission electron microscope (TEM, JEOL, JEM-2010). The average sizes (dTEM) of the particles were determined from their images using Image J software. Specific surface area was measured by Brunauer-Emmett-Teller (BET) method using N2 gas adsorption at 77 K (BET, Micromeritics, ASAP 2020). Average particle size (dDLS) and size distribution of ceria particles in slurries were obtained by dynamic light scattering (DLS) at a scattering angle of 173° (Zetasizer Nano-ZS, Malvern) at 25°C. The oxidation states (Ce3+/Ce4+) of the surface Ce ions and their concentrations were determined using X-ray photoelectron spectroscopy (XPS) at the Cornell Center for Materials Research.
Cleaning experiments and AFM-based particle counting
The wafer coupons (1 × 1 cm2) were dipped into 100 mL of 0.05 wt% ceria slurries (10 nm-ceria, 30 nm-ceria and 90 nm-ceria) stirred at 300 rpm for 60 s and were subsequently rinsed with DIW for 30 s to remove unadsorbed particles. These particle-contaminated coupons were then dipped in one of the cleaning solutions while being sonicated in an ultra-sonicator bath (Aquasonic 50HT, VWR Scientific) for 60 s at 25°C, followed by rinsing of the coupons with DIW. The contaminated and cleaned wafer coupons were imaged by Atomic Force Microscopy (AFM) using a Park Systems Corp. XE-300P tool with a PPP-NCHR probe tip in non-contact mode. Images were obtained at a scan rate of 0.5 Hz on a sample area of 1 × 1 μm2, 2 × 2 μm2, and 10 × 10 μm2 for the SiO2 surface contaminated with 10 nm-ceria, 30 nm-ceria and 90 nm-ceria, respectively. Different scan areas were used to ensure the presence of a large enough number of particles. The number of adsorbed ceria particles on wafers was determined using particle tracking software (Semasopht, Diatrack v3.05). Cleaning efficiencies (CE) were calculated using (CE) = [ceria (initial) – ceria (residual)] × 100/ceria (initial). The data were obtained from two different coupons and the average numbers are reported here. Surface roughness (Rq) of the uncontaminated and cleaned wafer coupons was measured over an area of 10 × 10 μm2 using the AFM.
Statistical analysis
Cleaning efficiencies were fitted with the full cubic model, expressed by the following equation:31
where Y is defined by the logit transformation Y = ln (y/(1 − y)) and y is the cleaning efficiency, expressed in the range 0 to 1. x1, x2, and x3 are the volume fractions of H2O2 (30 wt%), NH4OH (30 wt%), and DIW, respectively, and for the SC1 solution they are 0.14, 0.14, and 0.72, respectively. Also, even when x3 is zero, water is present due to the 30 wt% concentrations of peroxide and NH4OH components in the mixture. 'βi' is the regression coefficient for single component, and 'βij' and 'β123' are regression coefficients for interaction effects of binary and ternary mixtures, respectively.
Fourier transform infrared spectroscopy (FT-IR)
50 mL of the optimized H2O2-NH4OH mixture was sonicated along with as-received and silicate covered ceria particles (5 wt%) for 60 min, and then centrifuged for 30 min at 6000 rpm, and the solids were dried in a convection oven at 120°C for 12 h. Surface functional groups of as-received and centrifuged and dried silicate-covered ceria particles after exposure to four different solutions (H2O, H2O2 (30 wt%), NH4OH (30 wt%), and the optimized H2O2-NH4OH solution) were determined from FTIR data obtained using a Thermo Scientific Nicolet iS10 spectrometer and KBr sample pellets.
Results and Discussion
Characterization of ceria particles
Figures 1a–1c show the TEM images of the three different-sized ceria particles used in our investigations. Particle size histograms obtained from TEM images (insets in Figs. 1a–1c) revealed a broad size distribution in all the samples and the average dTEM of three samples was 10 nm (10-ceria), 29 nm (30-ceria), and 98 nm (90-ceria). Also, particle sizes, dBET, were calculated using dBET = 6000/(SSA·ρ), where SSA is the specific surface area (m2/g), and ρ is the density of ceria (7.2 g/cm3). This equation assumes that ceria particles are spherical, dense, and monodispersed. The resulting dBET values were 10 nm (10-ceria), 29 nm (30-ceria), and 104 nm (90-ceria) and are very close to the dTEM values (see Table I). Figure 1d presents the average particle size (dDLS) and size distributions of ceria particles from DLS method. dDLS values were 36 nm (10-ceria), 81 nm (30-ceria), and 193 nm (90-ceria), much higher compared to the dTEM and the dBET values (Table I), implying that the hydrodynamic size of particles in an aqueous medium is larger and reflects the formation of agglomerates.
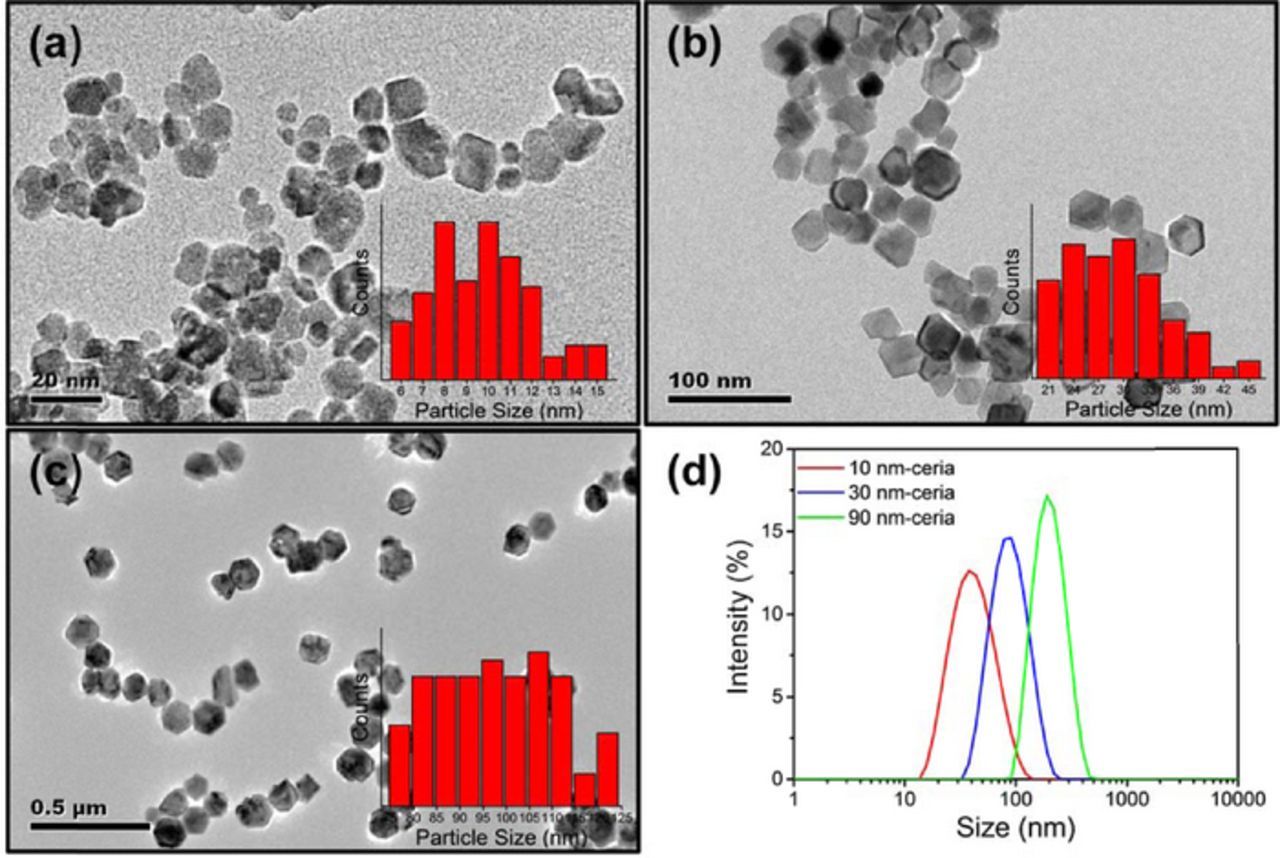
Figure 1. Morphology and size distribution of ceria particles. TEM images of (a) 10 nm-ceria, (b) 30 nm-ceria, and (c) 90 nm-ceria. Insets: particle size distributions. (d) DLS size distributions of ceria particles.
Table I. Physicochemical properties of three-different sized ceria particles. aCalculated from TEM images. bObtained from SBET and cMeasured using DLS method.
| SBET (m2/g) | dTEMa (nm) | dBETb (nm) | dDLSc (nm) | |
|---|---|---|---|---|
| 10 nm-ceria | 84.3 | 10 nm | 10 nm | 36 nm |
| 30 nm-ceria | 28.8 | 29 nm | 29 nm | 81 nm |
| 90 nm-ceria | 8.0 | 98 nm | 104 nm | 193 nm |
Published research shows that the surface Ce3+ ions of ceria particles are the more reactive sites for the formation of strong Ce-O-Si bonds with SiO2 films during polishing.22,23,32 Since the strength of the Ce-O-Si bonds has a significant influence on cleaning properties, it will be useful to evaluate the concentration of Ce3+ ions on the ceria particle surfaces.22,26 The Ce3+/Ce4+ concentration ratios of the three-different sized ceria particles were obtained from Ce 3d5/2 and Ce 3d3/2 XPS spectra shown in Figure 2. To calculate the Ce3+ concentration on the ceria surface, the XPS spectra were divided into eight peaks using the mixed Gaussian–Lorentzian function model. The binding energies (BE) and relative area ratios of the different peaks of ceria particles obtained from this analysis are listed in Table II. The labels v and u indicate the graphs of Ce 3d5/2 and Ce 3d3/2, respectively. XPS peaks denoted as v1 and u1 are assigned to Ce3+ while the peaks denoted as v0, v2, v3, u0, u2, and u3 represent Ce4+.33,34 The relative Ce3+ concentration on the ceria particle surface was calculated from the total integrated area of v1 and u1 peaks. As shown in Table II, 10 nm-ceria particles show a somewhat higher Ce3+ concentration (26%) than the other two (18% for 30 nm-ceria and 15% for 90 nm-ceria particles). The XPS results obtained for particles of different sizes obtained in our study are in agreement with previous reports.28–30
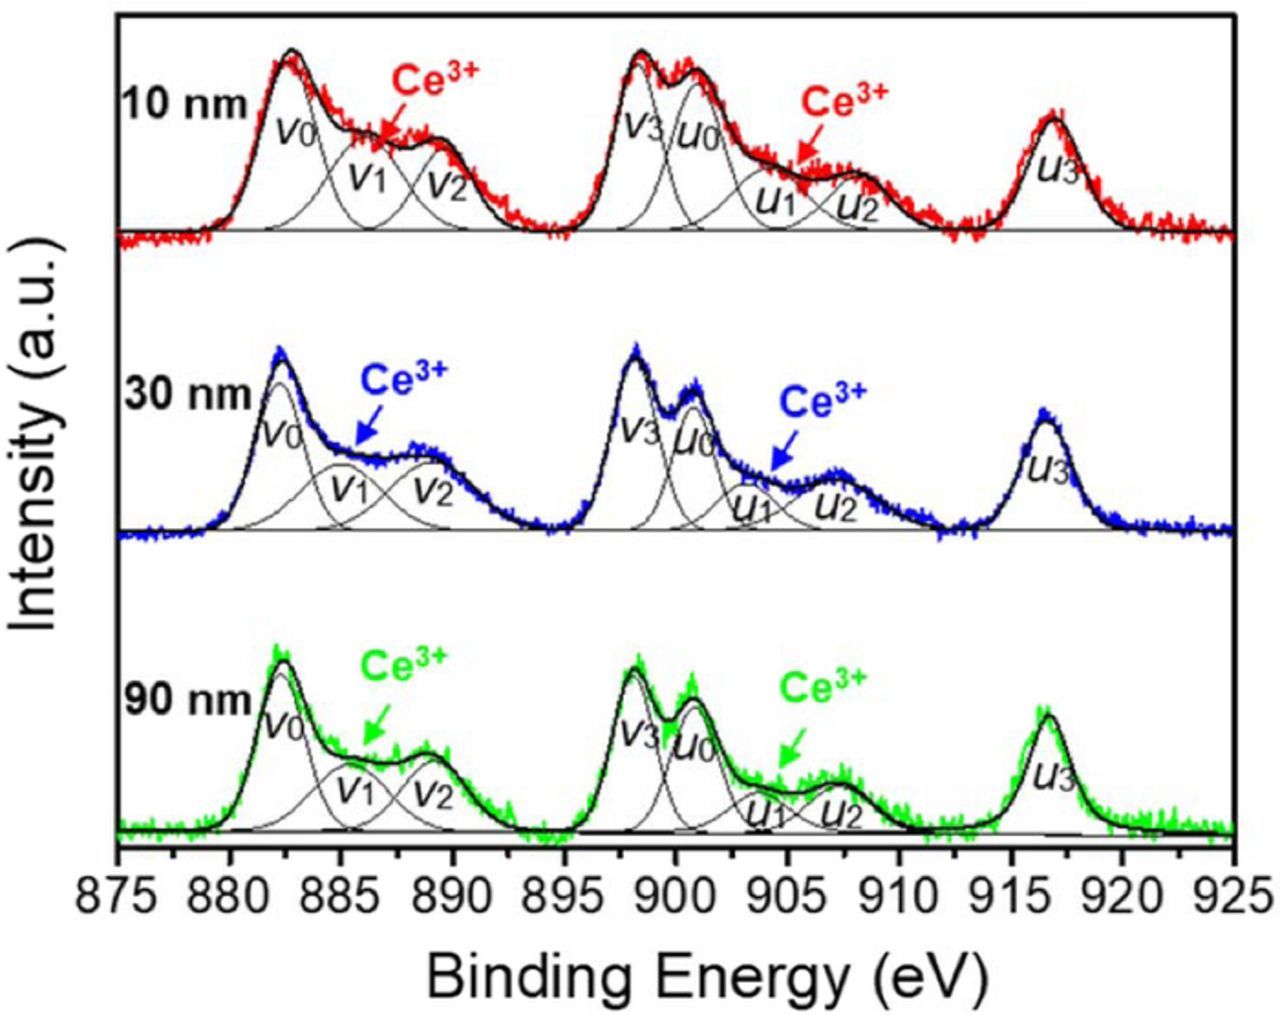
Figure 2. Ce3d XPS spectra of three-different sized ceria particles.
Table II. XPS binding energies (eV) and relative area ratios (%) of individual peaks of Ce 3d for ceria particles.
| Ce 3d5/2 | Ce 3d3/2 | |||||||||
|---|---|---|---|---|---|---|---|---|---|---|
| v0 | v1 | v2 | v3 | u0 | u1 | u2 | u3 | |||
| Peak assignment | Ce4+ | Ce3+ | Ce4+ | Ce4+ | Ce4+ | Ce3+ | Ce4+ | Ce4+ | Ce3+ (%) | |
| 10 nm-ceria | Binding energy (eV) | 882.5 | 885.8 | 889.6 | 898.1 | 900.4 | 902.6 | 907.4 | 916.9 | 26.3 |
| Peak area (%) | 16.9 | 14.9 | 9.6 | 13.0 | 12.1 | 11.4 | 9.9 | 12.2 | ||
| 30 nm-ceria | Binding energy (eV) | 882.2 | 885.0 | 889.1 | 898.5 | 900.8 | 903.1 | 907.1 | 916.1 | 18.4 |
| Peak area (%) | 16.0 | 12.2 | 13.1 | 17.7 | 11.9 | 6.2 | 9.7 | 13.2 | ||
| 90 nm-ceria | Binding energy (eV) | 882.4 | 885.6 | 889.1 | 898.2 | 900.9 | 903.5 | 907.5 | 916.6 | 15.0 |
| Peak area (%) | 19.4 | 9.0 | 12.3 | 16.7 | 15.9 | 6.0 | 7.8 | 12.9 | ||
Size-dependent cleaning efficiency of ceria particles using SC1 cleaning
Cleaning efficiency of SC1 solutions for the three-different sized ceria particles was measured by AFM as described in the Experimental section. The number of adsorbed ceria particles on the SiO2 surface obtained from AFM images is 230 for 10 nm-ceria, 248 for 30 nm-ceria, and 118 for 90 nm-ceria in the scan area of 1 × 1 μm2, 2 × 2 μm2, and 10 × 10 μm2, respectively (Figure 3), corresponding to 2.3 × 10⁴, 6.2 × 10³ and 1.1 × 10² particles, respectively, when normalized to a 10 × 10 μm2 area (Table III). Different scan areas were chosen depending on the particle size to obtain adequate number of particles in the AFM images. Since the number of the smaller 10 nm-particles is about 100 times larger than that of 90 nm-particles in the same area, we used different scan areas while imaging them.
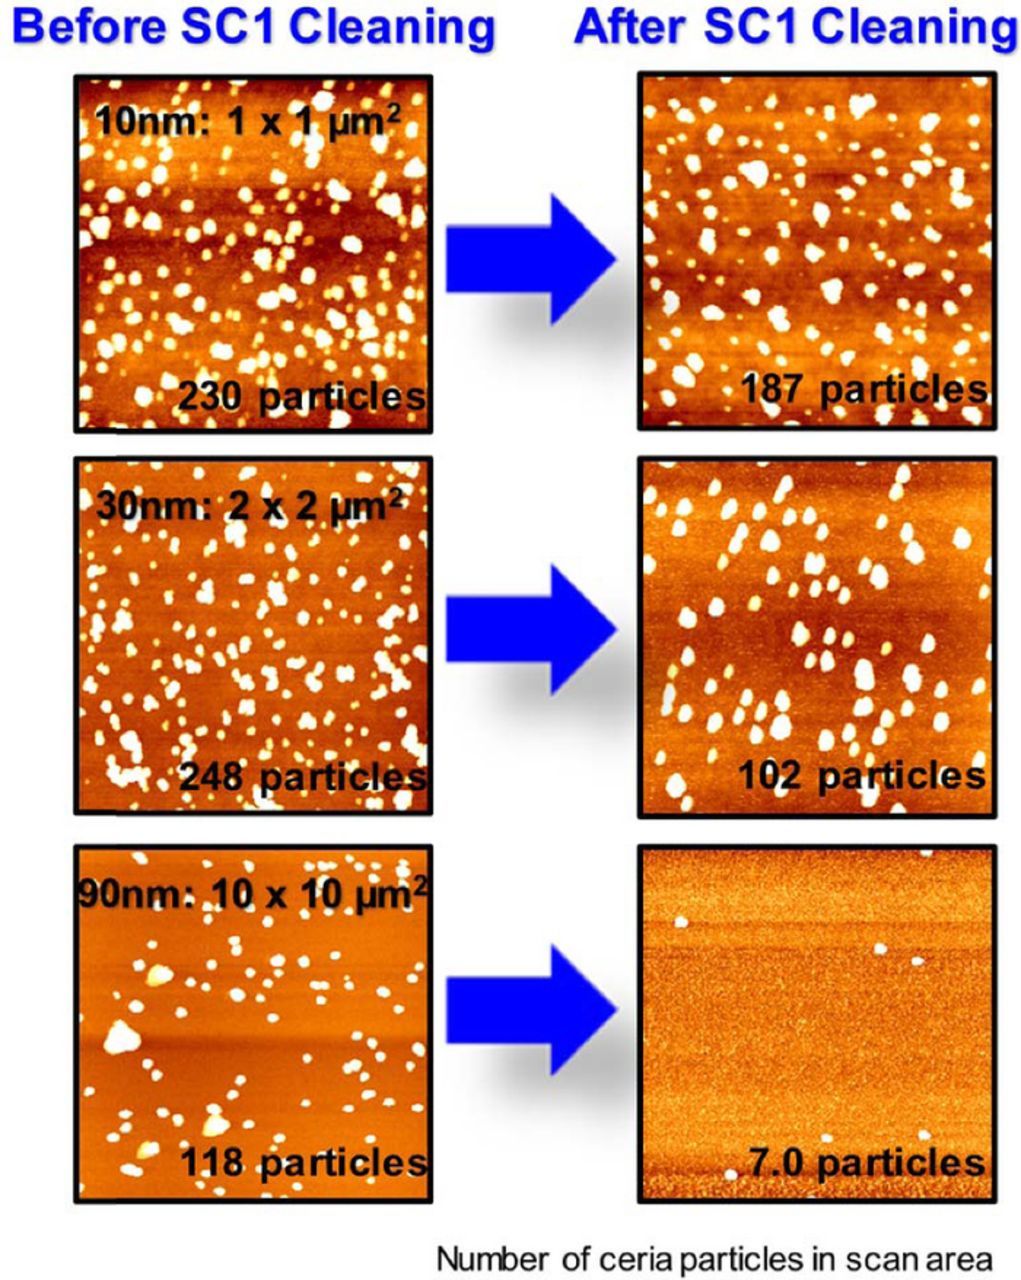
Figure 3. Topographic AFM images of adsorbed ceria particles on a SiO2 surface and the corresponding number of particles before and after SC1 cleaning in scan areas of 1 × 1 μm2 (10 nm-ceria), 2 × 2 μm2 (30 nm-ceria), and 10 × 10 μm2 (90 nm-ceria).
Table III. Number of adsorbed ceria particles on SiO2 surface before and after SC1 cleaning in 10 × 10 μm2 area.
| Number of adsorbed ceria particles | |||
|---|---|---|---|
| Cleaning Efficiency | Initial | Residual | Cleaning Efficiency |
| 10 nm-ceria | 23050 | 18700 | 19% |
| 30 nm-ceria | 6200 | 2550 | 58% |
| 90 nm-ceria | 118 | 7 | 94% |
After SC1 cleaning, only about 20% of the 10 nm-ceria particles were removed whereas ∼ 58% of the 30 nm-ceria and ∼ 94% of the 90 nm-ceria particles were removed (Figure 3 and Table III) consistent with recent reports that it is more difficult to remove smaller particles.13,14
H2O2-NH4OH mixtures and their optimal composition
To find out if other compositions of the H2O2-NH4OH solutions can achieve improved cleaning efficiency, we prepared 10 different mixtures of H2O2 (30 wt%) and NH4OH (30 wt%) in DI water based on an augmented simplex-centroid method.35 We based the compositions on 30 wt% H2O2 and NH4OH solutions as the components to be consistent with the industry usage for the SC1 solution. Thus, all these solutions have the same components as the SC1 solution, but with different volumetric ratios and, hence, slightly different pH values. Also, since these compositions reflect the volume percentages of the 30 wt% solutions and water, it means that the true composition of water in the mixtures is much higher than that indicated by x3.
Figure 4a shows the augmented simplex centroid design of H2O2 (30 wt%), NH4OH (30 wt%), and H2O compositions. Vertices of the simplex (S1-S3) are the "single" components of NH4OH (30 wt%), H2O2 (30 wt%), and H2O. The points on the lines connecting the vertices (B1-B3) represent binary mixtures of NH4OH (30 wt%), H2O2 (30 wt%), and H2O. The inner points in the simplex (T1-T4) indicate ternary mixtures of H2O2 (30 wt%)-NH4OH (30 wt%)-H2O.
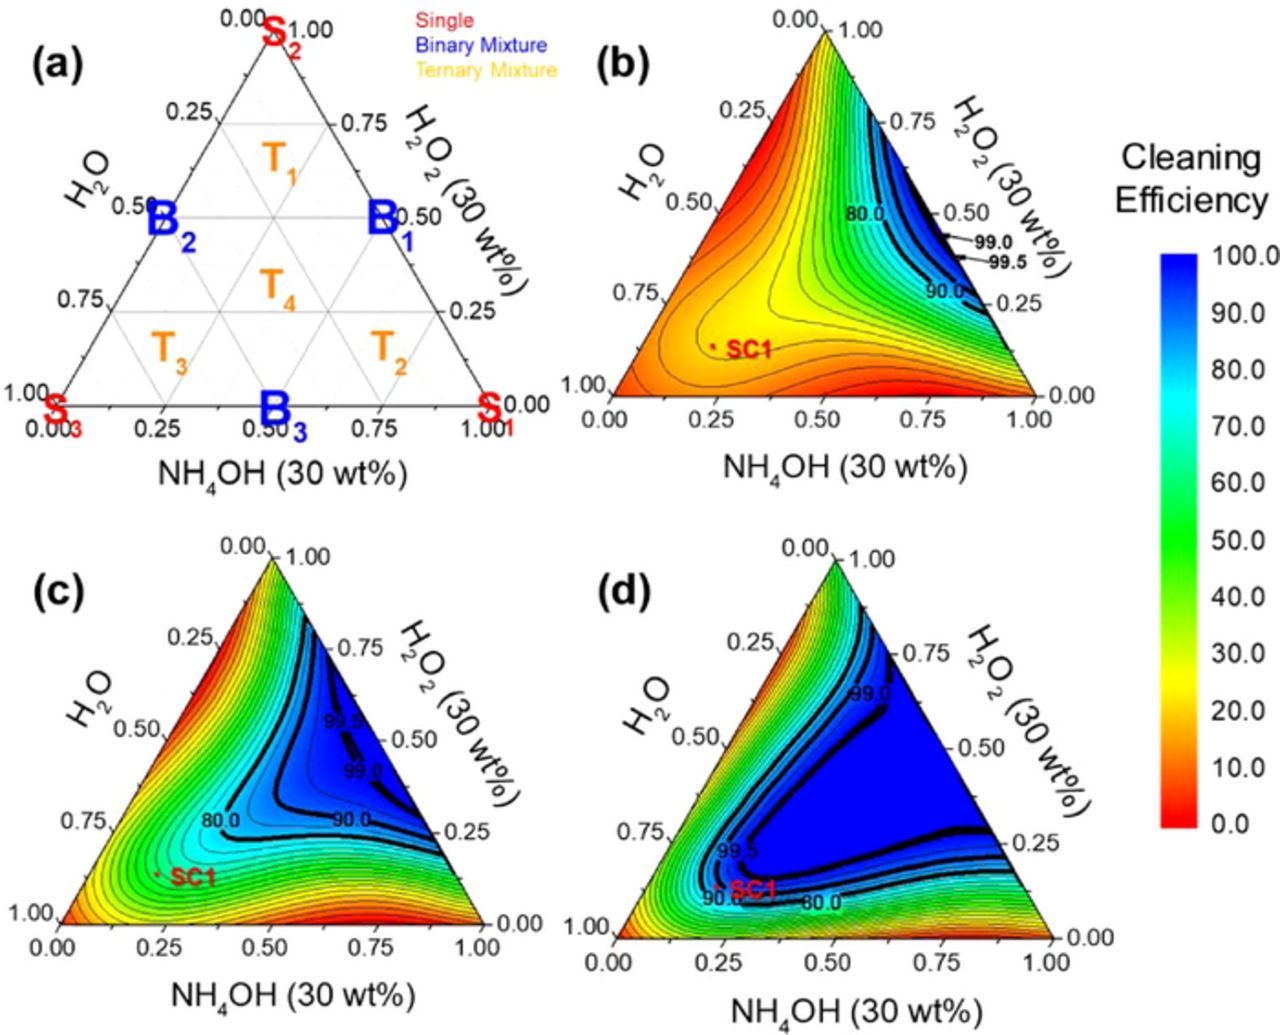
Figure 4. (a) Augmented simplex-centroid design used to optimize the composition of H2O2- NH4OH solutions. (b), (c) and (d) show contour plots of cleaning efficiencies for 10 nm, 30 nm-, and 90 nm ceria particles, respectively. The color bar on the right indicates the cleaning efficiencies. Cleaning efficiencies of 80, 90, 99, and 99.5% are labelled using bold solid lines. B1, B2 and B3 represent solutions 4, 5, and 6 in Table IV, respectively.
Table IV shows the cleaning efficiencies determined from AFM images for the three-different sized ceria particles obtained using these ten different mixtures. Among the three single component solutions, only NH4OH (30 wt%) resulted in some cleaning, likely due to the under-cut action of OH− ions and subsequent particle lift-off from SiO2 surfaces, but with very low cleaning efficiencies of about 20% for 10 nm and 30 nm-ceria particles, and about 60% for 90 nm-ceria particles.
Table IV. Surface roughness (Rq) of the cleaned coupons and cleaning efficiencies of the ten compositions tested, SC1 solution, and aone equimolar mixture of NH4OH and H2O2 (43%/57% volumetric mixture) labeled NH4OH-1, with molar concentrations of 4.13 and 4.20 mol/L. bDissolved oxygen content (DOC) of some of the aqueous mixtures of H2O2 and NH4OH was beyond the measurable limit (>22 ppm) of our instrument. Rq of bare coupons was 0.6 nm.
| Cleaning Efficiency | |||||||||
|---|---|---|---|---|---|---|---|---|---|
| Solution Number | H2O2 (30 wt%) | NH4OH (30 wt%) | DIW | pH | DOCb (ppm) | Rq (nm) | 10 nm | 30 nm | 90 nm |
| 1 | 100 | 0 | 0 | 4.5 | 15 | 0.6 | <5% | <5% | <5% |
| 2 | 0 | 100 | 0 | 13.7 | 12 | 0.9 | 19% | 23% | 60% |
| 3 | 0 | 0 | 100 | 6.0 | 7 | 0.6 | <5.0% | <5.0% | <5% |
| 4 | 50 | 50 | 0 | 13.2 | >22 | 0.8 | 98% | 99% | 99% |
| 5 | 50 | 0 | 50 | 4.7 | 11 | 0.6 | <5% | <5% | <5% |
| 6 | 0 | 50 | 50 | 13.5 | 11 | 0.8 | <5% | <5% | <5% |
| 7 | 66.6 | 16.7 | 16.7 | 12.5 | >22 | 0.7 | 28% | 56% | 89% |
| 8 | 16.7 | 66.6 | 16.7 | 13.4 | >22 | 0.7 | 27% | 62% | 89% |
| 9 | 16.7 | 16.7 | 66.6 | 12.8 | >22 | 0.7 | 31% | 68% | 90% |
| 10 | 33.3 | 33.3 | 33.3 | 12.9 | >22 | 0.8 | 43% | 89% | 99% |
| SC1 | 14.3 | 14.3 | 71.4 | 12.0 | >22 | 0.7 | 19% | 58% | 94% |
| NH4OH-1a | 43 | 57 | 0 | 13.3 | >22 | 0.9 | 99% | 99% | 99% |
The cleaning efficiencies for both H2O2 (30 wt%) and just H2O were very low at less than 5% for all the particles, consistent with their inability either to under-cut or break the strong Ce-O-Si bonds between ceria particles and the SiO2 film. Quite remarkably, when equal volumes of H2O2 (30 wt%) and NH4OH (30 wt%) solutions (no extra water added) were mixed (solution number 4 in Table IV), ∼ 99% cleaning efficiency was obtained for all the three-different sized ceria particles. In contrast, samples 7–10 with varying amounts of H2O2 (30 wt%) and NH4OH (30 wt%) solutions and water resulted in much lower efficiencies for the smaller particles and slightly less than 90% cleaning efficiency for the 90 nm particles. Among these four solutions, lower but still equal volume mixtures of H2O2 and NH4OH (samples 9 and 10) are relatively better than solutions 7 and 8 in cleaning all the particles, but still relatively low for 10 and 30 nm-ceria particles. The cleaning efficiencies for 30 and 10 nm-ceria particles gradually increase from solution 9 to 10 to 4 (all equal volumetric mixing ratios of H2O2 and NH4OH, but varying from 16.7% to 33.3% to 50%). Interestingly, while cleaning in a highly alkaline medium can generally lead to poor surface roughness caused by etching of the SiO2 surface, there was no significant difference in the surface roughness values obtained for all the samples here. All were less than 1 nm (Table IV) and close to those of bare coupons (Rq = 0.6 nm). Unlike the SC-1 clean that is usually carried out at 70–80°C, all our cleaning experiments were performed at room temperature which minimizes the final surface roughness.
The experimental results shown in Table IV were fitted with a full cubic model using the logit transformation Y = ln (y/(1 − y)) where y is the cleaning efficiency expressed in the range of 0 to 1.
Here x1, x2 and x3 represent the volume fractions of H2O2 (30 wt%), NH4OH (30 wt%) and H2O, respectively. The values of the correlation coefficient R2 of the fitted cubic models are 0.87 for 10 nm-ceria, 0.99 for 30 nm-ceria, and 0.91 for 90 nm-ceria, suggesting that they are statistically reliable.
Figures 4b–4d show the contour plots of the cleaning efficiencies obtained using the fitted models and the inverse logit transformation, y = eY/(1 + eY). Areas in which the cleaning efficiencies are above 90% (colored blue) decreased with decreasing particle size. 10 nm-ceria particles show a very small blue area near B1 (solution 4) whereas 30 nm and 90 nm-ceria show larger blue areas. Predicted (since they were not used in the fitting) cleaning efficiencies of SC1 solution using the volumetric ratio of 1:1:5 are ∼23% for 10 nm-ceria, ∼61% for 30 nm-ceria, and ∼90% for 90 nm-ceria, very well matched with our experimental results (Table III).
Effect of H2O2 on the interaction properties of ceria particles with SiO2 film
First, we will consider the role of H2O2 on cleaning by investigating the extent of adsorption of ceria particles on an oxide surface as a function of H2O2 concentration at pH 4.5 (natural pH) using the AFM method.
Figure 5 shows the number of adsorbed ceria particles on a SiO2 surface as a function of H2O2 concentration in the specified AFM scan area. As the H2O2 concentration increased, the number of ceria particles decreased, presumably due to the conversion of Ce3+ species on the particle surface to either Ce3+ peroxo or Ce4+ species or both.36–38 In the presence of 1 wt% H2O2, the number of 10 nm ceria particles on the surface is relatively high and similar to that in the absence of H2O2. This number drops to about a third at 3 wt% H2O2 and is close to zero at 5 wt% H2O2 as shown in Figure 6. In contrast, for 30 nm and 90 nm-ceria particles, very little adsorption was observed even at 1 wt% H2O2. This suggests that the relatively small difference in Ce3+ concentration between these particles is playing an important role. It appears that since 10 nm-ceria particles have a somewhat higher concentration of Ce3+ compared to 30 nm and 90 nm-ceria particles (Table II), higher concentrations of H2O2 are needed to convert the Ce3+ species to Ce3+ peroxo or Ce4+ species which do not bind as well to the SiO2 surface. Thus, as we will discuss later, one of the useful roles played by the peroxide in the cleaning solutions is the prevention of the redeposition of the ceria particles removed from the substrate by forming peroxo species on their surface.
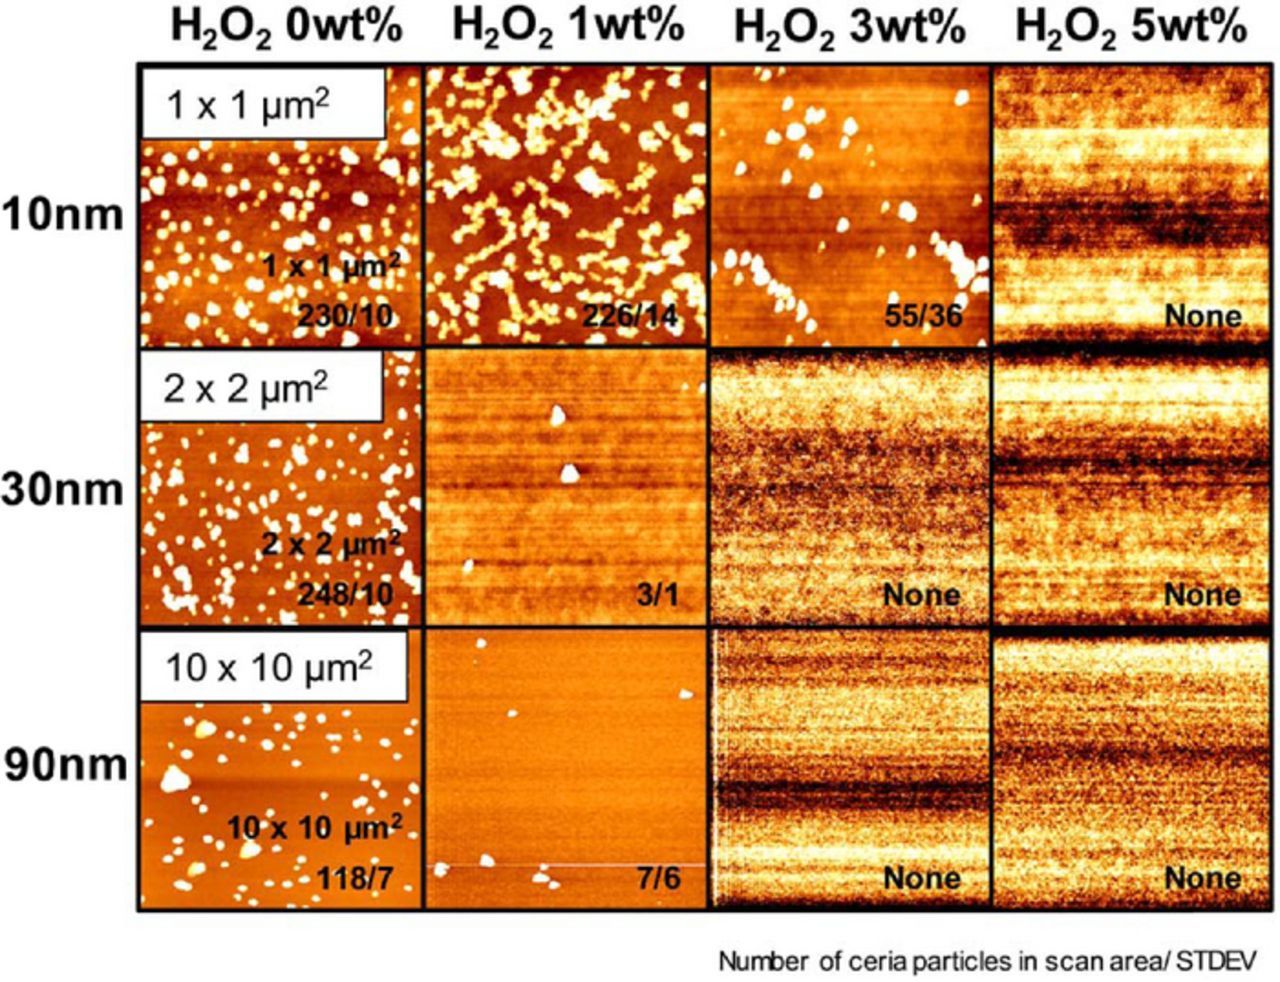
Figure 5. Topographic AFM images of adsorbed ceria particles on SiO2 surfaces at pH 4.5 (natural pH) and corresponding number of particles with increasing H2O2 concentration in scan area; 1 × 1 μm2 (10 nm-ceria), 2 × 2 μm2 (30 nm-ceria), and 10 × 10 μm2 (90 nm-ceria).
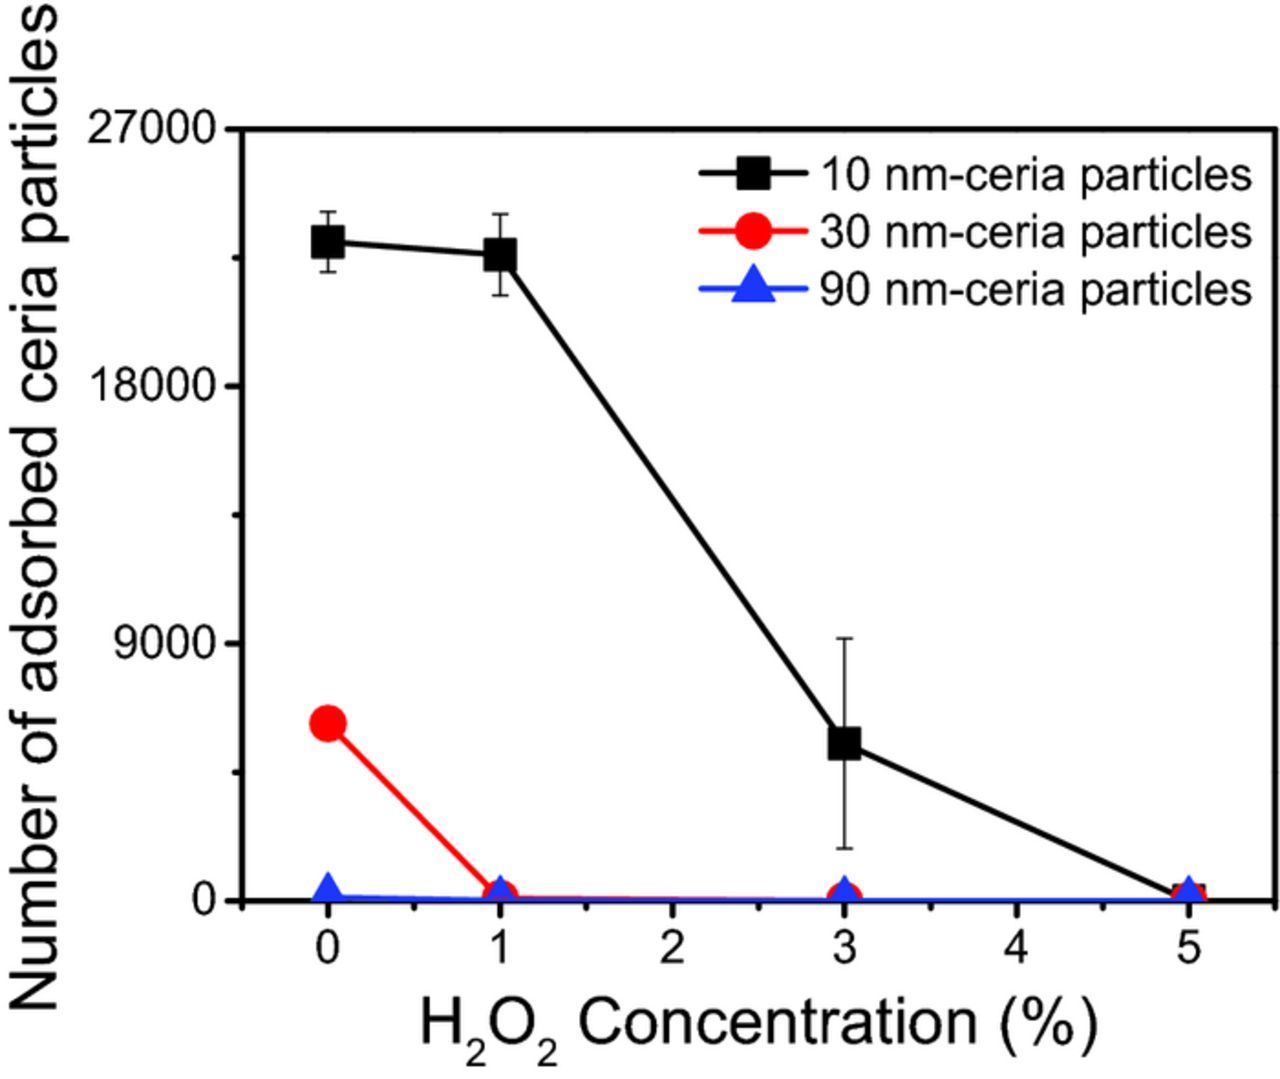
Figure 6. Number of adsorbed ceria particles on SiO2 surface as a function of H2O2 concentration at pH 4.5 (natural pH) in the same count area (all scaled to 10 × 10 μm2).
Of course, adding NH4OH to the ceria dispersions increases pH where both ceria and silica are negatively charged and repel each other.39 Indeed, when the pH was increased to 12.0, 12.5, and 13.0 using 1, 3, and 5 wt% of NH4OH (30 wt%), respectively, the number of ceria particles adsorbed on SiO2 films was found to be less than 4 for all the three different sized particles (scan images not shown), consistent with the previous literature reports.39,40 Thus, while even 1wt% NH4OH solution when added to ceria slurries can effectively prevent the particles from binding with the SiO2 film due to electrostatic repulsion, the cleaning efficiencies obtained using the even more concentrated solutions are not significant (Table IV). These results imply that neither the 5 wt% H2O2 solution (pH = 4.5) nor the more the alkaline solutions (pH >12) can rupture the strong Ce-O-Si bonds formed during polishing between ceria particles and SiO2 film even though they can prevent binding between them afterwards. Hence, any removal of the adsorbed ceria particles observed with these solutions is likely due to under-cutting action. As seen from Table IV, equal volume mixtures of these two are more effective than the other ones.
Is NH4+ necessary for cleaning or can it be replaced?
While H2O2 itself is not effective at cleaning, it is more effective when mixed with NH4OH. So is it the NH4+ or the OH− ion that is required or are both of them needed? To answer this question, we replaced NH4+ ions with K+ ions. Several aqueous mixtures of KOH (30 wt%) and H2O2 (30 wt%) were prepared and tested for their cleaning efficiencies and the results are shown in Table V. These H2O2-KOH solutions (Solutions KOH-1, 2, and 3 in Table V) showed rather lower cleaning efficiencies compared to those obtained using NH4OH (Solutions 4, 10, and SC1 solution in Table IV). Indeed, solution KOH-1, which had the same equal volumetric composition as the solution 4, had a lower cleaning efficiency, especially for 10 nm particles.
Table V. Surface roughness (Rq) of the cleaned coupons and cleaning efficiencies of four KOH- based cleaning solutions. aThis sample was prepared using 33 wt% KOH solution such that the molar concentrations of H2O2 and OH− are almost the same as that in solution NH4OH-1 in Table IV, which are 4.13 and 4.20 mol/L for H2O2 and OH−, respectively. bDissolved oxygen content (DOC) of all the aqueous mixtures of H2O2 and KOH was again beyond the measurable limit (>22 ppm) of our instrument.
| Cleaning Efficiency | |||||||||
|---|---|---|---|---|---|---|---|---|---|
| Solution Number | H2O2 (30 wt%) | KOH (30 wt%) | DIW | pH | DOCb (ppm) | Rq (nm) | 10 nm | 30 nm | 90 nm |
| KOH-1 | 50 | 50 | 0 | 12.6 | >22 | 0.7 | 67% | 95% | 97% |
| KOH-2 | 33.3 | 33.3 | 33.3 | 12.3 | >22 | 0.7 | 41% | 82% | 96% |
| KOH-3 | 14.3 | 14.3 | 71.4 | 11.6 | >22 | 0.7 | 14% | 41% | 89% |
| KOH-4a | 43 | 57 | 0 | 13.1 | >22 | 0.8 | 98% | 99% | 98% |
To understand this better, the volumetric ratios were converted to molar ratios. The molecular weights of H2O2 and NH4OH are almost the same (34 and 35 g/mol) but the measured solution densities for H2O2 (30 wt%) and NH4OH (30 wt%) are quite different at 1.09 and 0.86 g/cm3, respectively. Then the 50%/50% volumetric mixture of H2O2 and NH4OH (solution 4 in Table IV) has molar concentrations of 4.8 and 3.7 mol/l, while a 43%/57% volumetric mixture (solution NH4OH-1 in Table IV) has almost equal molar concentrations of 4.13 and 4.20 mol/L. Interestingly, cleaning efficiencies of these two mixtures differed only by ∼ 1% for 10 nm ceria particles and even less for 30 nm and 90 nm particles, all likely within experimental error. So, when a H2O2-KOH solution (KOH-4 in Table V) with equal molar concentrations (4.13 and 4.20 mol/L, respectively) was prepared using the measured density of 1.26 g/cm3 for 33 wt% KOH solution and tested, the cleaning efficiencies were almost the same as those of solution 4 and NH4OH-1 (Table IV).
This result suggests that it is not the NH4+ but the OH− ion and the associated high pH that play the critical role in cleaning and that the best cleaning efficiencies result when the molar concentrations of H2O2 and OH− ion are not only almost equal but also the highest possible in the cleaning solution. In the next section, we discuss the specific roles of the peroxide and OH− species on cleaning and why the best results are obtained when their molar concentrations are almost equal.
This is very useful result since KOH is environmentally friendlier and has lower toxicity than NH4OH. However, some organic complexing agents may be necessary to control the faster decomposition of H2O2 in the KOH solution than in the NH4OH solution that is catalyzed by the reaction by trace metal impurities41–43 present even in our nominally 99.98% pure KOH. In our case, the relevant cleaning solutions were prepared by mixing the KOH solution dropwise into the H2O2 solutions and using the mixture after stabilization, typically after an hour or so. Also, the etch rate of an oxide surface in KOH-4 is ∼1.9 nm/min and is much higher than that in NH4OH-1 (0.4 nm/min). Ideally, this dissolution rate should be as close to zero as possible.
Cleaning mechanism in H2O2-based alkaline solutions and breakage of Ce-O-Si bonds
It is well known that H2O2 dissociates in an alkaline environment to form perhydroxyl anions (HO2−, pKa = 11.6), according to the reaction:42,44,45
![Equation ([1])](https://content.cld.iop.org/journals/2162-8777/7/5/P243/revision1/d0005.gif)
The perhydroxyl ions are powerful nucleophiles with a nucleophilicity that is about 100 times larger than that of hydroxyl ions43,58–60 and, hence, have been widely used as a bleaching agent to degrade organic products.44,46 More relevant to us here, it has also been shown that the siloxane bond in amorphous silica can be broken by nucleophiles in highly alkaline media.47,48 Thus it is likley that, in our case, the perhydroxyl ion can rupture the Si-O bond in the Ce-O-Si structures via a nucleophilic attack and help remove the ceria particles form the oxide surface.
To validate this assumption, we prepared two types of silicate-covered ceria particles (10 nm) by mixing 10 nm-ceria dispersions for 60 min with 0.01 wt% or 0.1 wt% sodium silicate solutions (Na2O(SiO2)x, SiO2 ∼ 26.5%), adjusted to pH 5.0. The resulting suspensions were centrifuged for 30 min at 6000 rpm, the solids collected were dried in a convection oven at 120°C for 12 hrs and then analyzed by FTIR spectroscopy. The two types of particles are labeled A and B. Since B were prepared using richer silicate solution, it was anticipated that the surface of these ceria particles will be covered with more silicate ions than the surface of A.
Figures 7 and 8 show FT-IR spectra of the as-received and silicate-covered ceria particles A that were reacted with four different solutions (H2O, H2O2 (30 wt%), NH4OH (30 wt%), and solution 4). The strong peaks observed in the range of 600–700, 1380, and 1640 cm−1 (Figure 7) are associated with Ce-O bonding,49 -NO3 species50 (origin), and the H2O bending mode,51 respectively. Both ceria particles treated with H2O2 and solution 4 show a new absorption peak at 852 cm−1 related to the peroxo species which can be attributed to the reaction between Ce3+ sites and perhydroxyl anions generated by the decomposition of H2O2.52 Notable differences in the absorption between the as-received and silicate covered ceria particles appear in the range of 900–1300 cm−1 (Figure 8), corresponding to the presence of silicate ions on the ceria particle surface.53,54 There are two longitudinal (LO) and two transverse optical (TO) modes of Si-O-Si stretching, which were identified as LO3 (1250 cm−1), LO4 (1170 cm−1), TO3 (1070 cm−1) and TO4 (1200 cm−1) modes.55 Shoulder peaks at 980 cm−1 correspond to Ce-O-Si bonding,56,57 but these overlap with those arising from the silicate ions. Figure 8 shows that the surface functional groups of silicate covered ceria particles are changed in the presence of cleaning solutions. However, these peaks were still present after the treatment of silicate covered ceria particles with the other three solutions (H2O NOT SHOWN, H2O2 (30 wt%), and NH4OH (30 wt%)). Interestingly, the peak related to LO3 mode (1250 cm−1) of Si-O-Si stretching of silicate- covered ceria particles disappears when reacted with NH4OH alone presumably due to the decrease in density of adsorbed silicate layers caused by a condensation reaction between the adsorbed silicate ions in the highly alkaline medium.55 Also, the peaks related to LO4 (1170 cm−1)–TO4 (1200 cm−1) disorder-induced modes decreased significantly in intensity.
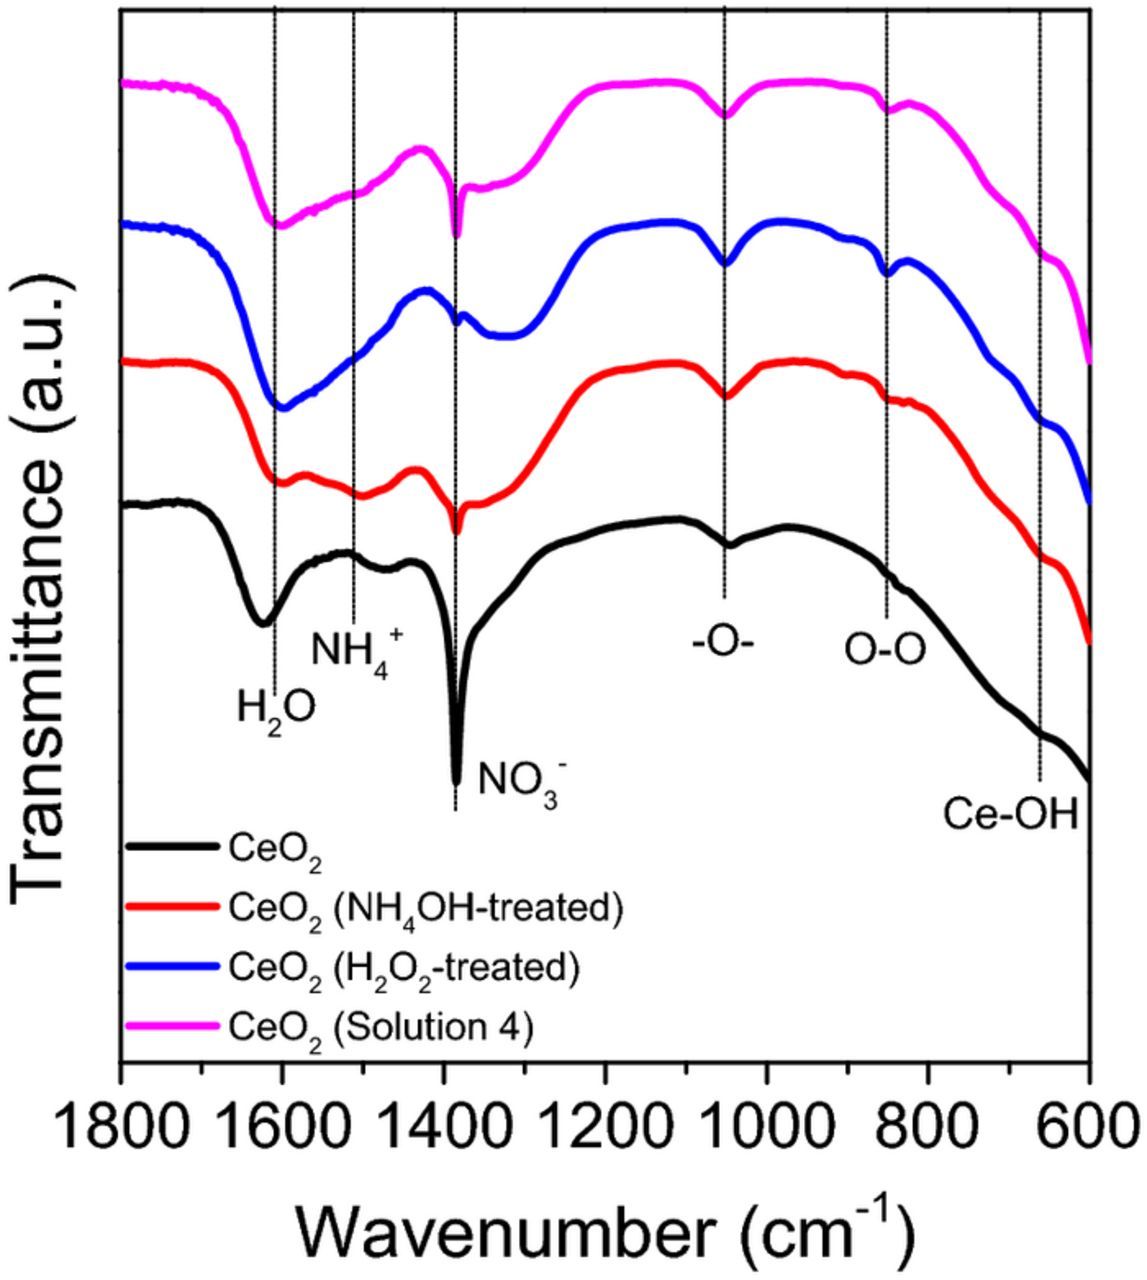
Figure 7. FT-IR spectra of as-received ceria particles that were reacted with four different solutions (H2O, H2O2 (30 wt%), NH4OH (30 wt%), and solution 4) in the region of 1800–600 cm−1.
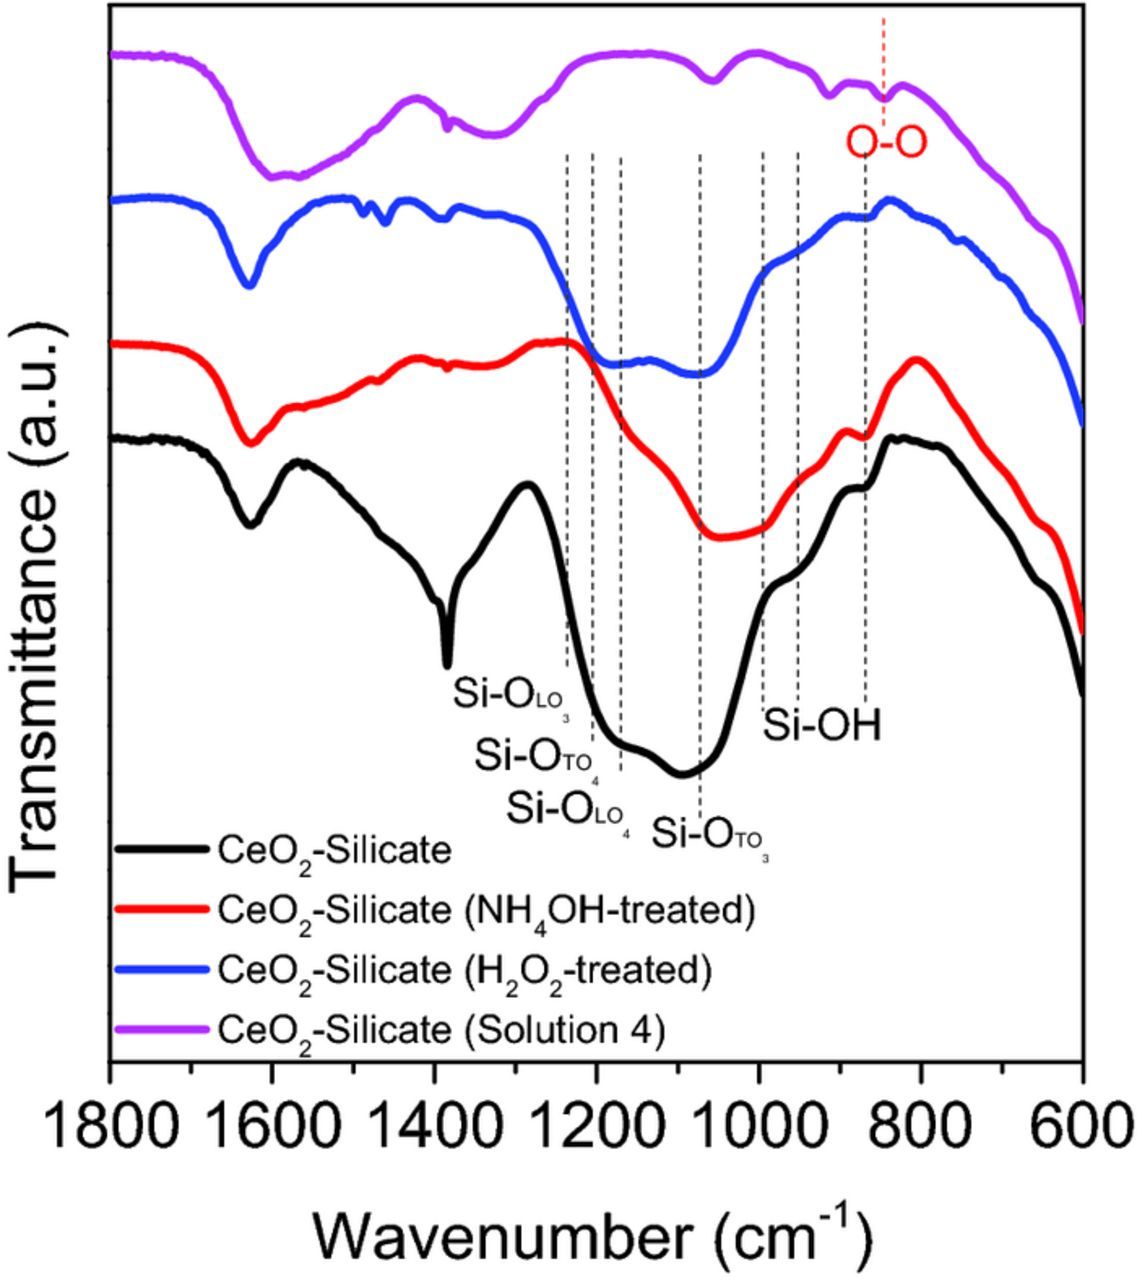
Figure 8. FT-IR spectra of silicate (0.01 wt%) covered ceria particles A that were reacted with four different solutions (H2O, H2O2 (30 wt%), NH4OH (30 wt%), and solution 4) in the region of 1800–600 cm−1.
More importantly, the peaks related to Ce-O-Si bonding and silicate ions disappeared after exposure to solution 4 and a new absorption peak at 852 cm−1 related to peroxo species (Ce3+-O22−) was observed. This demonstrates that the Si-O bond in the Ce-O-Si structures is broken leaving the peroxo species behind after exposure to solution 4 but not to H2O2 (30 wt%) or NH4OH (30 wt%) solutions alone, consistent with the data of Table IV. These peroxo species prevent the ceria particles from binding with SiO2 surface.
However, exposure to solution 4 was unable to remove silicate ions from particles B (Figure 9) that were prepared by exposure to the more concentrated (0.1 wt% vs 0.01 wt%) silicate solution. Absorption peaks associated with silicate ions in the range of 900–1300 cm−1 are still present in these particles. This implies that, due to exposure to the more concentrated silicate solution, a larger number of silicate ions are present on the ceria particles and some of them survive the nucleophilic attack on the Si-O bonds in the Ce-O-Si bond structures by the perhydroxyl ions. Perhaps, more perhydroxyl ions are needed for complete elimination of the silicate absorption peak.
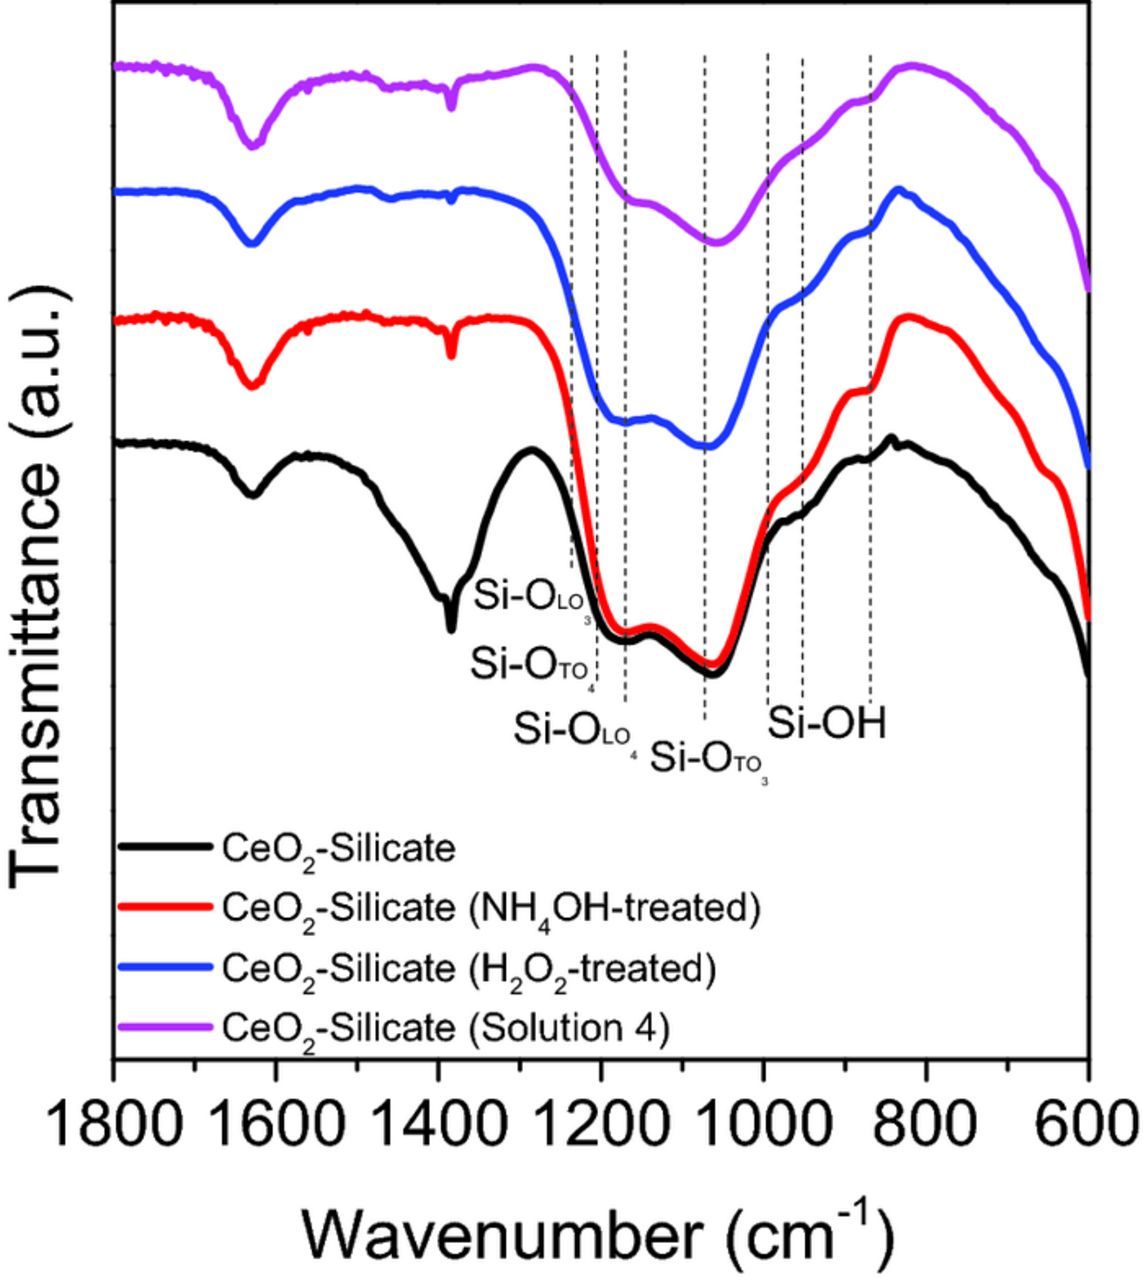
Figure 9. FT-IR spectra of silicate (0.1 wt%) covered ceria particles B that were reacted with four different solutions (H2O, H2O2 (30 wt%), NH4OH (30 wt%), and solution 4) in the region of 1800–600 cm−1.
Hence, based on the strong nucleophilicity of the perhydroxyl ions and the FTIR data, the cleaning mechanism can be described in terms of these sequential steps: (1) The perhydroxyl anions formed by the decomposition of H2O2 in a high pH solution break the O-Si bonds in the Ce-O-Si structures through nucleophilic substitution reaction. Since the binding energy of Ce-O (∼ 790 kJ/mol) is much higher than that of Si-O (∼452 kJ/mol), it is easier to break the Si-O bond than the Ce-O bond. (2) At the same time, the O-O bond in the perhydroxyl anion can also be ruptured due to its much weaker binding energy of ∼210 kJ/mol compared to the ∼336 kJ/mol of the hydroxyl (O-H) in the perhydroxyl anion. (3) Some of the oxygen formed adsorbs on the ceria particle surface, creating the peroxo species on its surface which prevents readsorption and redeposition (Figure 8). Indeed, ceria particles treated with only H2O2 show the peroxo related peak at 852 cm−1 (Figure 7), which can be connected to the role of peroxide in preventing redeposition of the cleaned particles and ensuring high cleaning efficiencies. For ease of reference, the energies of different bonds involved are summarized in Table VI.
Table VI. Known binding energy data.
| Bond type | Bond dissociation energy (kJ/mol) | Ref | |
|---|---|---|---|
| Perhydroxyl anion (OOH) | O-O | 210 | 58,59 |
| O-H | 336 | 60 | |
| Hydroxyl ion | O-H | 487 | 60 |
| Ce-O-Si | Ce-O | 790 | 61 |
| Si-O | 452 | 62,63 | |
Under this scenario, the higher the concentration of perhydroxyl anions, the higher the efficiency with which the Si-O bond breakage and, hence, particle removal occurs. We show in the following that the HO2− concentration reaches a maximum in these solutions when the peroxide and OH− concentrations are equal and have the highest posible values. This cleaning mechanism is schematically illustrated in Figure 10.
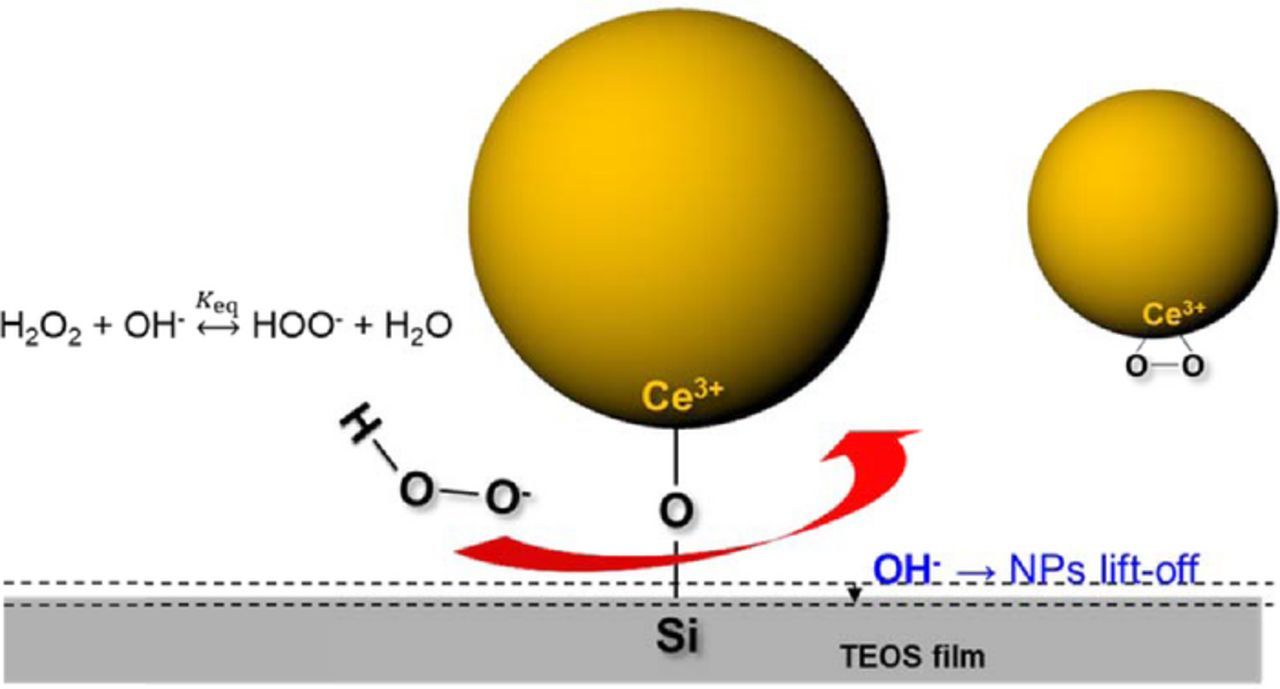
Figure 10. Schematic illustration of the removal of ceria particles by H2O2-based alkaline cleaning solution involving Si-O bond rupture and formation of peroxo species in the particle surface that prevents redeposition.
Perhydroxyl ion concentration and oxygen evolution
The equillibrium constant Keq for Reaction 1 above is given by
![Equation ([2])](https://content.cld.iop.org/journals/2162-8777/7/5/P243/revision1/d0006.gif)
where the ionization rate constant Kion  for H2O2 was calculated be 2.24 × 10⁻¹² mol/L by Evans and Uri.64 while the ionization constant KW = [H3O+][OH−] for water is 1.0 × 10⁻¹⁴ mol2/L2, both at 25°C. The molar concentration Z of perhydroxyl anions at equilibrium can be calculated from the starting molar concentrations X of NH4OH, Y of H2O2 and Keq.
![Equation ([3])](https://content.cld.iop.org/journals/2162-8777/7/5/P243/revision1/d0007.gif)
which leads to
![Equation ([4])](https://content.cld.iop.org/journals/2162-8777/7/5/P243/revision1/d0008.gif)
where R = X+ Y+1/Keq
Since Keq is 224 L/mol at 25°C. 1/Keq is relatively small compared to X and Y and can be ignored in the above. Then it is easy to show that Z has a maximum when R2 = 4 XY or when X = Y since R ∼ X+Y. Under these conditions, the maximum value of Z = X = Y, which was found to be 4.17 mol/L in the 43.4%/ 56.6% volumetric mixture of H2O2 (30wt%) and NH4OH (30wt%) and 4.18 mol/L in the 43.5%/ 56.5% volumetric mixture of H2O2 (30 wt%) and KOH (33 wt%) mixture.
Some of the perhydroxyl anions can be consumed by reacting with undecomposed H2O2 to form molecular oxygen.42,44,45
![Equation ([5])](https://content.cld.iop.org/journals/2162-8777/7/5/P243/revision1/d0009.gif)
The concentration of dissolved molecular oxygen generated in our experiments by the decomposition of H2O2 in the presence of NH4OH or KOH was beyond the measurable limit of 22 mg/L or ∼0. 69 mM (Tables IV and V). Of course, some of the O2 escapes and is not dissolved. If, all the O2 was some how contained and it reaches, say,10 mM effective concentration, it will be still very small compared to the calculated concentrations of HO2− as shown below. So, the concentration of HO2− ions remains essentially unaffected by this reaction.
Perhydroxyl ion concentration and cleaning efficiency
Table VII shows the molar concentrations [HO2−] of perhydroxyl anions in mixtures of H2O2 and NH4OH or KOH at equilibrium, calculated using Eqs. 2–4. The calculated [HO2−] in mixtures that do not contain both H2O2 and OH− are negligible (solutions 1–3, 5 and 6). The equilibrium [HO2−] in solution 8 is somewhat higher than that in solutions 7 and 9 because its composition is somewhat closer to being equal molar. However, the cleaning efficiencies of these three mixtures are not much different. More importantly, [HO2−]− gradually increases from solution 9 to 10 to 4 (all equal volumetric mixing ratios of H2O2 and NH4OH, but increasing from 16.7% to 33.3% to 50%), with a corresponding increase in cleaning efficiency. Finally, the cleaning efficiencies are highest for NH4OH-1 and KOH-4 which also have the highest molar concentrations of H2O2 and OH− which leads to the highest [HO2−] of 4.13 mol/L, a number that is slightly different from the 4.17 mol/L and 4.18 mol/L mentioned in the last section due to a small difference in the concentrations (43.4% vs 43%). These data support the hypothesis that the perhydroxyl ion is responsible for the cleaning and that higher cleaning efficiencies result when [HO2−] is higher which occurs in equimolar mixtures of H2O2 and OH−. Indeed, the cleaning efficiency correlates very well with the calculated [HO2−] within experimental error as shown in Figure 11a for the three particle sizes.
Table VII. Calculated molar concentrations of perhydroxyl anion [HO2−] of cleaning solutions used in Table IV and Table V at equilibrium and their cleaning efficiencies.
| Cleaning Efficiency | ||||
|---|---|---|---|---|
| Solution Number | Perhydroxyl Ions (mol/L) | 10 nm | 30 nm | 90 nm |
| 1 | 0.00 | <5% | <5% | <5% |
| 2 | 0.00 | 19% | 23% | 60% |
| 3 | 0.00 | <5.0% | <5.0% | <5% |
| 4 | 3.68 | 98% | 99% | 99% |
| 5 | 0.00 | <5% | <5% | <5% |
| 6 | 0.00 | <5% | <5% | <5% |
| 7 | 1.23 | 28% | 56% | 89% |
| 8 | 1.60 | 27% | 62% | 89% |
| 9 | 1.23 | 31% | 68% | 90% |
| 10 | 2.45 | 43% | 89% | 99% |
| SC1 | 1.05 | 19% | 58% | 94% |
| NH4OH-1 | 4.13 | 99% | 99% | 99% |
| KOH-1 | 3.21 | 67% | 95% | 97% |
| KOH-2 | 2.14 | 41% | 82% | 96% |
| KOH-3 | 0.93 | 14% | 41% | 89% |
| KOH-4 | 4.13 | 98% | 99% | 98% |
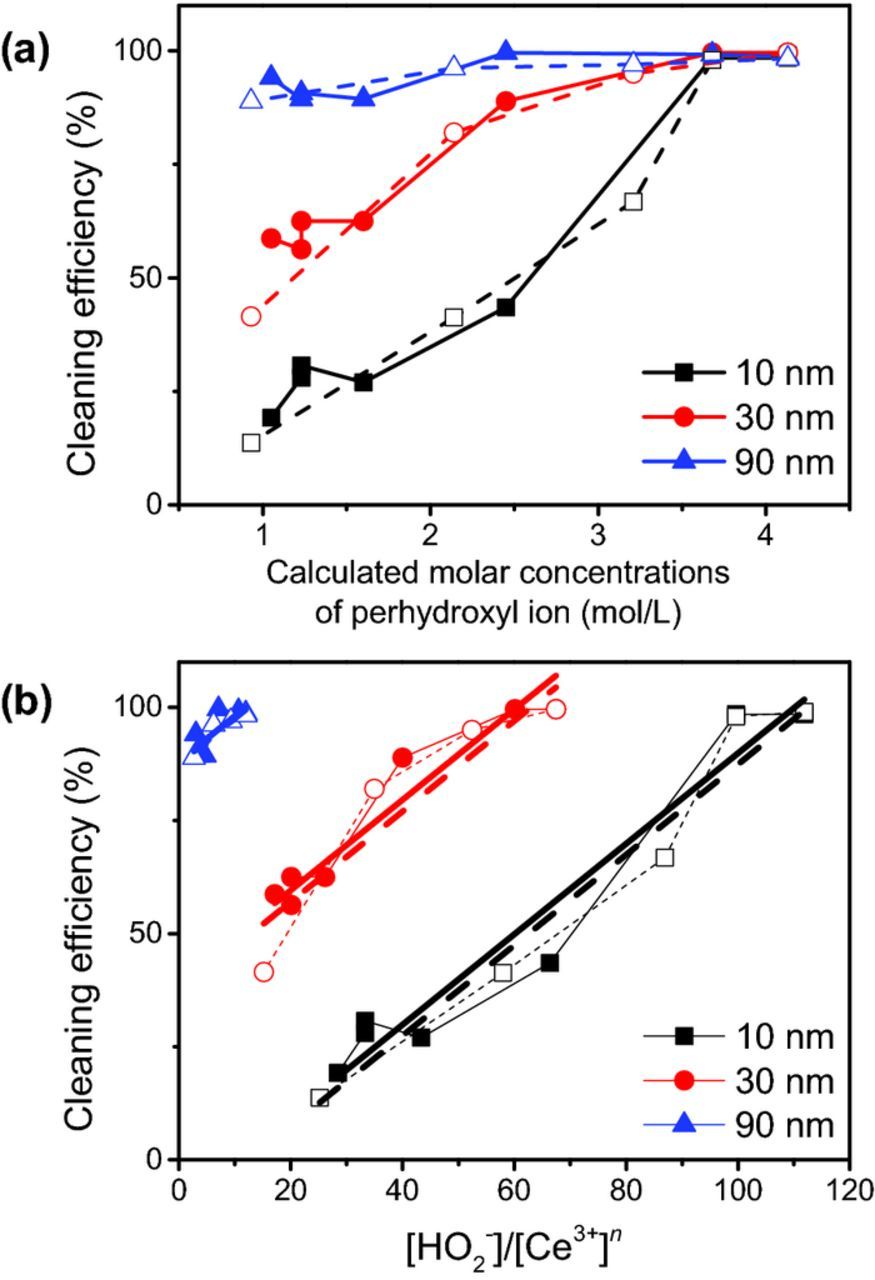
Figure 11. (a) Cleaning efficiency as a function of calculated [HO2−] and (b) [HO2−]/[Ce3+]n in mixtures of H2O2 and either NH4OH (filled symbols) or KOH (open symbols). Cleaning efficiencies at negligible molar concentrations ∼0 of perhydroxyl anion are not shown here. The empirical exponent n for 10 nm, 30 nm, and 90 nm are 2.5, 1.6, and 0.6, respectively.
Interestingly, when the data on the cleaning efficiencies were replotted as a function of [HO2−]/[Ce3+]n, a reasonably good linear relation was found when n has values of 2.5, 1.6, and 0.6 for 10 nm, 30 nm, and 90 nm particles, respectively. For now this is an empirical relation since we do not have any basis for it yet. What is known is that the lattice constant and the particle size have a power-law relationship65 and an increase in lattice constant may correspond to an increase in surface Ce3+ concentrations due to oxygen vacancies. Also, the intercept of the linear plot for the 10 nm particles is negative while that for 30 nm and 90 nm particles are positive. This implies that some (not all) removal of the two larger size particles is possible in the absence of peroxide but not for the smaller 10 nm particles.
Finally, it is important to investigate the effect of the compositions identified here in combination with megasonic and brush cleaning techniques commonly used in the semiconductor industry as well as their impact on CMP consumables including pads, conditioners, filters, brushes, etc.
Conclusions
Smaller ceria particles are more difficult to remove from oxide surfaces after CMP. Here we showed that high pH H2O2-based cleaning solutions, aided by ultrasonic energy, can almost completely remove ceria particles down to 10 nm in size as determined by AFM imaging and counting. Highest removal efficiencies were obtained when the molar concentration of the perhydroxyl ions [HO2−] is the highest possible in the cleaning solution. These ions break the weaker Si-O bond in the Ce-O-Si structures formed between the ceria particles and the SiO2 surface. The cleaning efficiencies for 10 nm, 30 nm and 90 nm particles correlate very well with calculated [HO2−].
Acknowledgment
We gratefully acknowledge EBARA Corporation for providing partial financial support, and Solvay for supplying the ceria slurries.
ORCID
Jihoon Seo 0000-0003-3946-6476
S. V. Babu 0000-0002-5171-261X