Abstract
Recently, stainless steel has been widely used as the solar cell substrate. In this paper, chemical mechanical polishing technique was employed to prepare the ultra-smooth 316L stainless steel surface for such application. The effects of solid content, pH, H2O2 and benzotriazole (BTA) on the polishing performance of 316L stainless steel were investigated. The results indicated that, at pH 4.00, with the increase in the H2O2 concentration, the MRR first dramatically increases due to the fact that, with the addition of small amount of H2O2, a porous outer layer mainly consisting of iron-enriched oxides with relatively low mechanical strength of the bilayer-structure oxide film is rapidly formed on the surface. After reaching the maximum value, the MRR gradually decreases since the outer layer gradually grows compact by the transformation of γ-FeOOH into α-FeOOH and even into α-Fe2O3. With the addition of BTA, the MRR can be suppressed, which is probably attributed to the formation of BTA passivating film on the top surface. Finally, a two-step polishing method was proposed, by which the ultra-smooth 316L stainless steel surface with the surface roughness Ra about 2.0 nm can be achieved within 30 min and it can be subsequently used for thin-film solar cells.
Export citation and abstract BibTeX RIS

This is an open access article distributed under the terms of the Creative Commons Attribution 4.0 License (CC BY, http://creativecommons.org/licenses/by/4.0/), which permits unrestricted reuse of the work in any medium, provided the original work is properly cited.
Stainless steel plays an important role in the mechanical industry due to the excellent mechanical properties, the high thermostability and the strong corrosion resistance. Recently, various types of stainless steels have been intensively used in precise devices,1–4 especially been used as the substrate for thin-film solar cells.5–10 In order to achieve satisfactory performance of solar cells, low roughness, low defects as well as excellent flatness of the stainless steel substrate are intensively demanded and even indispensable. It is reported that, by improving the surface roughness of stainless steel substrate from 38 nm to 23 nm, the conversion efficiency of hydrogenated amorphous silicon thin-film solar cells can greatly increase to 5.4%.10 As is revealed, chemical mechanical polishing (CMP) combines the synergetic effects of chemical corrosion and mechanical abrasion, and can achieve both local and global planarization of the substrate surface.11–14 Hu et al.2 used colloidal silica as the abrasive and investigated the effects of pH and oxidizer on the polishing performance of stainless steel, and it was reported that the combination of oxidizer and strong acidity was the prerequisite for high material removal rate (MRR). However, the microscopic defects of 1–2 μm in size cannot be effectively avoided on the polished surface. Lee et al.10 used electrochemical mechanical polishing technique, which applied an additional anodic potential on the stainless steel substrate besides CMP, to polish the stainless steel surface, and it was reported that the polished surface roughness was reduced from about 38 nm to about 23 nm. However, more detailed polishing performance and the mechanism of chemical reactions during the polishing process of stainless steel substrate have not been well investigated.
Actually, prior to the investigation of CMP of stainless steel as the solar cell substrate, we have already carried out research on CMP of other two typical steels which are widely used in other precision devices, i.e. AISI 1045 steel and AISI 52100 steel. The results presented that, for both of the above two steels, a nanoscale surface roughness Ra could be realized using CMP with the proper slurry chemistry.15,16 As an extension, the study of CMP of stainless steel as the solar cell substrate serves as a complement of the above research, and all the work together can provide the guidance for CMP of other iron-based materials. In this paper, as a piece of the systematic work, CMP of stainless steel was investigated using 316L stainless steel as the representative of stainless steels. The effects of solid content, pH, oxidizer such as H2O2 and benzotriazole (BTA) on the polishing performance of 316L stainless steel were first studied, and then the chemical reactions occurring on the stainless steel surface during the polishing process were analyzed, and the corresponding polishing mechanism was proposed. Finally, a two-step polishing method was developed to prepare the ultra-smooth 316L stainless steel surface for thin-film solar cells.
Experimental
According to the experimental requirement, polishing slurries were prepared with de-ionized (DI) water, NexSil 85K colloidal silica (purchased from Nyacol Nano Technologies, Inc., primary particle size is about 50 nm) and reagent grade chemicals such as H2O2 and BTA. pH was adjusted using diluted HNO3 and KOH. In particular, in order to ensure that the amount of the added H2O2 was accurate enough, 1.0 wt% H2O2 stock solution was first prepared and added.
Polishing experiments were carried out on a CETR CP-4 bench-top polisher using the 316L stainless steel disks (2'' diameter and 1 mm thickness) with the following polishing conditions: the down pressure 6.0 psi, the table speed/carrier speed 150 rpm/150 rpm, the offset distance between the table and the carrier 63 mm, the slurry flow rate 100 ml/min and the polishing time 1 min. An IC1010/Suba-IV composite pad with K-type groove (purchased from Dow Electronic Materials) was used as the polishing pad. Before the experiment, a pad break-in conditioning was carried out with a diamond conditioning disk for 10 min. In between each polishing, a pad ex-situ conditioning was carried out for 10 sweeps. The MRR of 316L stainless steel was determined by measuring the weight loss with a Sartorius ME36S microbalance (0.001 mg resolution). Each experiment was repeated four times. The MRR calculation formula is shown as follows:
![Equation ([1])](https://content.cld.iop.org/journals/2162-8777/4/5/P162/revision1/jss_4_5_P162eqn1.jpg)
Where MRR (unit is Å/min) is the MRR result of 316L stainless steel, Δm (unit is g) is the weight loss after being polished, t (unit is min) is the polishing time.
After polishing, the surface morphology was measured with a Veeco MicroXAM optical interferometer surface mapping microscope, and then the surface roughness was evaluated with the scanning probe image processor software. The corresponding measured surface area was 173 μm by 128 μm. In order to investigate the slurries' chemical aggressiveness, static etching tests were carried out at room temperature by immersing the 316L stainless steel disks (1'' diameter and 5 mm thickness) into the tested slurries (without silica particles). The test time was set to 3 min. Similar to the MRR calculation formula, the static etching rate (SER) was also calculated by measuring the weight loss.
Electrochemical experiments were carried out to describe the electrochemical properties of the 316L stainless steel surface in various slurries (without silica particles) by using a potentiostat/galvanostat Model 273A work station (Princeton Applied Research) with a 200 ml three-electrode cell. A platinum electrode was used as the counter electrode, an Ag/AgCl electrode with 3.5 M KCl reference solution was used as the reference electrode, and a cylindrical 316L stainless steel electrode with 5 mm diameter encased in epoxy resin was used as the working electrode. Prior to each measurement, the working electrode was first mechanically polished with an abrasive paper made of brown fused alumina (P2000), and then was carefully degreased with ethyl alcohol and cleaned with DI water in sequence. In order to prepare the fresh 316L stainless steel surface, the working electrode was held at −1.2 V (vs. EAg/AgCl) for 1 min to reduce the native oxide as the pretreatment. Then the potentiodynamic polarization measurement was carried out when the open-circuit potential reached a stable value, where the step height was set to 2 mV and the scan rate was set to 5 mV/s.
Auger electron spectroscopy (AES) was used to quantitatively analyze the chemical depth profiling of the 316L stainless steel surface after being polished with different slurries. For the sample preparation of AES measurement as well as X-ray photoelectron spectroscopy (XPS) measurement which will be mentioned later, a 7.5 mm by 7.5 mm 316L stainless steel coupon was first polished with the designated slurry, rinsed with DI water and then dried with high pressure air jet. It was inserted into the high vacuum chamber subsequently. The AES tests were performed on a PHI-700 Scanning Auger Nanoprobe (ULVAC-PHI, Japan) with a coaxial electron gun and a Cylindrical Mirror Analyze energy analyzer. The electron gun used 5 kV voltages, and the energy resolution was 1‰. The incidence angle was 30°. The vacuum of the chamber was lower than 3.9 × 10⁻⁹ Torr. A scanning Ar+ gun was used for sputter depth profiling. The chemical compositions of the 316L stainless steel surface were characterized by XPS. The XPS measurements were carried out on an ESCALAB 250 XI (Thermo Scientific Instrument, USA) which utilizes monochromatic aluminum k-alpha X-rays. All spectra were obtained at a 90° photoelectron takeoff angle from the surface. For each sample, the high-resolution spectra, corresponding to Fe, Cr, O and N respectively, were obtained by using 30.0 eV pass energy. The data analysis was performed with the CasaXPS software afterward.
Results and Discussion
Effect of solid content on the MRR of 316L stainless steel
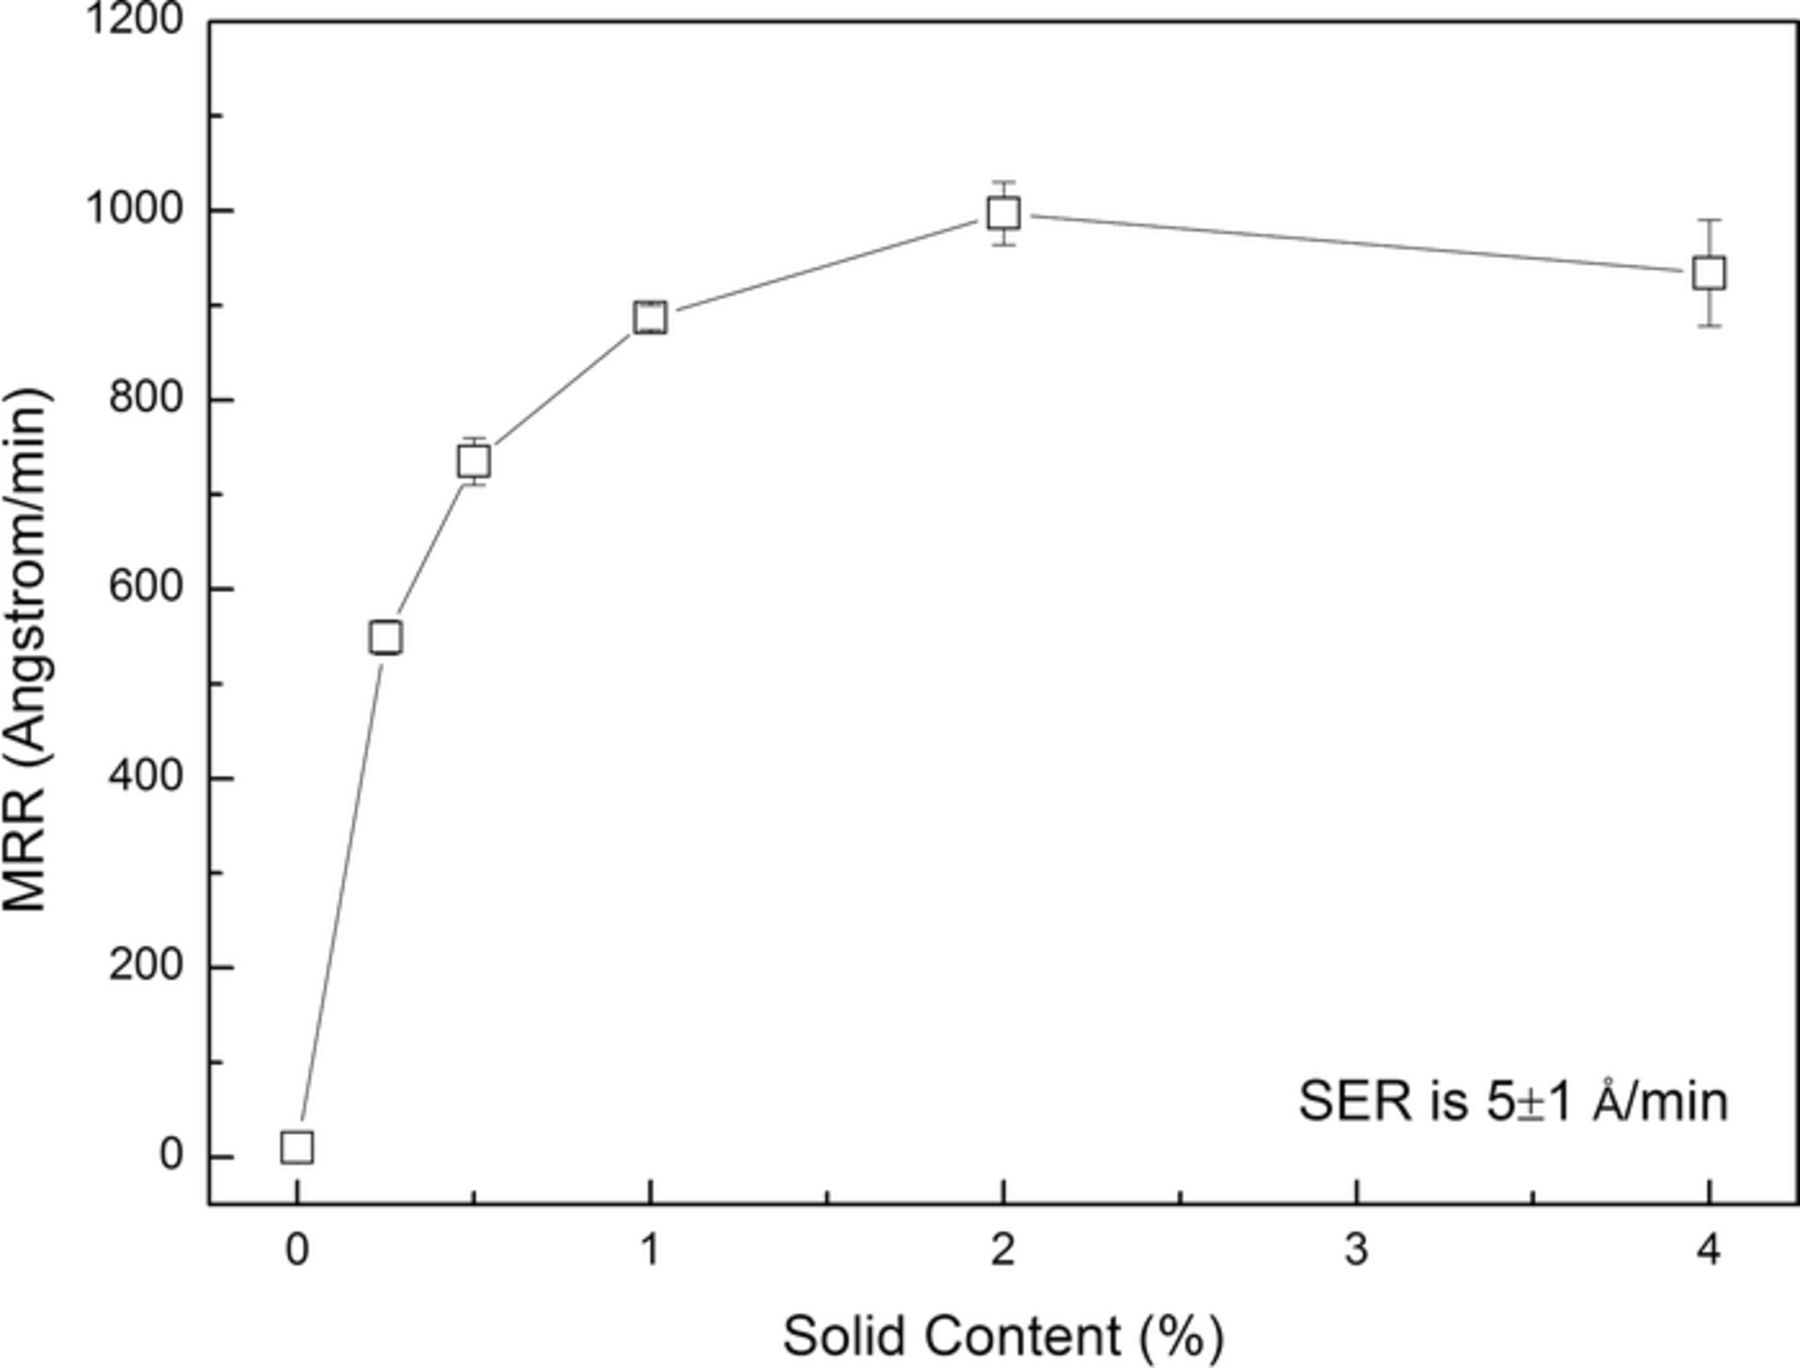
The chemical composition of 316L stainless steel is listed in Table I. It can be seen that the main chemical elements are iron, chromium and nickel. The effect of solid content on the MRR of 316L stainless steel is shown in Fig. 1. The slurries were composed of different concentrations of colloidal silica and with pH 4.00. It can be seen that, without colloidal silica, the MRR is as low as 10 Å/min due to lacking of sufficient mechanical abrasion; with the increase in the colloidal silica concentration, the MRR first gradually increases to 997 Å/min (with the addition of 2.0 wt% colloidal silica), and then becomes saturated. The SER is 5 Å/min under such chemical condition. It can be concluded that, during the polishing process of 316L stainless steel, the mechanical force of colloidal silica plays a significant role in enhancing the MRR. In order to keep sufficient mechanical force, if no specification, 4.0 wt% colloidal silica was used for the following tests.
Table I. Chemical composition of 316L stainless steel.
| Chemicals | C | Si | Mn | S | P | Cr | Ni | Mo | Fe |
|---|---|---|---|---|---|---|---|---|---|
| Concentration | ≤0.030 | ≤1.00 | ≤2.00 | ≤0.030 | ≤0.035 | 16.00–18.00 | 10.00–14.00 | 2.00–3.00 | Balance |
Figure 1. Effect of solid content on the MRR of 316L stainless steel.
Effect of pH on the polishing performance of 316L stainless steel
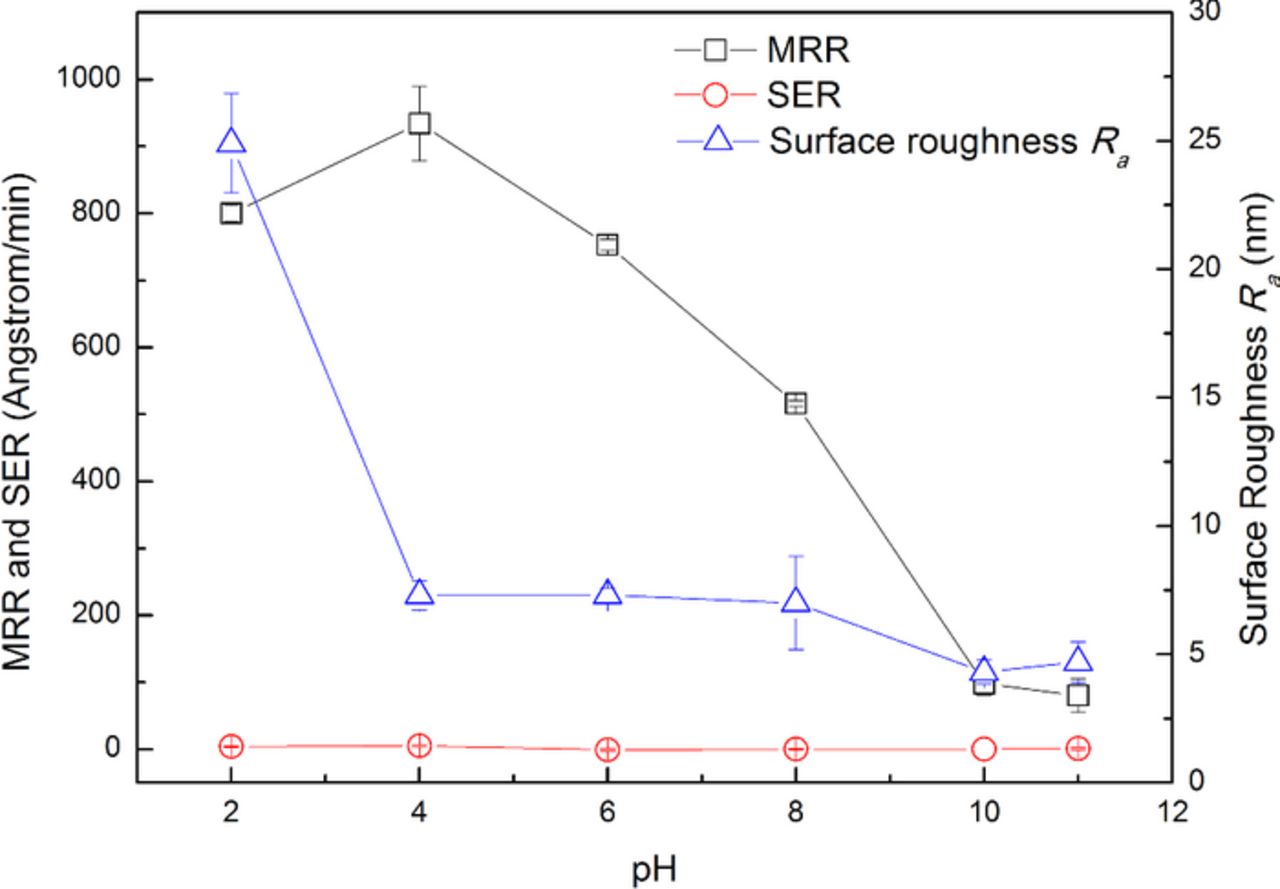
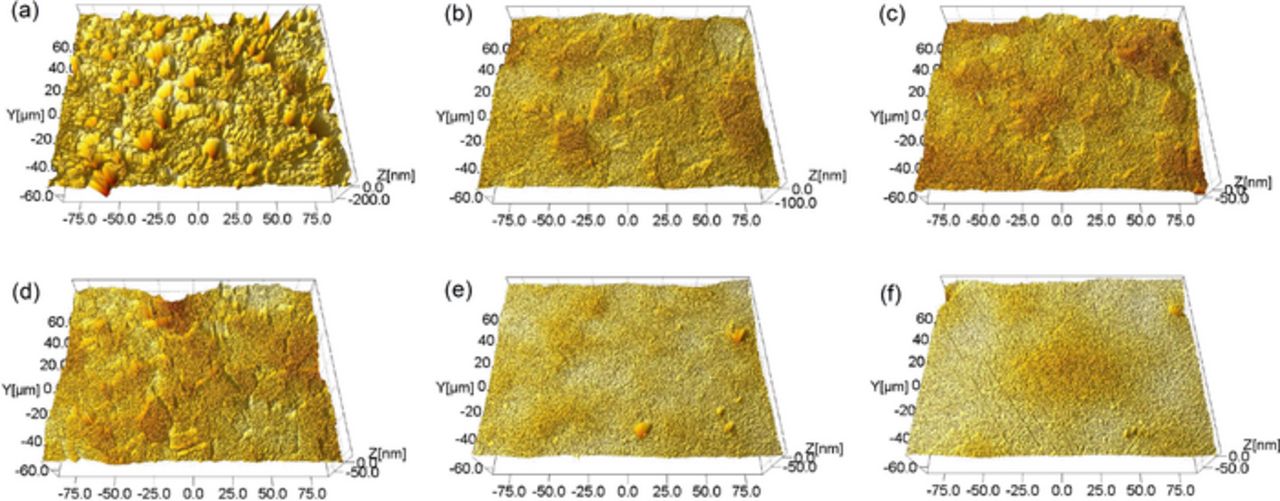
pH is critical to metal CMP by influencing the state of the metal surface, i.e. immunity, corrosion or passivation.17–19 The effect of pH on the polishing performance of 316L stainless steel is shown in Fig. 2. The slurries were composed of 4.0 wt% colloidal silica and with different pH. It can be seen that, within the test pH range from 2.00 to 11.00, the SER keeps the value at about 0 Å/min, which can be attributed to the strong corrosion resistance of 316L stainless steel. When 316L stainless steel is exposed in the slurries, under the static condition without consecutive mechanical abrasion, chromium can spontaneously form a thin passive oxide layer on the top surface by reacting with dissolved oxygen. And as a result, the diffusion of dissolved oxygen into the base material can be effectively inhibited and the further oxidation and corrosion can be prevented. With the increase in pH, the MRR gradually decreases, especially when pH increases from 4.00 to 10.00, the MRR almost linearly decreases from 934 Å/min to 98 Å/min; the surface roughness Ra first dramatically decreases from 24.9 nm to 7.3 nm when pH increases from 2.00 to 4.00, then keeps about 7.0 nm between pH 4.00 and 8.00, and decreases to 4.3 nm and 4.7 nm afterwards when pH further increases to 10.00 and 11.00, respectively. The typical surface morphologies of 316L stainless steel after being polished with the slurries at different pH are shown in Fig. 3. As shown in Fig. 3a, numerous corrosion pits can be observed on the surface after being polished with the slurry at pH 2.00; as shown in Fig. 3b–3d, the surface morphology becomes compact without obvious corrosion pits after being polished with the slurries at pH between 4.00 and 8.00; as shown in Fig. 3e–3f, the surface morphology becomes much smoother and more compact after being polished with the slurries at pH 10.00 and 11.00, respectively. According to the pH-potential diagrams for iron-water system,20 chromium-water system21 and nickel-water system at 25°C,22 in the strongly acidic slurry, such as pH 2.00, the fresh 316L stainless steel surface is likely to be attacked by hydrogen ions, and as a result, many nanoscale corrosion holes are formed as shown in Fig. 3a, by which the mechanical strength of the surface is weakened, and therefore, the MRR is relatively high; with the increase in pH, iron, chromium and nickel can gradually react with dissolved oxygen in the slurry to form the compact and passive oxides on the surface, by which the MRR is gradually suppressed and the surface quality improves.
Figure 2. Effect of pH on the polishing performance of 316L stainless steel.
Figure 3. Typical surface morphologies of 316L stainless steel after being polished with the slurries at different pH. Three parameters are used to characterize the surface quality: peak to valley (PV), root mean squared roughness (Rq) and average roughness (Ra). (a) polished using the slurry at pH 2.00. PV is 343 nm, Rq is 34.9 nm and Ra is 23.8 nm; (b) polished using the slurry at pH 4.00. PV is 148 nm, Rq is 9.00 nm and Ra is 7.12 nm; (c) polished using the slurry at pH 6.00. PV is 132 nm, Rq is 9.00 nm and Ra is 7.36 nm; (d) polished using the slurry at pH 8.00. PV is 110 nm, Rq is 9.33 nm and Ra is 7. 2 nm; (e) polished using the slurry at pH 10.00. PV is 119 nm, Rq is 5.98 nm and Ra is 4.09 nm; (f) polished using the slurry at pH 11.00. PV is 91.9 nm, Rq is 6.09 nm and Ra is 4.74 nm.
Effect of H2O2 on the polishing performance of 316L stainless steel
As a typical strong and contamination-free oxidizer, H2O2 is reported to be quite effective to increase the MRR of stainless steels.2,23 Therefore, in the following tests, H2O2 was used as the appropriate oxidizer for CMP of 316L stainless steel. However, as shown in the following reaction, toxic Cr(VI) complex can be formed when H2O2 reacts with Cr(III) ions under alkaline condition:24
![Equation ([2])](https://content.cld.iop.org/journals/2162-8777/4/5/P162/revision1/jss_4_5_P162eqn2.jpg)
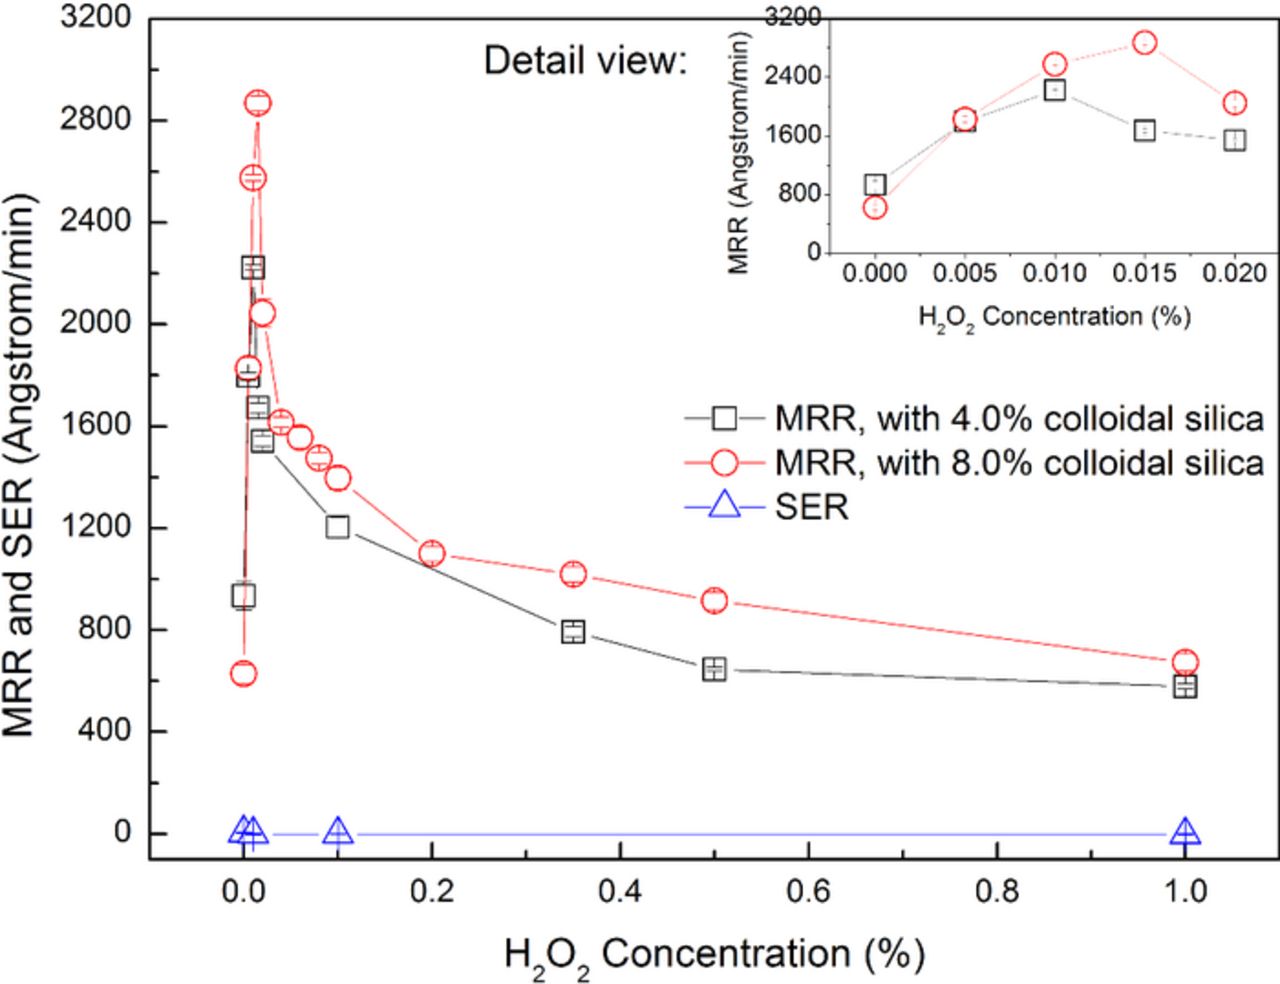
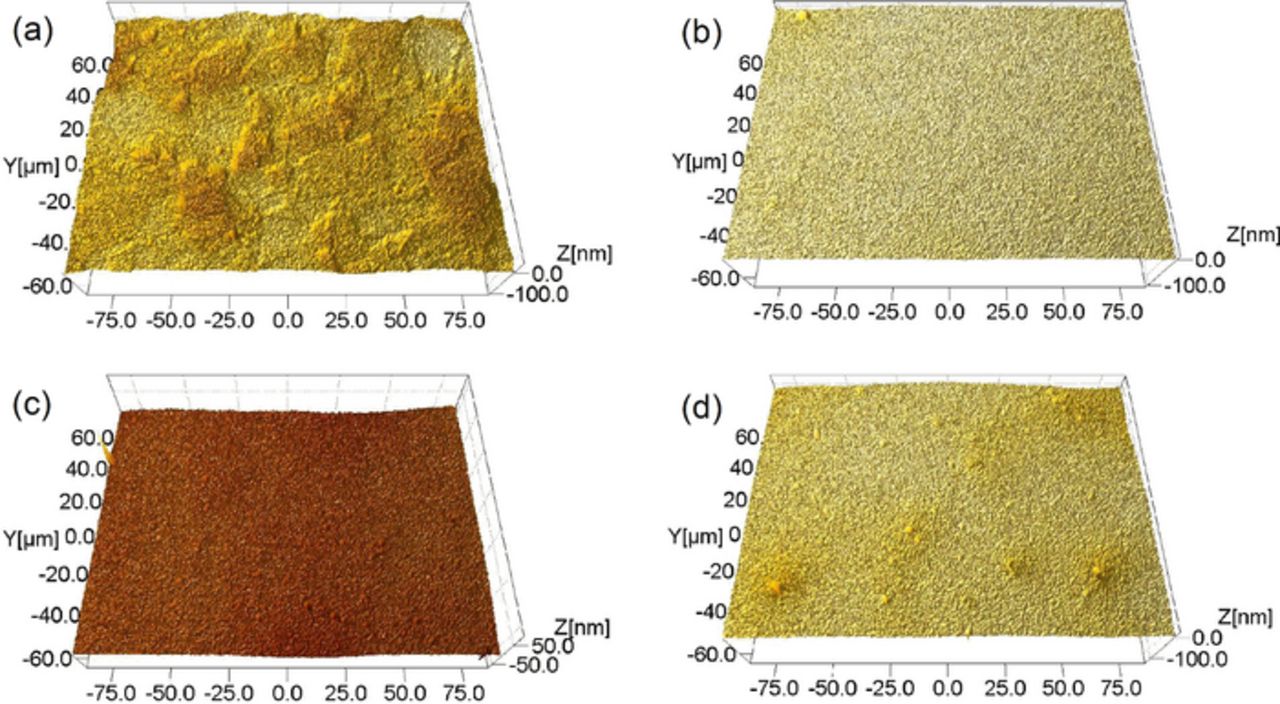
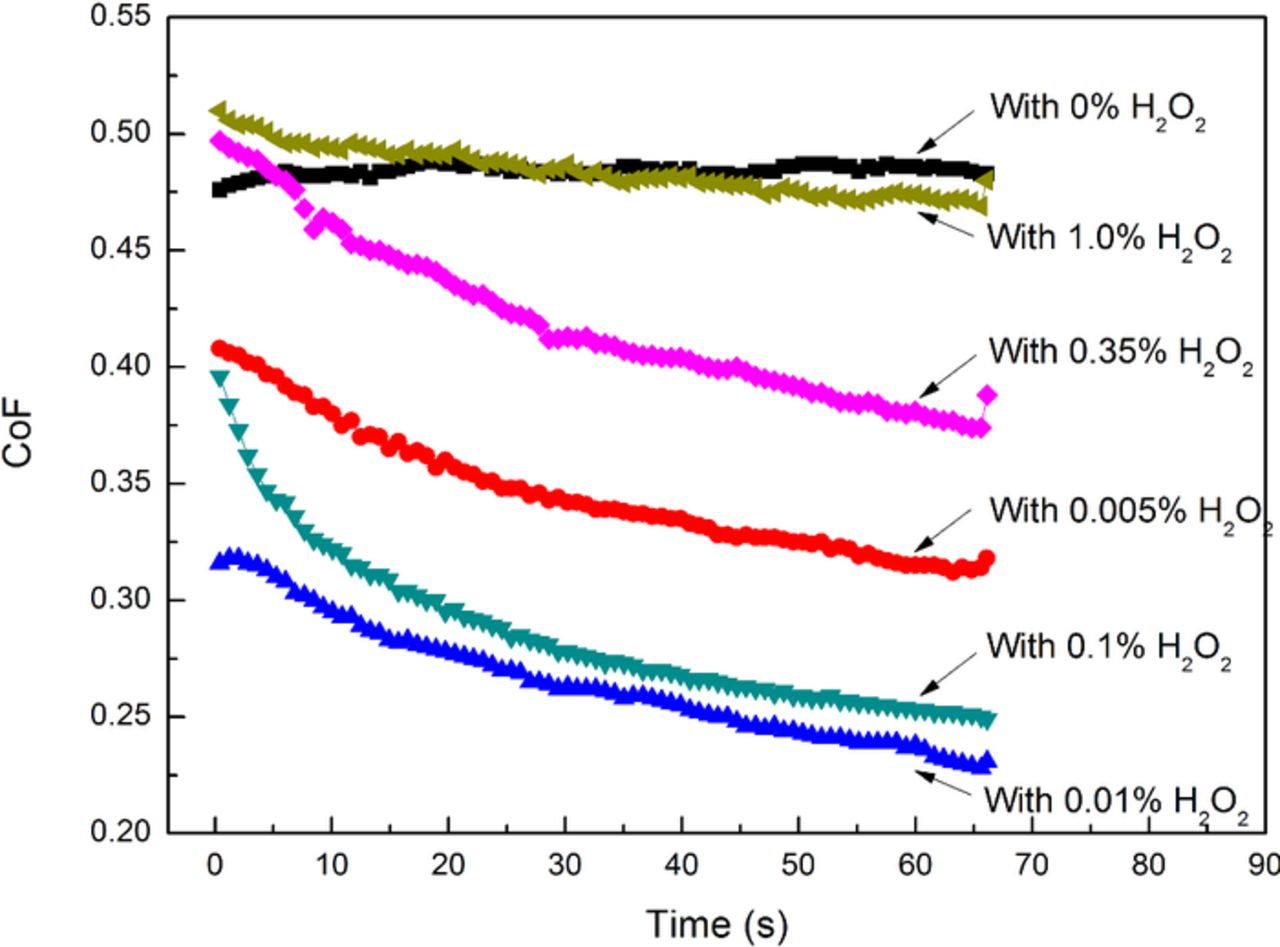
In order to avoid the generation of toxic Cr(VI) complex during the polishing process, pH of the slurries was set to being acidic. Based on the above investigation, it can be seen that, in the acidic range, pH 4.00 can achieve not only satisfactory MRR but also moderate surface quality. Therefore, pH 4.00 was chosen for the following tests as a promising starting point. The effect of H2O2 on the polishing performance of 316L stainless steel is shown in Fig. 4. The slurries were composed of 4.0 wt% and 8.0 wt% colloidal silica respectively, different concentrations of H2O2 and with pH 4.00. The H2O2 concentration was tested in detail. It can be seen that, with the increase in the H2O2 concentration, the SER keeps about 0 Å/min. For 4.0 wt% colloidal silica, the MRR first dramatically increases from 934 Å/min when the H2O2 concentration increases from 0 to 0.01 wt%, reaches the maximum value of 2223 Å/min with the addition of 0.01 wt% H2O2, and then gradually decreases to 579 Å/min when the H2O2 concentration further increases to 1.0 wt%; while the surface roughness Ra first decreases from 7.3 nm to 1.5 nm when the H2O2 concentration increases from 0 to 0.01 wt%, and then slightly increases to 2.9 nm when the H2O2 concentration further increases to 1.0 wt%. Similarly, for 8.0 wt% colloidal silica, the MRR first dramatically increases from 628 Å/min when the H2O2 concentration increases from 0 to 0.015 wt%, reaches the maximum value of 2869 Å/min with the addition of 0.015 wt% H2O2, and then gradually decreases to 673 Å/min when the H2O2 concentration further increases to 1.0 wt%. It should be noted that, for 4.0 wt% colloidal silica, the addition of 0.01 wt% H2O2 can increase the MRR to 2.4 times; for 8.0 wt% colloidal silica, the addition of 0.015 wt% H2O2 can increase the MRR to 4.6 times. The typical surface morphologies of 316L stainless steel after being polished with the slurries containing different concentrations of H2O2 are shown in Fig. 5. The slurries were composed of 4.0 wt% colloidal silica, different concentrations of H2O2 and with pH 4.00. It can be observed that, the addition of H2O2 can apparently improve the surface quality, especially with the addition of 0.01 wt% H2O2. The corresponding coefficient of friction (CoF) with varying concentration of H2O2 is shown in Fig. 6. The slurries were composed of 4.0 wt% colloidal silica, different concentrations of H2O2 and with pH 4.00. It can be seen that the CoF during 60-sec polishing process first decreases when the H2O2 concentration increases from 0 to 0.01 wt%, reaches the valley value with the addition of 0.01 wt% H2O2, and then gradually increases when the H2O2 concentration further increases to 1.0 wt%. The above results indicate that H2O2 has significant impact on the properties of the oxides formed on the top surface of 316L stainless steel, and in consequence, on the polishing performance of 316L stainless steel.
Figure 4. Effect of H2O2 on the polishing performance of 316L stainless steel.
Figure 5. Typical surface morphologies of 316L stainless steel after being polished with the slurries containing different concentrations of H2O2 at pH 4.00. (a) polished using the slurry containing no H2O2. PV is 148 nm, Rq is 9.00 nm and Ra is 7.12 nm; (b) polished using the slurry containing 0.01 wt% H2O2. PV is 120 nm, Rq is 2.59 nm and Ra is 1.72 nm; (c) polished using the slurry containing 0.1 wt% H2O2. PV is 163 nm, Rq is 4.15 nm and Ra is 3.18 nm; (d) polished using the slurry containing 5.0 wt% H2O2. PV is 147 nm, Rq is 5.06 nm and Ra is 3.71 nm.
Figure 6. The corresponding CoF with varying concentration of H2O2.
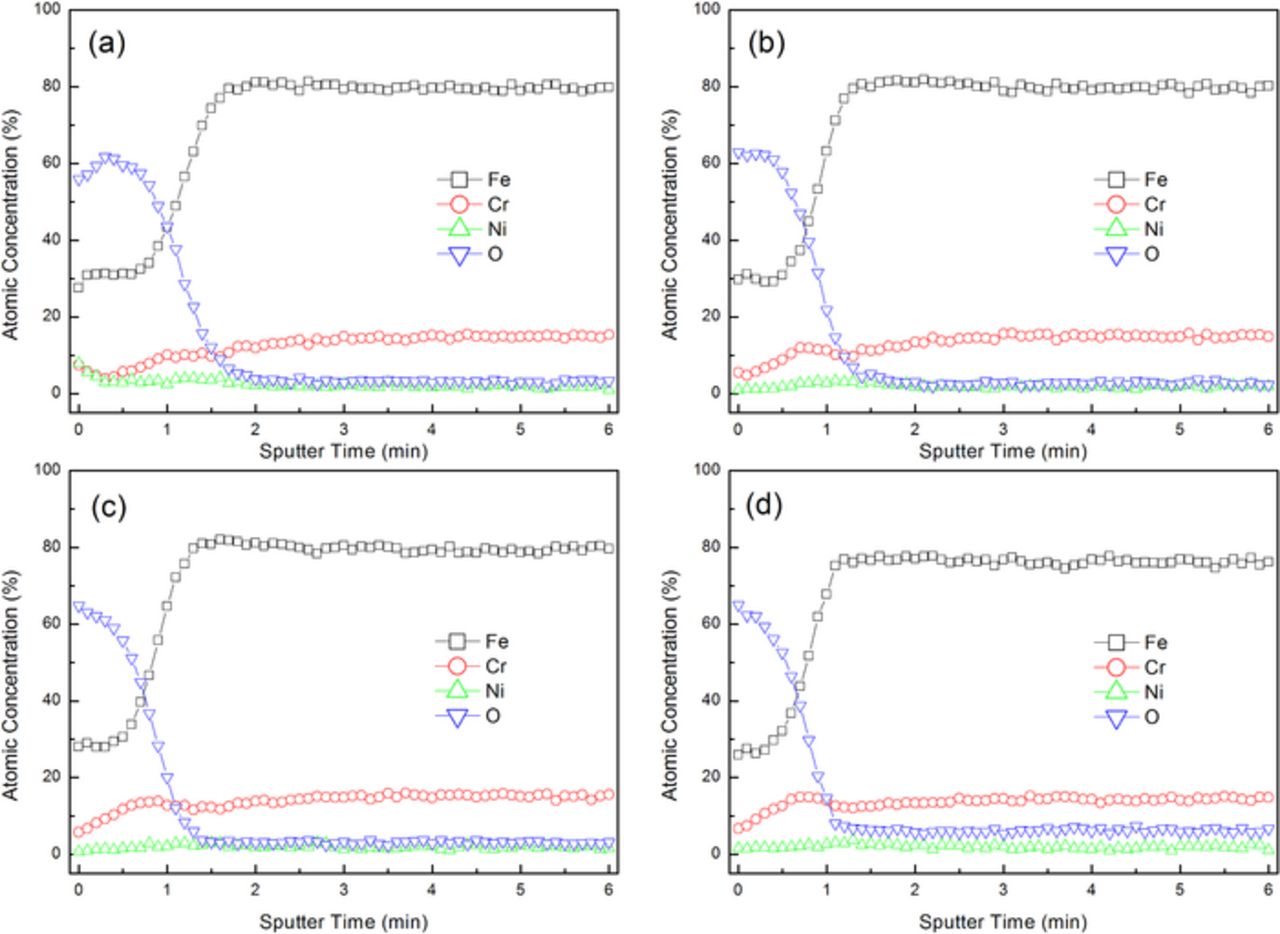
In order to thoroughly investigate the chemical compounds formed on the 316L stainless steel surface, AES and XPS measurements were carried out. The AES depth profiles of the oxide film formed on the 316L stainless steel surface after being polished with the slurries containing different concentrations of H2O2 are shown in Fig. 7. The slurries were composed of 4.0 wt% colloidal silica, different concentrations of H2O2 and with pH 4.00. The reference sputter rate is 2 nm/min for silicon dioxide. In order to approximately estimate the oxide film thickness, here the sputter rate of 2 nm/min is also applied for 316L stainless steel. The oxide film thickness can be estimated from the AES depth profiles at a point where the oxygen concentration becomes almost zero and stable. It can be seen that, with the increase in the H2O2 concentration, the oxide film thickness slightly decreases from 4 nm (without H2O2) to 3.6 nm (with the addition of 0.01 wt% H2O2), and then to 2.8 nm (with the addition of 1.0 wt% and 5.0 wt% H2O2), which might be attributed to the fact that, with the increase in the H2O2 concentration, the oxide film gradually grows compact and the diffusion of dissolved oxygen and H2O2 into the base material become more difficult, and thereby the further oxidation is inhibited. Furthermore, for all the cases, with the sputter time, the iron concentration first keeps around 30 at% and then linearly increases to around 80 at%, while the chromium concentration first linearly increases to around 10 at% and then keeps stable. Therefore, it could be inferred that the oxide film is made up of two layers: the outer layer is mainly composed of iron-enriched oxides, and the inner layer is mainly composed of iron-enriched and chromium-enriched oxides.25–27
Figure 7. AES depth profiles of the oxide film formed on the 316L stainless steel surface after being polished with the slurries containing different concentrations of H2O2. (a) without H2O2; (b) with the addition of 0.01 wt% H2O2; (c) with the addition of 1.0 wt% H2O2; (d) with the addition of 5.0 wt% H2O2.
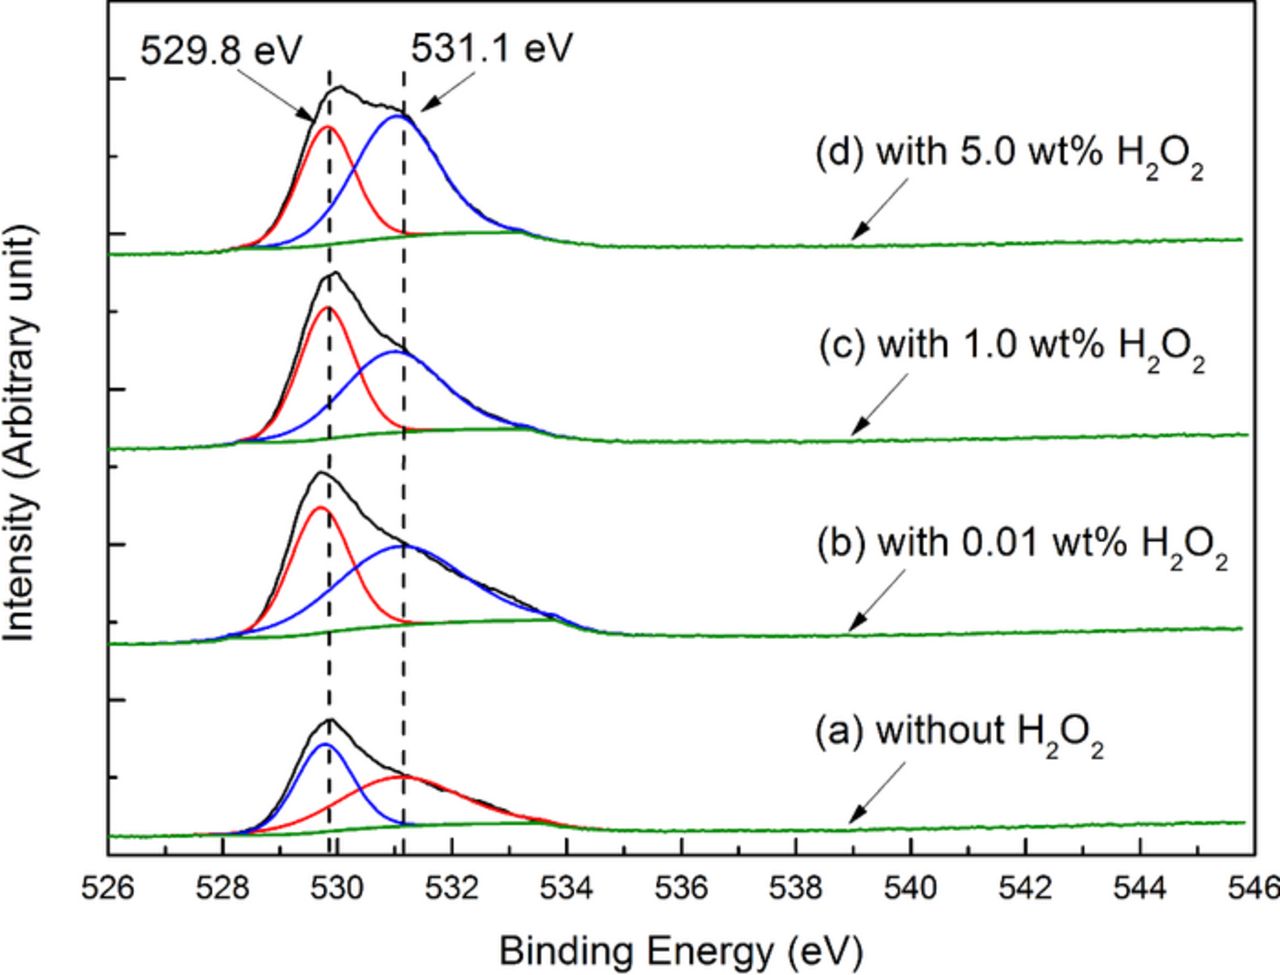
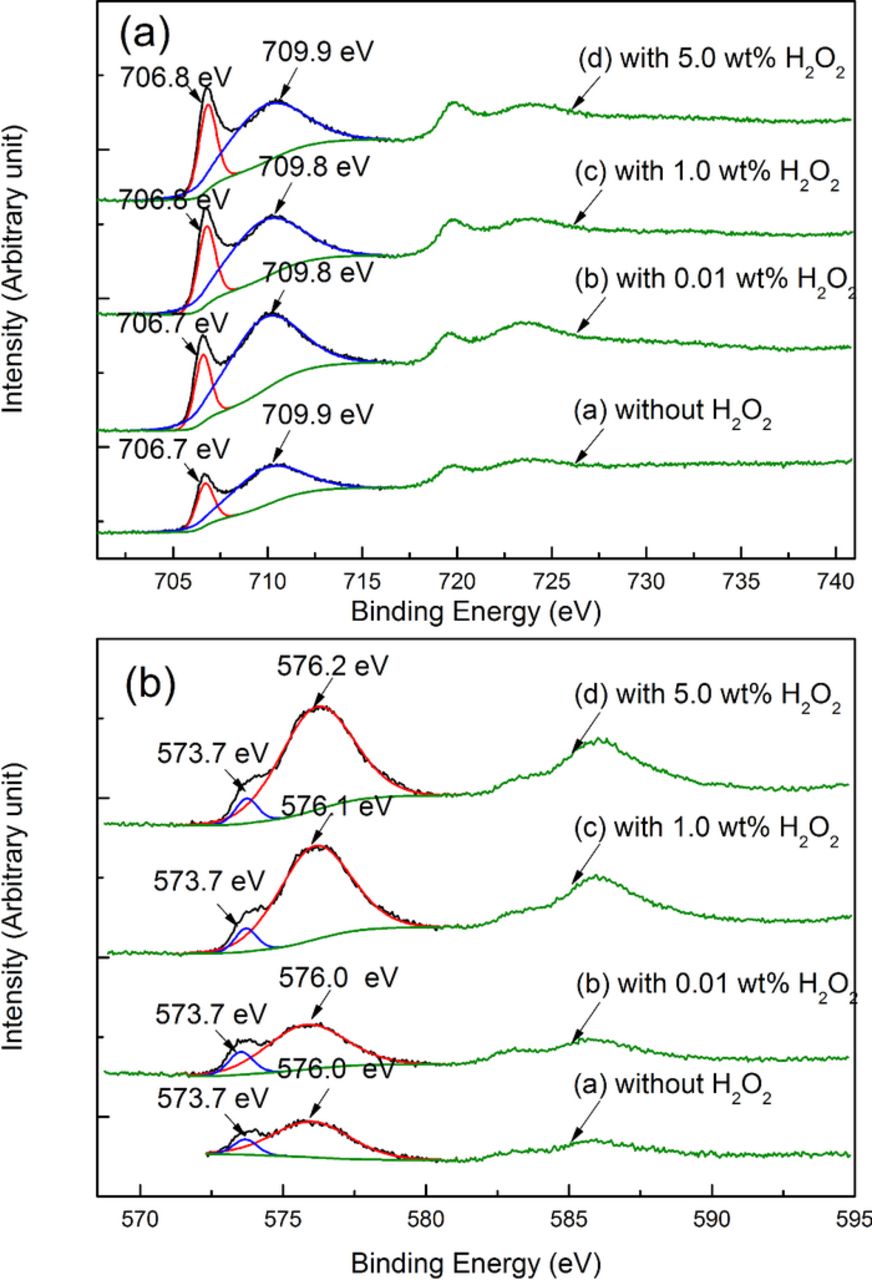
XPS technique was used to further investigate the chemical compositions of the oxide film.27 The XPS O(1s) spectra of the 316L stainless steel surface after being polished with the slurries containing different concentrations of H2O2 are shown in Fig. 8. The slurries were the same as those of the AES measurements. It can be seen that, the deconvolution of all the O(1s) spectra reveals two peaks at 529.8 eV and 531.1 eV, which should correspond to oxygen as forms of O2− and OH− respectively;28–30 moreover, with the increase in the H2O2 concentration, the proportion of oxygen as a form of OH− slightly increases from 53.61 at% (without H2O2) to 57.20 at% (with the addition of 0.01 wt% H2O2), and then to 60.70 at% (with the addition of 5.0 wt% H2O2), which indicates that the proportion of the oxides with OH− radicals increases. The corresponding XPS Fe(2p) and Cr(2p) spectra are shown in Fig. 9. As shown in Fig. 9a, the deconvolution of the Fe(2p) spectra reveals two peaks, of which that with the lower binding energy should correspond to the metallic iron,28,29,31 and that with the higher binding energy should correspond to the mixture of the iron oxides.27–29,31 Similarly, as shown in Fig. 9b, the deconvolution of the Cr(2p) spectra also reveals two peaks, of which that with the lower binding energy should correspond to the metallic chromium, and that with the higher binding energy should correspond to the Cr(III) oxides.27
Figure 8. XPS O(1s) spectra of the 316L stainless steel surface after being polished with the slurries containing different concentrations of H2O2.
Figure 9. XPS Fe(2p) and Cr(2p) spectra of the 316L stainless steel surface after being polished with the slurries containing different concentrations of H2O2. (a) XPS Fe(2p) spectra; (b) XPS Cr(2p) spectra.
The above AES and XPS results confirm that, by 316L stainless steel reacting with either dissolved oxygen or H2O2, a bilayer-structure oxide film could be formed on the top surface of 316L stainless steel, which is consistent with other researcher's results.26,27,32 It is reported that, with sufficient reaction time, the outer layer of the oxide film can be completely transformed into α-FeOOH and α-Fe2O3.25,27,33 In acidic condition, the oxidation process of the outer layer from metallic iron into α-FeOOH and α-Fe2O3 can be depicted as follows:34 at the 1st stage, since the diffusion velocity of iron is faster than that of chromium and that of nickel, iron can quickly diffuse on the top surface. By iron reacting with the oxidizer, such as dissolved oxygen and H2O2, iron oxides can be formed, and then precipitate back to form the outer layer of the oxide film; in contrast, chromium diffuses more slowly than iron, and thus they are retained and enriched in the inner layer of the oxide film.27 At this initial stage, the iron oxides of the outer layer are mainly composed of amorphous iron oxides, small amount of α-FeOOH, γ-FeOOH and Fe3O4, which is quite porous; at the 2nd stage, the iron oxides keeps growing with more iron atoms diffusing through the pores and reacting with the oxidizer. It is revealed that, γ-FeOOH can gradually transform into α-FeOOH and further into α-Fe2O3 when γ-FeOOH accumulates to certain amount, and the oxide layer becomes compact. Moreover, the crystallization of α-FeOOH can induce the polymerization of the amorphous iron oxides, by which the compactness of the iron oxides can be further enhanced.35 However, during the CMP process, at a fixed point on the metal surface, the average interval between two consecutive particle–metal interactions under an asperity was estimated to be less than 10 μs.36 Within such short reaction time, metallic iron cannot be completely oxidized into α-Fe2O3, and instead, depending on the polishing conditions such as the H2O2 concentration, the oxidation process should be in between the above two stages, and consequently, the oxidation products should be the mixture of the iron oxides described above, which is consistent with the XPS Fe(2p) spectra analysis results. However, during the polishing process, as revealed by the AES results, the oxide layer formed on the top surface has only several nanometers, and meanwhile, the proportions of α-FeOOH, γ-FeOOH, Fe3O4 and α-Fe2O3 are relatively small, and thereby it is probably impossible to assign peaks of the Fe(2p) spectra to the above compounds, respectively. Furthermore, based on the preliminary result, it is difficult to identify the exact compositions of the oxide layer on the top surface by some other techniques such as Grazing Incident X-Ray Diffraction. It is reported that, compared with dissolved oxygen, H2O2 can effectively accelerate the oxidation process.32,37 The XPS O(1s) spectra show that, with the increase in the H2O2 concentration, the proportion of the oxides with OH− radicals increases. Based on the above analysis, the oxides with OH− radicals could be α-FeOOH. Therefore, according to the experimental results and the related references, it can be inferred that, with the addition of small amount of H2O2, the outer layer of the oxide film, which is mainly composed of amorphous iron oxides, small amount of α-FeOOH, γ-FeOOH and Fe3O4, can be rapidly formed on the top surface of 316L stainless steel, and then can be easily removed by silica particles due to its low mechanical strength, and therefore the MRR dramatically increases and the CoF decreases initially; with the further increase in the H2O2 concentration, the content of α-FeOOH (and even α-Fe2O3) gradually increases, and as a result, the outer layer grows compact, and therefore the MRR gradually decreases and the CoF increases. However, some further work is still needed to investigate the exact oxidation reactions occurring on the 316L stainless steel surface under the above conditions.
Effect of BTA on the polishing performance of 316L stainless steel
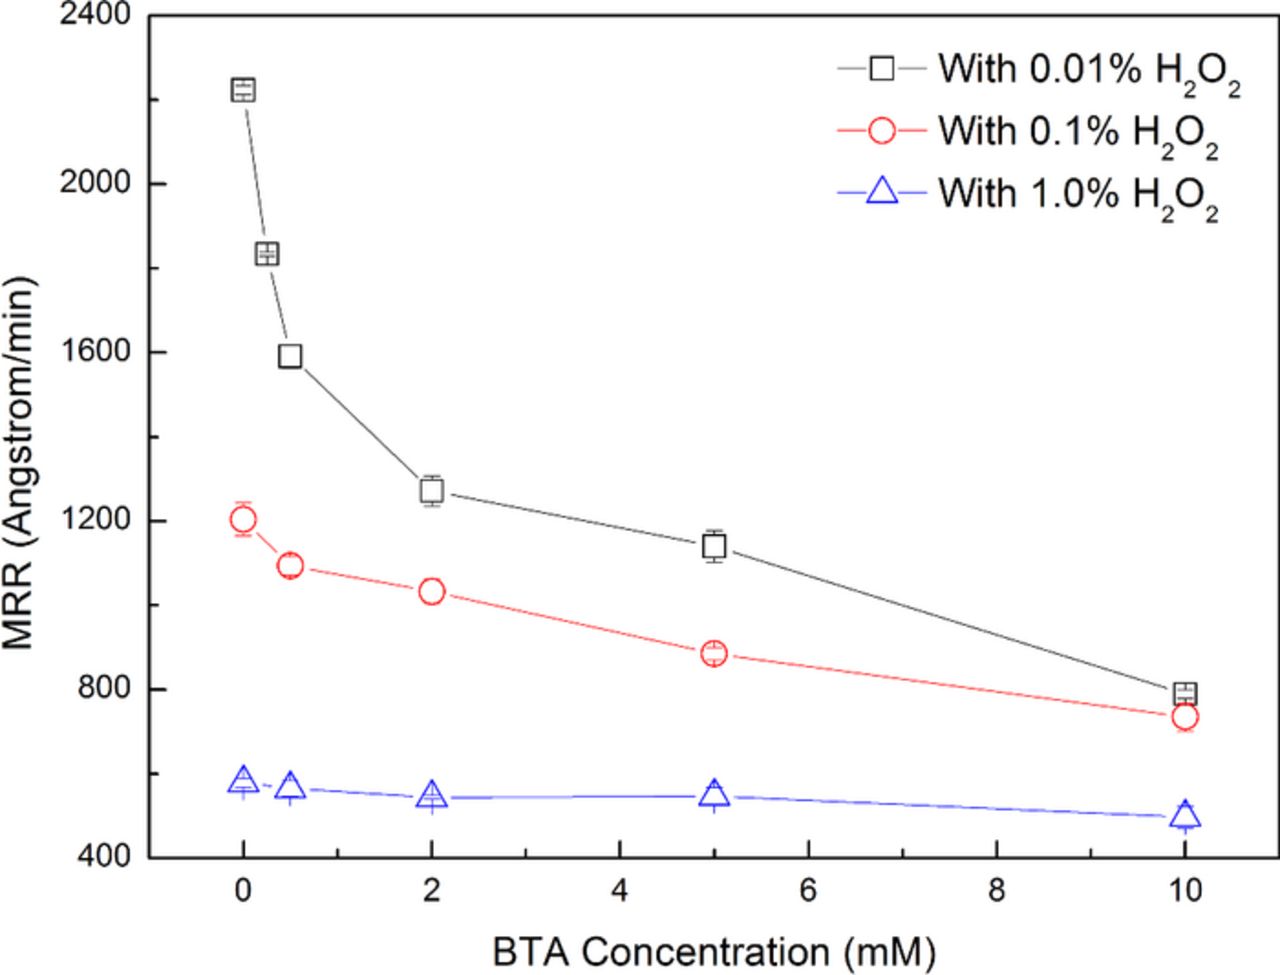
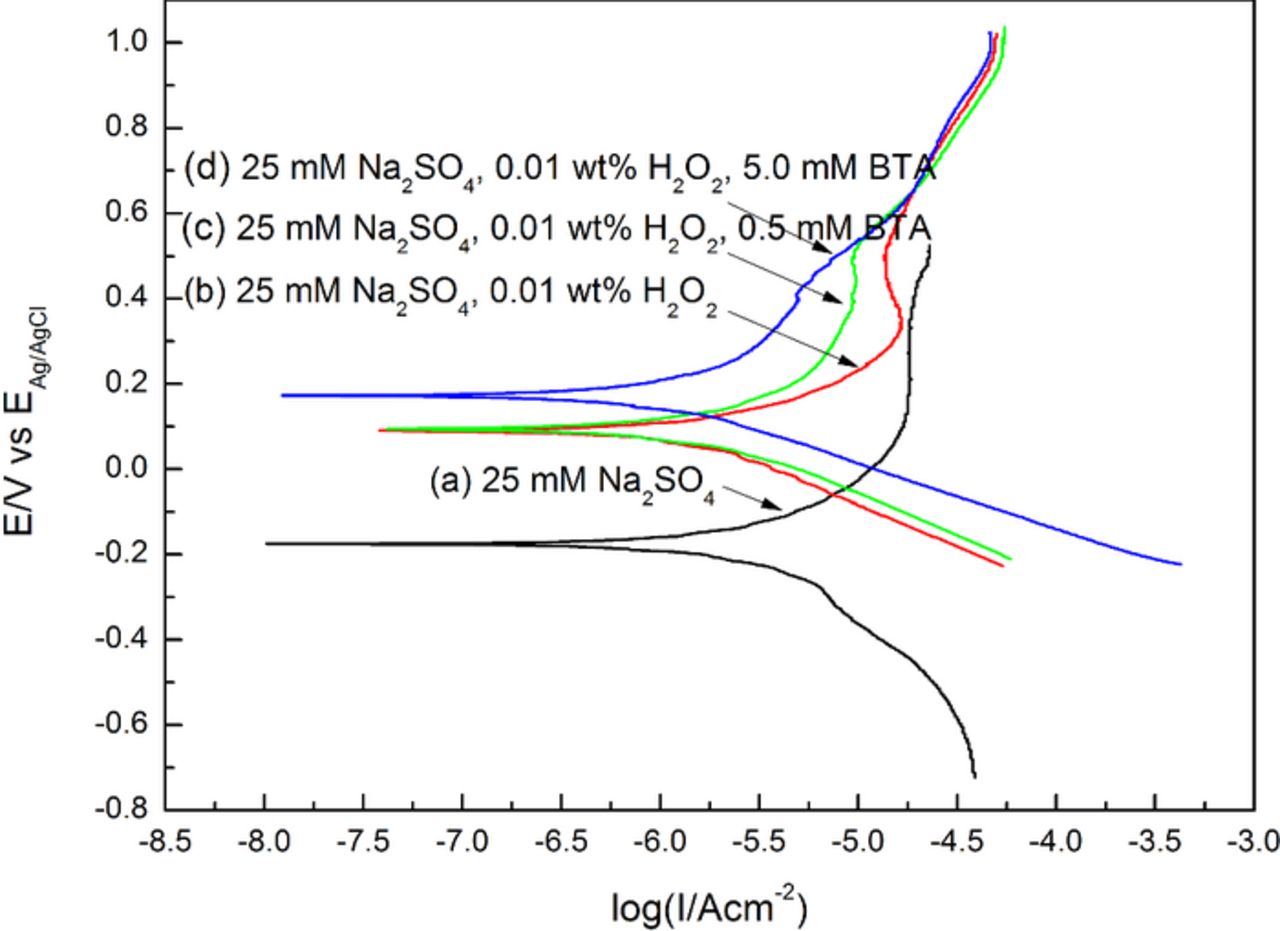
Inhibitors have been commonly used to protect the surface from chemical attack, and BTA is one of the most widely used inhibitors.38–43 The effect of BTA on the MRR of 316L stainless steel is shown in Fig. 10. The slurries were composed of 4.0 wt% colloidal silica, 0.01 wt%, 0.1 wt% and 1.0 wt% H2O2 respectively, different concentrations of BTA and with pH 4.00. It can be seen that, with the increase in the BTA concentration, the MRR is gradually suppressed, especially with the addition of small amount of H2O2, such as 0.01 wt% and 0.1 wt%. The potentiodynamic polarization plots of the 316L stainless steel electrode are shown in Fig. 11. 25 mM Na2SO4 was added to increase the conductivity of the test solutions since 0.01 wt% H2O2 provides weak conductivity at pH 4.00. It should be noted that, the potentiodynamic polarization experiments were carried out under the static condition, which was slightly different from the dynamic polishing process, and the results were used for assisting in revealing BTA's passivation mechanism during the polishing process. It can be seen from curve (a) and curve (b) that, the addition of 0.01 wt% H2O2 can obviously increase the corrosion potential Ecorr, which is probably caused by the enhancement of H2O2 decomposition as the main cathodic reaction shown as follows:
![Equation ([3])](https://content.cld.iop.org/journals/2162-8777/4/5/P162/revision1/jss_4_5_P162eqn3.jpg)
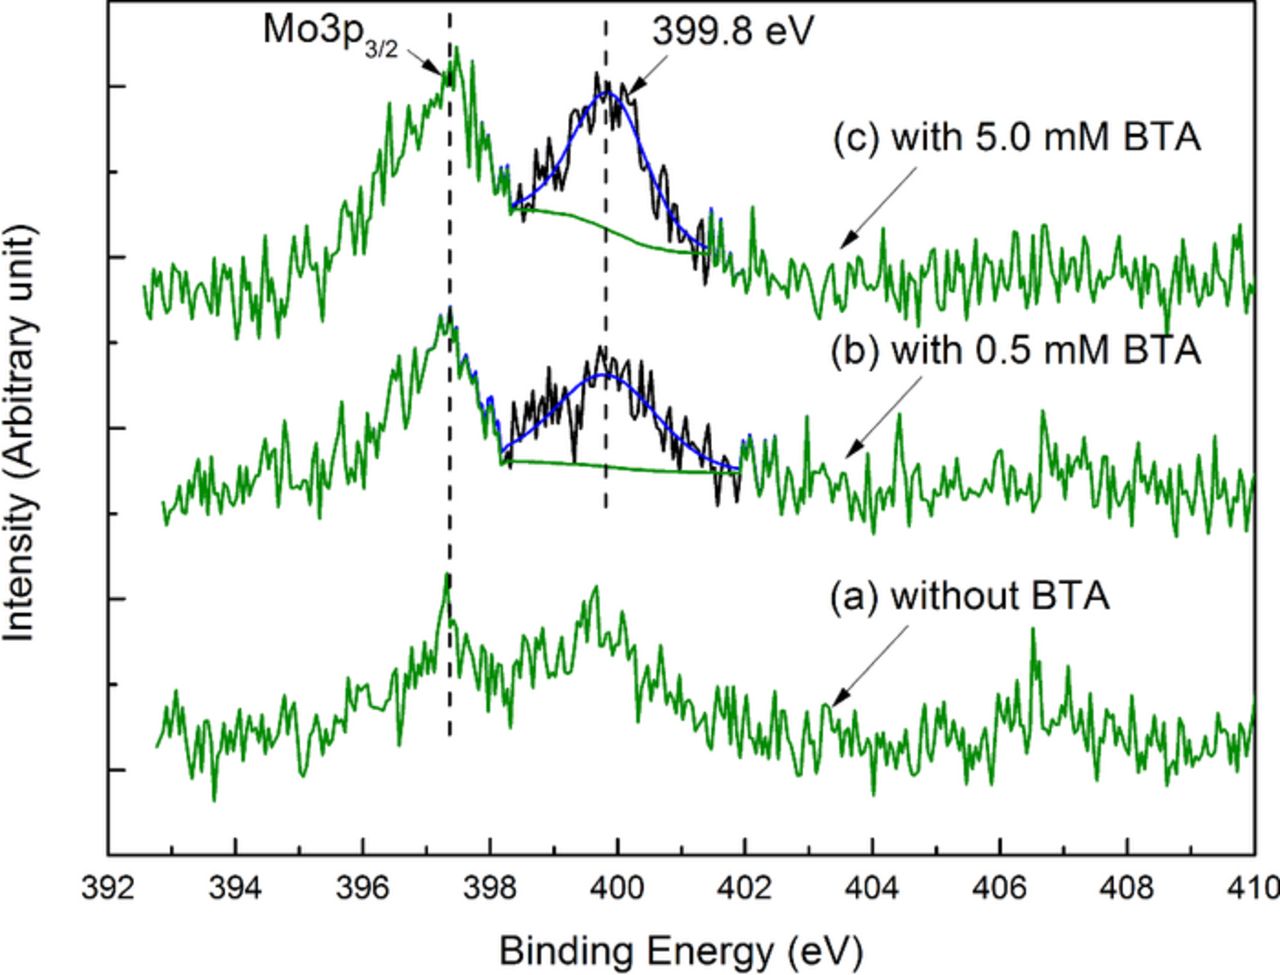
And the anodic current density is strongly suppressed since the passive oxides can be rapidly formed on the surface of the 316L stainless steel electrode by 316L stainless steel reacting with H2O2, which is consistent with the above inference. As can be seen from curves (b)–(d), with the increase in the BTA concentration, when the applied potential is in the range of Ecorr+100 mV and ∼0.7 V (vs. EAg/AgCl), the anodic current density gradually decreases, which indicates that, under this condition, BTA can form a passivating layer on the top surface and thereby can inhibit the oxidation.38–41,43 The XPS N(1s) spectra of the 316L stainless steel surface after being polished with the slurries containing different concentrations of BTA are shown in Fig. 12. According to the pH-potential diagram for molybdenum-water system at 25°C, in acidic solutions and in the presence of strong oxidizer such as H2O2, molybdenum can be oxidized into Mo(VI) oxides as a form of MoO3.44,45 It should be noted that, as shown in Fig. 12, the weak signal of the peak at 397.4 eV should correspond to Mo3p3/2 of the Mo(VI) oxides.46 With the increase in the BTA concentration, the N(1s) peak at 399.8 eV becomes more apparent, which is probably attributed to the increase in the intensity of the 316L stainless steel-BTA complex on the surface.47 The passivation of BTA can be explained as follows. According to the inference in Effect of H2O2 on the polishing performance of 316L stainless steel section, the addition of H2O2 can accelerate the formation of the oxide film, of which the outer layer is mainly composed of iron oxides. According to the Langmuir adsorption isotherm, BTA can be both physically and chemically absorbed on the iron surface in acid solutions.41 Specifically, the chemical adsorption can occur between the π-electrons of the BTA molecules and the vacant d-orbital of the iron atoms on the surface, and the nitrogen atoms of the triazole ring of BTA can directly react with the iron atoms to generate complex polymer as a form of [Fen(BTA)p]m.40 Therefore, it can be inferred that, with the addition of H2O2, BTA can form a thin passivating layer on the top surface of 316L stainless steel, and as a result, the MRR is gradually suppressed.
Figure 10. Effect of BTA on the MRR of 316L stainless steel.
Figure 11. Potentiodynamic polarization plots of the 316L stainless steel electrode.
Figure 12. XPS N(1s) spectra of the 316L steel surface after being polished with the slurries containing 4.0 wt% colloidal silica, 0.01 wt% H2O2 and different concentrations of BTA.
Two-step polishing method
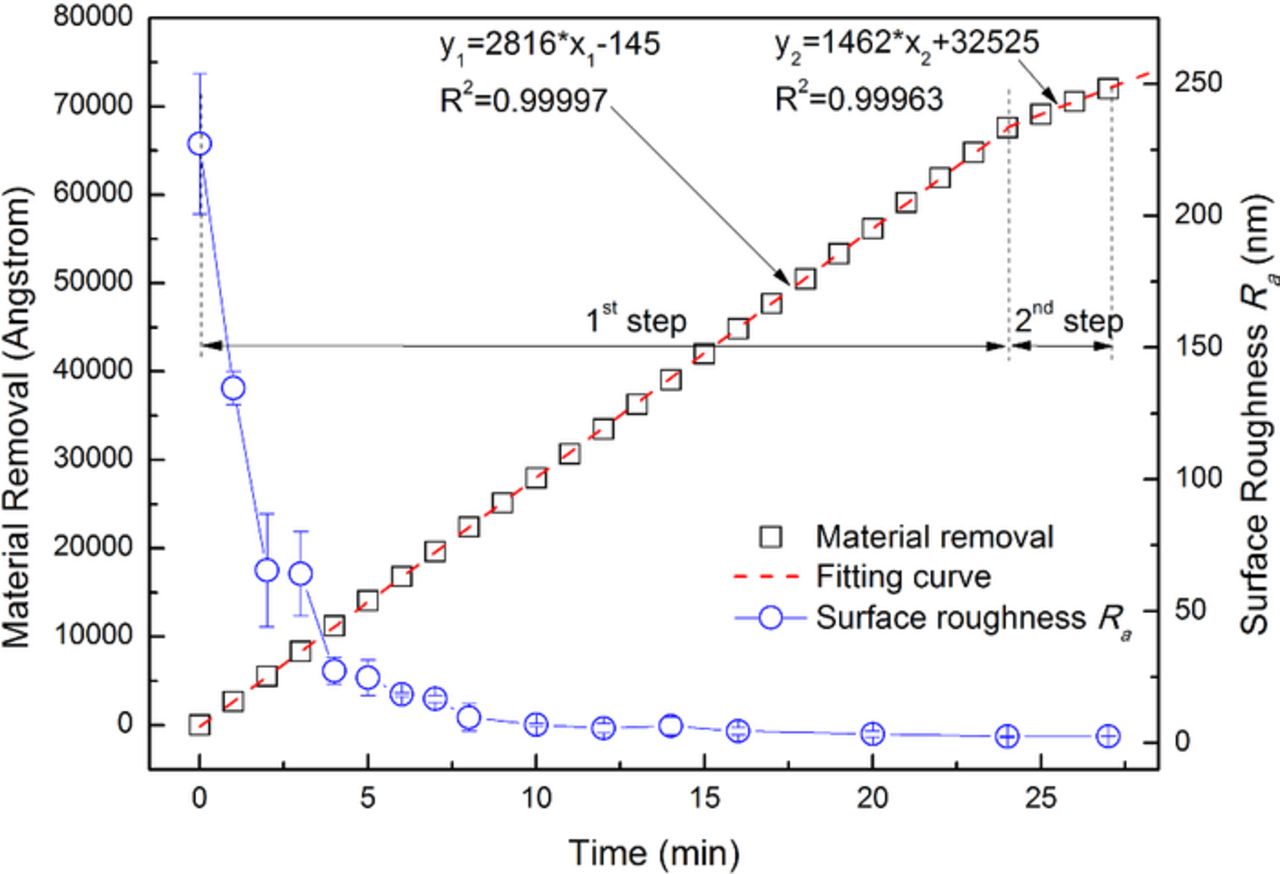
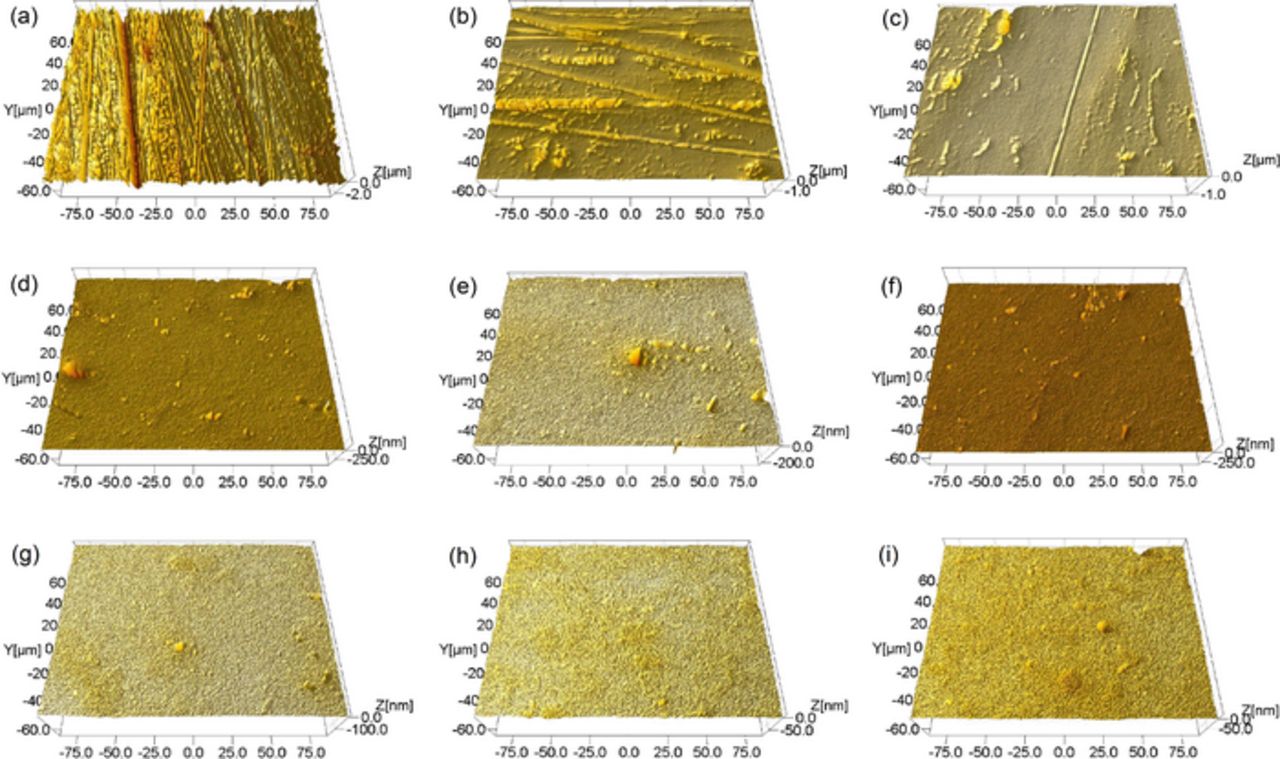
In order to realize satisfactory surface quality of 316L stainless steel with economical resources like slurry and polishing time, based on the above investigation, a two-step polishing method is proposed as follows: the 1st step is designed to quickly remove the mechanically damaged layer caused by the previous machining process with a large MRR of about 3000 Å/min, and meanwhile to achieve moderate surface quality of about 3 nm Ra; the 2nd step is designed to further improve the surface quality by using a relatively weaker mechanical force and by forming a passivating layer on the top surface. According to the above requirements, the slurry for the 1st step is composed of 8.0 wt% colloidal silica, 0.015 wt% H2O2 and with pH 4.00, and the slurry for the 2nd step is composed of 4.0 wt% colloidal silica, 0.01 wt% H2O2, 0.5 mM BTA and with pH 4.00. The results of the two-step polishing method on a brand new 316L stainless steel disk are shown in Fig. 13, and the corresponding evolution of the surface morphologies is shown in Fig. 14. It can be seen that, for the 1st step, the material removal (MR) linearly increases with an average MRR of 2816 Å/min, the surface roughness Ra gradually decreases, and the surface morphology progressively improved as shown in Fig. 14. After being polished for 24 min, the original mechanically damaged layer of about 6.8 μm is completely removed, the surface roughness Ra decreases from the initial 227.3 nm to 2.4 nm, and the surface morphology changes from rough and uneven into smooth and flat as shown in Fig. 14h; for the 2nd step, the MR linearly increases with an average MRR of 1462 Å/min, and after 3 min, a compact passivating BTA layer is formed on the surface, and the surface roughness Ra keeps 2.5 nm. Therefore, it can be concluded that, within 30 min, the ultra-smooth 316L stainless steel surface with a surface roughness Ra of about 2.0 nm can be achieved by the proposed two-step polishing method. Subsequently, the polished 316L stainless steel with such ultra-smooth surface could be used as the substrate for thin-film solar cells.
Figure 13. Results of the two-step polishing method on a brand new 316L stainless steel disk.
Figure 14. Typical surface morphologies of 316L stainless steel after being polished with the two-step polishing method. (a) the fresh surface. PV is 3675 nm, Rq is 345 nm and Ra is 258 nm; (b) polished for 2 min. PV is 2109 nm, Rq is 103 nm and Ra is 56.60 nm; (c) polished for 4 min. PV is 1187 nm, Rq is 44.4 nm and Ra is 28.10 nm; (d) polished for 8 min. PV is 597 nm, Rq is 16.8 nm and Ra is 7.54 nm; (e) polished for 12 min. PV is 261 nm, Rq is 12.6 nm and Ra is 6.61 nm; (f) polished for 16 min. PV is 529 nm, Rq is 9.14 nm and Ra is 4.37 nm; (g) polished for 20 min. PV is 180 nm, Rq is 5.46 nm and Ra is 3.31 nm; (h) polished for 24 min. PV is 85.0 nm, Rq is 2.69 nm and Ra is 2.03 nm; (i) polished for 27 min. PV is 114 nm, Rq is 3.73 nm and Ra is 2.40 nm.
Conclusions
The fundamental polishing mechanism of 316L stainless steel as the solar cell substrate was thoroughly studied in colloidal silica-based slurries. Solid content, pH, H2O2 and BTA have significant impact on the polishing performance of 316L stainless steel. With the increase in the colloidal silica concentration, the MRR first gradually increases and then becomes saturated. With the increase in pH from 2.00 to 11.00, the SER keeps the value almost at zero; the MRR gradually decreases due to the formation of compact and passive oxides on the surface, and as a result, the post-CMP surface roughness decreases. At pH 4.00, with the increase in the H2O2 concentration, the SER maintains zero; the MRR first dramatically increases due to the rapid formation of the porous outer layer of the bilayer-structure oxide film on the surface, which is mainly composed of iron-enriched oxides. Then after reaching the peak value, the MRR gradually decreases since the porous outer layer grows compact with relatively higher mechanical strength. With the increase in the BTA concentration, the MRR can be gradually suppressed probably due to the formation of 316L stainless steel-BTA passivating film on the top surface. Finally, based on the above results, a two-step polishing method was proposed. The polishing results show that, within 30 min, a rough 316L stainless steel substrate with a Ra of 258 nm can be polished into a smooth and flat surface with a Ra of about 2.0 nm. The polished 316L stainless steel with such ultra-smooth surface could be used as the substrate for thin-film solar cells.
Acknowledgments
The authors thank the financial support of NSFC of China (51321092 and 51275263) and the State Key Development Program for Basic Research of China (grant No. 2014CB046404).

