Abstract
The reduction of sulfur during discharge in a lithium-sulfur (Li-S) cell is known to occur in a series of reaction steps that involve lithium polysulfide intermediates. We present an operando study of the discharge of a solid-state Li-S cell using X-ray absorption spectroscopy (XAS). In theory, the average chain length of the polysulfides, xavg,cell, at a given depth of discharge is determined by the number of electrons delivered to the sulfur cathode. The dependence of xavg,cell measured by XAS on the depth of discharge is in excellent agreement with theoretical predictions. XAS is also used to track the formation of Li2S, the final discharge product, as a function of depth of discharge. The XAS measurements were used to estimate rate constants of a series of simple reactions commonly accepted in literature.
Export citation and abstract BibTeX RIS

This is an open access article distributed under the terms of the Creative Commons Attribution 4.0 License (CC BY, http://creativecommons.org/licenses/by/4.0/), which permits unrestricted reuse of the work in any medium, provided the original work is properly cited.
Lithium-sulfur (Li-S) batteries have been considered as attractive alternative to current Li-ion batteries due to their large theoretical capacity (1672 mAh/g) and theoretical energy density (2600 Wh/kg). Sulfur is a particularly attractive cathode material for large format cells because it is cheap and abundant.1–4 While there are numerous practical problems that have prevented the commercialization of rechargeable Li-S batteries, a significant barrier is the lack of understanding of the reaction mechanism that underlies this chemistry.5–10 The redox reactions in the sulfur cathode occur in steps.11 Some of the products in these steps are soluble lithium polysulfides intermediates.12–14 The chemical formulae of lithium polysulfides are generally expressed as Li2Sx where x, the length of the sulfur chain in the polysulfide is generally assumed to be between 2 and 8.15 The dissolution of these species into the electrolyte is one of the primary problems that must be overcome before rechargeable Li-S batteries are commercialized. It also interferes with fundamental studies of redox reactions in the sulfur cathode.
The discharge reaction in the sulfur cathode of a Li-S cell can be written as Equation 1.
![Equation ([1])](https://content.cld.iop.org/journals/1945-7111/165/14/A3487/revision1/d0001.gif)
We define ne as the moles of electrons delivered to the sulfur cathode per mole of S8 in the cathode. The discharge reaction is complete when ne = 16 and the only product in the cathode is Li2S. Our interest is to determine the state of the cathode during the intermediate steps of the discharge process. It is well known that numerous partially reduced sulfur species exist in the cathode during these intermediate steps. Despite these complexities, Equation 1 must hold. In other words, the distribution of polysulfides obtained at a particular value of ne must be such that the average chain length of the polysulfides, xavg, is given by Equation 2, which arises due to mole balance of sulfur in Equation 1.
![Equation ([2])](https://content.cld.iop.org/journals/1945-7111/165/14/A3487/revision1/d0002.gif)
To our knowledge, the validity of Equation 2 has not been experimentally established.
Many reactions have been proposed11 for the stepwise reduction of sulfur. We begin our discussion with a simple series of steps given below:
![Equation ([3])](https://content.cld.iop.org/journals/1945-7111/165/14/A3487/revision1/d0003.gif)
![Equation ([4])](https://content.cld.iop.org/journals/1945-7111/165/14/A3487/revision1/d0004.gif)
![Equation ([5])](https://content.cld.iop.org/journals/1945-7111/165/14/A3487/revision1/d0005.gif)
![Equation ([6])](https://content.cld.iop.org/journals/1945-7111/165/14/A3487/revision1/d0006.gif)
In the simplest case, the overall sulfur reduction reaction rate is governed by the discharge rate imposed on the Li-S cell. This will be true if effects such as transport limitations in the electrolyte and blocking of electrode surfaces due to insulating products are negligible. The discharge rate is typically expressed as C/τ where τ is the number of hours required to fully discharge the cathode. The overall rate of the discharge reaction is controlled by dne/dt, which is held constant during a galvanostatic discharge. If we start with a sulfur cathode containing m grams of sulfur (0.171 mg), and discharge it with a current, i in mA (0.0143 mA), then ne at a given time, t in hours, is given by Equation 7.
![Equation ([7])](https://content.cld.iop.org/journals/1945-7111/165/14/A3487/revision1/d0007.gif)
where we have used the fact that the theoretical capacity of the sulfur cathode is 1672 mAh per g of sulfur.
The electrons delivered by the potentiostat to the cathode participate in all of the Reactions 3–6. The distribution of polysulfides in the cathode at time t will be determined by the relative rate constants, k0/k1, k2/k1, and k3/k1; see Reactions 3-–6 for definitions of ki. Our use of k1 to normalize rate constants will be made clear shortly. Our objective is to estimate some of the relative rate constants that characterize reactions in a model sulfur cathode.
In the past decade, different techniques have been used to study the reaction mechanism in Li-S cells. Each technique has its own advantages and limitations.9,11 Electrochemical measurements such as cyclic voltammetry (CV)16,17 and rotating-ring disk electrode (RRDE)18 are powerful approaches for determining the state of discharge but lack of the ability to distinguish different reaction products. X-ray diffraction (XRD) can be used to detect the presence of crystalline species such as Li2S and S8 but it is insensitive to the presence of amorphous polysulfides.19,20 Uv-vis,21–23 Raman,24,25 NMR26,27 and X-ray absorption spectroscopy (XAS)28–39 can, in principal be used to detect polysulfides. In References 20–38, measured spectra are used to infer the presence of certain specific polysulfide species. Such inferences rely on spectral signatures of pure polysulfides. Unfortunately there is no consensus on how polysulfides might be purified nor is there consensus on unique spectral fingerprints of different polysulfides.
In this paper, we present results of an operando XAS study of a solid-state Li-S cell. Our measurements enable independent measurements of xavg and ne, thereby enabling a test of the validity of Equation 2. The XAS data also enable determination of the moles of Li2S formed during discharge. These measurements enable determination of relative rate constants that characterize sulfur oxidation in the cathode, k2/k1 and k3/k1.
Experimental
The separator/electrolyte and cathode were stored inside an argon-filled glove box (MBraun) with H2O and O2 concentrations maintained at less than 0.1 ppm. Cell assembly was performed inside the same glove box.
Separator/electrolyte film preparation
The separator/electrolyte films were prepared using a block copolymer of polystyrene-b-poly(ethylene oxide) (SEO) synthesized using methods described in the work by Hadjichristidis et al.40 and purified using methods described in the work by Teran et al.41 The molecular weights of polystyrene and poly(ethylene oxide) are 200 kg/mol and 222 kg/mol, respectively. Lithium perchlorate (LiClO4, Sigma-Aldrich) was dried for 24 hours under vacuum at 90°C before use. The separator/electrolyte films containing SEO and LiClO4 were prepared according to the method described in the work by Wujcik et al.42 The thickness of separator/electrolyte film used was 22 μm.
Cathode preparation
Cathode slurries containing S8 (Alfa Aesar), Li2S (Sigma-Aldrich) carbon black (Denka), LiClO4, and SEO (identical LiClO4/SEO composition to that of the electrolyte separator) was mixed in n-methylpyrrolidone (NMP). The slurry was composed of 89 wt% of NMP. S8 and Li2S were mixed in a 256:46 weight ratio to produce Li2Sx with an average x value of 8 as the starting material. Due to the insulating properties, both ionic and electronic, of S8, Li2S8 was used as the starting material. Since Li2S8 is soluble in the slurry, we expect a uniform distribution of the sulfur-containing species in the cathode (as opposed to insoluble S8), and we posit that this leads to better contact between the active material, the electrolyte and carbon black in the dry cathode. The slurry was mixed overnight at 90°C and subsequently mixed using a homogenizer (Polytron) set to 15,000 RPM. Homogenization was done for five minutes and repeated three times, with two minute rests between each cycle to prevent the solution from heating up to undesirable temperatures. The resulting slurry was then casted onto an 18 μm thick aluminum foil current collector using a doctor blade. The film was dried under Argon at 60°C for 10 hours and then placed under static vacuum overnight at room temperature. The resulting cathode had an average thickness of 16 μm, with the resulting composition: 12.8 wt% Li2S8, 51.4 wt% SEO, 5.5 wt% LiClO4, and 30.3 wt% carbon. Our use of a relatively thin sulfur cathode with low sulfur loading was motivated by our desire to minimize self-absorption in the XAS experiments.
Cell assembly and cycling
A pouch cell was prepared according to the method described in the work by Wujcik et al.37 The electrolyte film was placed on the cathode. The lithium metal anode was then placed over the electrolyte film. The cathode-electrolyte-anode stack was tabbed and sealed in a pouch cell was kept at rest at room temperature in an argon environment for 48 hours before taking measurements. The cell was then taken out of the argon-filled glove box and placed on a sample holder connected to a heating source. It was then held at a temperature of 90°C for 1.5 hours to ensure good electrical contact between the cathode, electrolyte, and anode layers. The cell was then charged to partially form S8, and then discharged at 90°C at a C/20 rate using a VMP3 Potentiostat (Bio-Logic). High temperature operation is necessary due to the limited conductivity of polymer electrolytes at low temperatures.43 Figure 1 shows a schematic of the assembled cell. The discharge and charge rate was calculated using the measured mass of the cathode electrode, the known weight percent of sulfur in the cathode, and assuming a theoretical capacity of 1672 mA-h/g for sulfur. The voltage window was kept between 1.5 V and 3.0 V.

Figure 1. Schematic of a Li-S cell used for operando XAS study.
X-ray absorption spectroscopy
XAS measurements were performed at beamline 4–3 of the Stanford Synchrotron Radiation Lightsource. Preliminary XAS experiments were performed at beamline 5.3.1 of the Advanced Light Source. Measurements were taken in fluorescence mode using a four element Vortex detector, with 0.1 eV energy resolution around the absorption K-edge. One scan took roughly 10 minutes to collect, equivalent to roughly 13.9 mA-h/g of capacity passed per scan. The beam spot size was 2 mm2 and was not moved during cycling. The cell holder was inside a helium-filled chamber during the in operando measurements. Calibration of the X-ray energy was performed using sodium thiosulfate (Sigma-Aldrich), setting the first peak maximum to 2472.02 eV.
XAS spectra analysis
All spectra were analyzed using the Athena X-ray absorption spectroscopy program. Raw XAS spectra were used to calculate the "total sulfur" intensity based on methods described by our previous work.42 For peak deconvolution and product analysis, all spectra were normalized and self-absorption corrected using the Athena XAS analysis package. The initial spectra were fitted with 4 Gaussian peaks and a step function. After 50 mAh/g the spectra were fitted with 6 Gaussians to account for the increasing skewness in the main-edge peak due to blueshift of the main-edge peak for mid-chain and short-chain polysulfides. Example of fitting an experimental spectra with 6 Gaussian peaks and a step function is shown in Figure S1.
Results and Discussion
Theoretical XAS spectra analysis
Theoretical XAS spectra for different lithium polysulfides were presented by Pascal et al. in a previous publication,44 and the results are summarized in Figure 2a. In the inset of Figure 2a, we show a typical molecular conformation of one of the polysulfides, Li2S8. Polysulfides with chain length between 3 and 8 have two charged terminal sulfurs and the remainder of the internal sulfurs are uncharged. The two kinds of sulfurs give rise to two distinctive XAS features: a pre-edge peak corresponding to the two charged end-chain sulfurs and a main-edge peak corresponding to the internal sulfurs. The area under the theoretical pre-edge peak of each polysulfide is denoted by AThp. Similarly the area under the theoretical main-edge peak of each polysulfide is denoted by AThm. The spectral features of the polysulfides are approximated as a sum of Gaussian peaks and the areas under selected peaks were used to compute AThp and AThm as outlined in Figure S2. In Figure 2b we plot the ratio, AThm/AThp, as a function of polysulfide chain length, x in Li2Sx (3 ≤ x ≤ 8). The line in Figure 2b is a least squares linear fit. We use this linear fit as a "calibration" to determine the average chain length of polysulfides in our cell, xavg, using measured values of pre-edge and main-edge areas, Ap and Am. The straight line in Figure 2b can be represented as
![Equation ([8])](https://content.cld.iop.org/journals/1945-7111/165/14/A3487/revision1/d0008.gif)
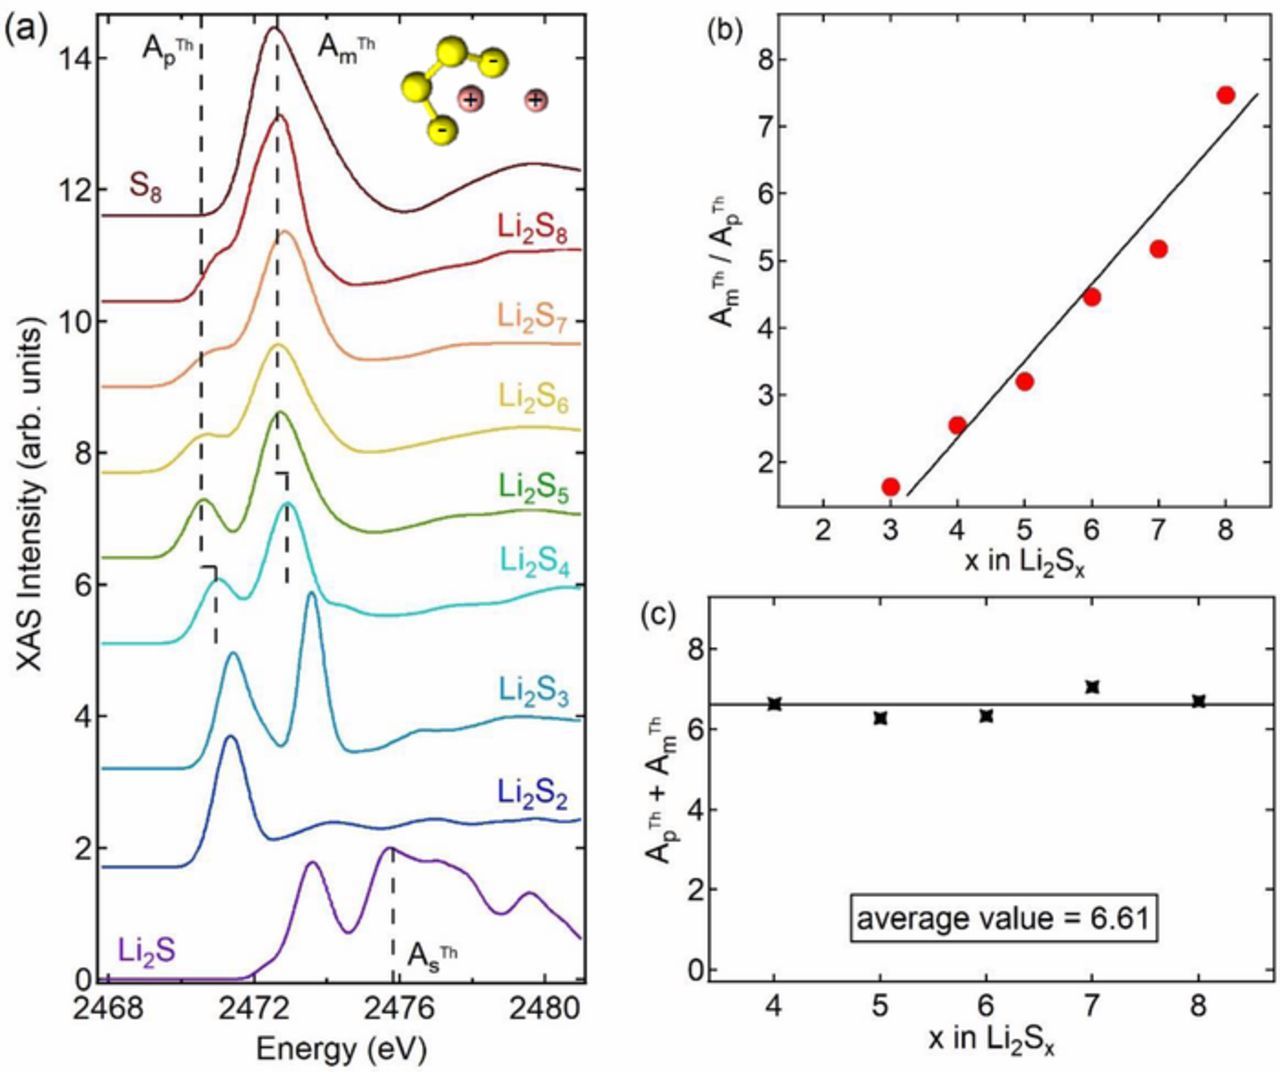
Figure 2. (a) Theoretical XAS spectra from Pascal et al.,44 (b) linear relationship between x for Li2Sx (3 ≤ x ≤ 8) and the area ratio of main-edge peak to pre-edge peak, Am/Ap, and (c) sum of pre-edge and main-edge peak areas per mole of Li2Sx (4 ≤ x ≤ 8) from theoretical spectra.
In Figure 2c we plot the sum, (AThp + AThm), as a function of x in Li2Sx (4 ≤ x ≤ 8). To a good approximation, (AThp + AThm) is 6.61, independent of x. The theoretical spectrum of Li2S contains a unique peak at 2476 eV that is not present in any of the polysulfides. The area under this peak, AThs, was calculated by approximating the theoretical Li2S spectrum by a sum of Gaussian peaks as shown in Figure S3. The value of AThs is 3.07.
Thus,
![Equation ([9])](https://content.cld.iop.org/journals/1945-7111/165/14/A3487/revision1/d0009.gif)
We use this to estimate the moles of Li2S. in our cell is determined by estimating the area under the peak at 2476 eV, As.
Total sulfur signal
The XAS cell was made with Li2S8 in the cathode. Our use of Li2S8 facilitated dispersion of the sulfur species in the cathode. Our main objective is to determine the state of the sulfur-containing cathode as the cell is discharged. We used a relatively thin cathode and adjusted the sulfur content in the cathode to ensure that all of the sulfur-containing species in the cell could be detected by XAS. The cell was prepared 48 hours before the XAS experiment, stored at room temperature in an argon glove box, placed in the XAS sample stage, heated to 90°C for 1.5 h, charged at C/20 until the voltage reached 3.0 V, and then discharged at C/20. Figure 3a shows all of the raw XAS spectra during these experiments. The magnitude of the high energy plateau attained between 2500 and 2575 eV is indicative of the total amount of sulfur detected. We define I0 to be the average value of the raw XAS signal between 2500 and 2575 eV obtained just prior to discharge. We define In as the average value of the raw XAS signal in the same energy range obtained during other scans. The time dependence of the cell potential during these experiments is shown in Figure 3b. The corresponding values of In/I0 versus time shows are shown in Figure 3c.

Figure 3. (a) All raw XAS spectra, (b) time dependence of voltage and (c) time dependence of In/I0 before and during cycling.
If our cell was perfectly designed, then In/I0 would be independent of time. In our case, In/I0 increased by about 12% during the heating step, and increased by about another 16% during the charging step. This is attributed to the dissolution of Li2S8 into the separator during the heating and charging steps. Because the anode side faces the incoming X-ray source, the incident intensity on the sulfur-containing species in the separator is higher than that on the sulfur-containing species in the cathode. Similarly, the fluorescence signal from the sulfur-containing species in the separator is more efficiently detected because the anode side also faces the detector. Thus, the diffusion of sulfur-containing species into the separator is expected to increase In/I0. During the discharge step, however, In/I0 remained approximately constant, varying between 1.05 and 0.95. The constancy of In/I0 during discharge indicates that all (or nearly all) of the products of sulfur reduction were detected by XAS experiment. We therefore conclude that there is no further change in the concentration of polysulfides in the separator during the discharge step.
Discharge products from spectra
The raw spectra shown in Figure 3a were normalized and corrected for self-absorption. All of the normalized spectra exhibited a pre-edge peak around 2471 eV and a main-edge peak around 2473 eV. This enables calculation of the areas under the pre-edge, Ap, and main-edge peak, Am. These areas can be used to determine the average polysulfide chain length in the cell, xavg,cell (x for Li2Sx), using Equation 8. After the heating step, xavg,cell equals 7.0. After the charging step, xavg,cell reached 8.1.
An ideal cell would be one wherein all of the Li2S8 remained in the cathode during storage prior to the XAS experiment and during the heating step. In other words, xavg,cell would equal 8.0 in the ideal cell after the heating step. It is evident that our cell is not ideal as xavg,cell is 7.0 at the end of the heating step. This departure from ideality is attributed to the dissolution of Li2S8 into the separator, subsequent reactions with the lithium metal anode, and shuttling of the resulting shorter polysulfides back into the cathode. We posit that during storage and the heating step, 0.29 moles of Li from the anode per mole of Li2S8 is consumed to reduce the average chain length from 8 to 7.0, as indicated in Equation 10.
![Equation ([10])](https://content.cld.iop.org/journals/1945-7111/165/14/A3487/revision1/d0010.gif)
The cell with xavg,cell = 7.0 was then charged at a C/20 rate. In an ideal cell, all of the sulfur-containing species would be converted to S8 after charging. If this were true, xavg,cell would equal infinity after the charging step. Instead we find that the average chain length increased from 7.0 to 8.1 during the charging step. During the charging step, 1.02 moles of electrons were delivered to the anode per mole of S8 in the cell (t = 1.27 h in Equation 7). If all of these electrons participated in the oxidation of Li2S7.0, then xavg,cell at the end of charging step would have been 14.2. The observed departure from ideality during the charging step is attributed to the reduction of polysulfide species at the anode/separator interface instead of complete conversion into Li metal. We conclude that these side reactions consume 0.73 moles of electrons per mole of S8. The remainder participated in the oxidation of Li2S7.0 and the concomitant reduction of Li+ to Li metal:
![Equation ([11])](https://content.cld.iop.org/journals/1945-7111/165/14/A3487/revision1/d0011.gif)
Figure 4a shows the self-absorption-corrected normalized spectra during discharge. Figure 4b shows the dependence of cell potential versus capacity, Q, during discharge. The XAS spectra in Figure 4a contain standard signatures of polysulfides: a main-edge peak with area Am and a pre-edge peak with area Ap. Using methods described above and Equation 8 we determined xavg,cell as a function of capacity, and the results are shown in Figure 4c. (The spectra do not contain signatures of polysulfide radicals that are sometimes observed in Li-S cells.34,37,45) The relatively low discharge capacity, 503 mAh/g, of our cell is due to non-idealities discussed above. During discharge, xavg,cell decreased monotonically from 8.1 to 3.0. In the early stage of discharge, Q < 100 mAh/g, xavg,cell decreases rapidly with increasing Q. In the late stage of discharge, Q > 100 mAh/g, xavg,cell decreases slowly with increasing Q.
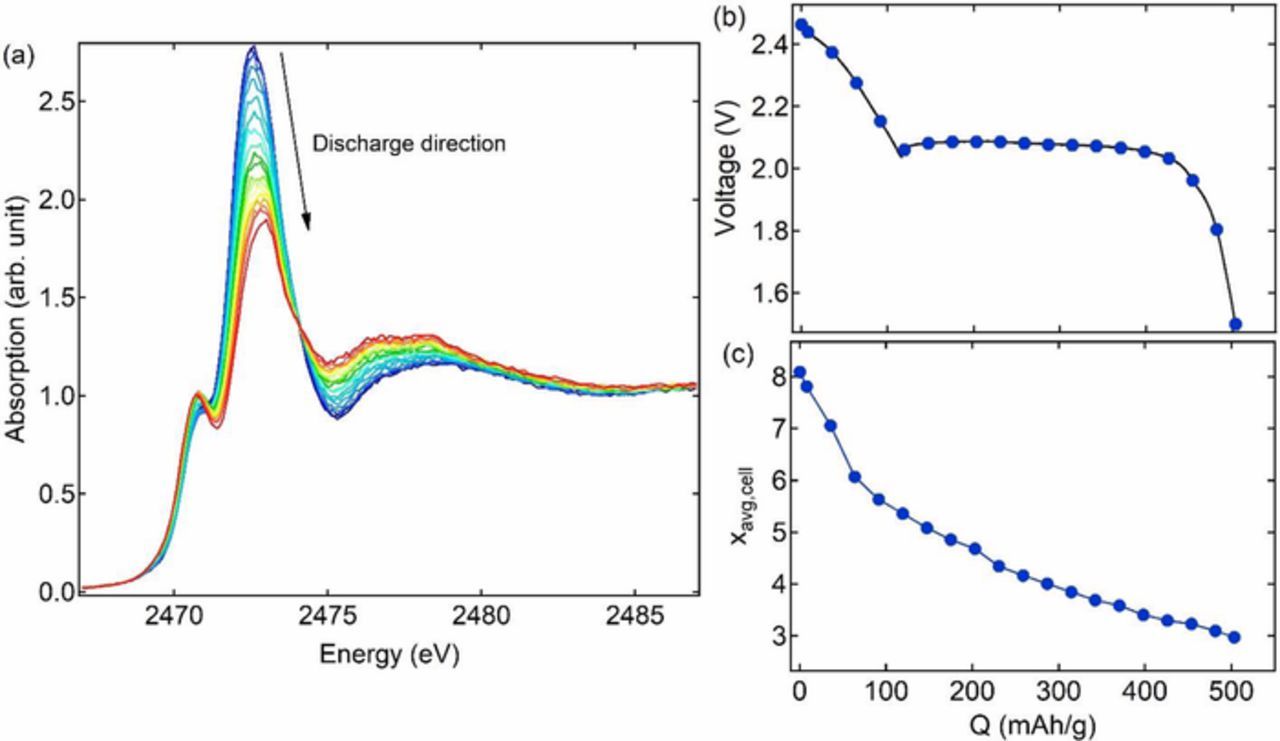
Figure 4. (a) Normalized and self-absorption corrected in operando XAS spectra and (b) voltage profile and average polysulfide chain length during discharge.
The measured XAS spectrum at the end of discharge is shown in Figure 5a. In addition to the pre-edge and main-edge peaks at 2471 eV and 2473 eV, an additional peak is observed at 2476 eV. The three dashed lines in Figure 5a correspond to the characteristic energies of these peaks. As discussed above, the theoretical spectra in Figure 2a show that the peak at 2476 eV is a unique signature of Li2S and it arises due to the crystalline nature of this compound.44 In addition to determining Ap and Am, we also determined As for each of the spectra shown in Figure 4a. We define  as the moles of Li2S formed per mole of polysulfides. In theory,
  is given by
![Equation ([12])](https://content.cld.iop.org/journals/1945-7111/165/14/A3487/revision1/d0012.gif)

Figure 5. (a). Illustration of peaks with areas Ap, Am, and As for a discharged spectrum, and (b) ratio of 2476 eV peak, As, to sum of peak areas for pre-edge and main-edge, Ap + Am, on the left axis and moles of Li2S formed per mole of polysulfides,  , on the right axis versus discharge capacity.
Where the constant 0.46 is based on analysis of the theoretical spectra and Equation 7. Note that in this analysis, Li2S is not considered as a polysulfide. In Figure 5b, we plot  on the left axis and
  , on the right axis versus Q. The moles of Li2S formed is low in the early stage of discharge, Q < 100 mAh/g, but increases rapidly in the late stage of discharge, Q > 100mAh/g. Whether or not Li2S forms in the early stage of discharge remains an interesting, open question. We suspect that the values we have obtained are due to limitations of our spectral fitting procedure. In our cell,
  remains small reaching a maximum value of 0.24 at the end of discharge. Note that the theoretical spectrum of Li2S contains a feature at 2474 eV. In principal, we should correct the measured values of Am to account for the fact that some of the signal at the main-edge peak is due to Li2S. This correction is small because
  remains small in our experiment.
Relating average discharge products to ne
The dependence of xavg,cell on ne during discharge is shown in the inset in Figure 6. We have assumed that all of the electrons delivered to the cathode are consumed by the Li2S8 molecules; side-reactions such as the formation of the solid electrolyte interphase (SEI) are ignored. The curve in the inset represents the theoretical predication, Equation 2. The theoretical value of ne corresponds to a cathode that contains pure S8 at the beginning of discharge (see Equation 1). In the experiments however, our cathode to a good approximation contains Li2S8 at the beginning of discharge. The data points in the inset in Figure 6 represent experimental values of xavg,cell and ne. xavg,cell was obtained from measurements of Ap and Am using Equation 8. To account for the fact that the discharge begins with Li2S8, we set ne to a value close to 2 at the beginning of discharge and it is incremented based on Equation 7. The actual value used was 1.97 to obtain a perfect match between the experimental data and the theoretical prediction at the beginning of discharge. It is evident that the decrease in the average chain length of sulfur-containing species in the cell is in reasonable agreement with Equation 2.

Figure 6. Theoretical and experimental average chain length of sulfur-containing species in the cathode, xavg,cell and in the cell xavg,cell, vs number of electrons delivered per S8 molecule, ne.
Our analysis above indicates that some of the Li2S8 molecules located in the cathode when the cell was made diffuses into the separator and reacted with Li metal. This results in an average composition of Li2S7.0 before charging. The polysulfides in the separator not in contact with electronically conducting materials cannot participate in charge or discharge reactions. Their presence also affects our ability to detect the nature of the sulfur-containing species inside the cathode. We posit that these effects are responsible for the deviations between theory and experiment in the inset of Figure 6. We define xavg,cathode as the average length of sulfur-containing species in the cathode. We assume that the average length of the sulfur-containing species in the separator is fixed at 7.0 during the discharge process. Our cell thus contains two layers with different concentrations of sulfur. Given the agreement seeing in the inset of Figure 6, we conclude that most of the sulfur is in the cathode. Specifically, in our model, we assumed that 90% of the sulfur atoms are in the cathode and 10% of the sulfur atoms are in the separator. This enables calculations of the transmission coefficients of the two layers of our cell based on the known absorption coefficients of sulfur and the other elements in our cell. These calculations indicate that the transmission coefficient of the separator layer, Tsep = 0.623, while that of the cathode layer, Tcathode = 0.398. The distance between the two layers is set to 19 um based on the geometry of our cell. (We assume for simplicity that all of the sulfur-containing species are located in the middle of each layer.) The measured value of xavg,cell reflects the length of sulfur-containing species in both the cathode and separator (xavg,cathode, xavg,sep) with a weighting function that depends on the sulfur content and the transmission coefficient of each layer. This is quantified by Equation 13.
![Equation ([13])](https://content.cld.iop.org/journals/1945-7111/165/14/A3487/revision1/d0013.gif)
where Dcathode and Dsep reflect the weighting functions as shown in Equations 14 and 15.
![Equation ([14])](https://content.cld.iop.org/journals/1945-7111/165/14/A3487/revision1/d0014.gif)
![Equation ([15])](https://content.cld.iop.org/journals/1945-7111/165/14/A3487/revision1/d0015.gif)
Since xavg,sep = 7.0, we can calculate xavg,cathode corresponding to each value of xavg,cell. Figure 6 shows the dependence of xavg,cathode versus ne. The agreement between theory and experiment reflects the fact that the data are consistent with our assumption that 10% of the sulfur atoms are lost in the separator and hence not available for redox reductions. Our analysis indicates that xavg,cathode at the start of discharge is 8.28 while xavg,cathode at the end of discharge is 2.28 (see Figure 6).
The XAS peak at 2476 eV enables detection of Li2S. It is therefore helpful to distinguish between Li2S and other sulfur-containing species, namely polysulfides (Li2Sx, 2 ≤ x ≤ 8). We define xavg,PS as the average length of polysulfides. We calculate xavg,PS using the following equation:
![Equation ([16])](https://content.cld.iop.org/journals/1945-7111/165/14/A3487/revision1/d0016.gif)
We arrive at this equation based on the sulfur mole balance in the cathode. For each mole of polysulfides ( ) in the cathode we have
  moles of Li2S, and together these compounds gives
  moles of
  .
.
The final result of our analysis of the XAS data is given in Figure 7 where xavg,PS and  are plotted as a function of ne.

Figure 7. Average polysulfide chain length inside the cathode, xavg,PS, on the left axis, and molar ratio of Li2S to polysulfides,  , vs number of electrons delivered per S8 molecule, ne.
It is not possible to identify a particular pathway that is consistent with the data in Figure 7. We used the principal of parsimony to interpret these data. In particular we used a model presented in the introduction beginning with Equation 4 and ending with Equation 6. We define C8, C4, C2, C1 to be the molar concentrations of Li2S8, Li2S4, Li2S2, and Li2S, respectively, and assume that the reactions are limited by the concentrations of the sulfur-containing species. We expect this to be true at extremely low C rates. The simplest rate expressions for Reactions 4 through 6 are given below:
![Equation ([17])](https://content.cld.iop.org/journals/1945-7111/165/14/A3487/revision1/d0017.gif)
![Equation ([18])](https://content.cld.iop.org/journals/1945-7111/165/14/A3487/revision1/d0018.gif)
![Equation ([19])](https://content.cld.iop.org/journals/1945-7111/165/14/A3487/revision1/d0019.gif)
![Equation ([20])](https://content.cld.iop.org/journals/1945-7111/165/14/A3487/revision1/d0020.gif)
Since electrons are consumed in all three reactions,
![Equation ([21])](https://content.cld.iop.org/journals/1945-7111/165/14/A3487/revision1/d0021.gif)
The measured quantities, xavg,cathode, xavg,PS, and  , are related to the molar concentrations of the sulfur-containing species:
![Equation ([22])](https://content.cld.iop.org/journals/1945-7111/165/14/A3487/revision1/d0022.gif)
![Equation ([23])](https://content.cld.iop.org/journals/1945-7111/165/14/A3487/revision1/d0023.gif)
![Equation ([24])](https://content.cld.iop.org/journals/1945-7111/165/14/A3487/revision1/d0024.gif)
Equations 17 through 24 were integrated numerically for specific values of k1, k2, and k3., with initial conditions C8 = 1, C4 = C2 = C1 = 0. The solved C8, C4, C2, C1 at each t are used to predict xavg,cathode, xavg,PS,  , and ne at each t. The symbols in Figure 8 show the experimentally determined values of xavg,cathode, xavg,PS,
  , and ne, respectively, as a function of time, t. The experimental values of
  in Figure 8c were subtracted by a constant so that
  at t = 0 is zero. This subtraction is necessary as the spectral signal at any given energy is not identically zero even if the species is absent due to factors such as contributions from neighboring excitations and background subtraction inaccuracies. The curves in Figure 8 show results of the numerical integration for k1 = 0.368 h−1, k2 = 3/4 k1, and k3 = 1/6 k1. It is evident that the measurements are consistent with the proposed model. Our analysis indicates that the rate of reduction of sulfur-containing species decreases with decreasing chain length. To our knowledge, these are the first estimates of reaction rate constants for discharge reactions in the cathode of a Li-S cell.
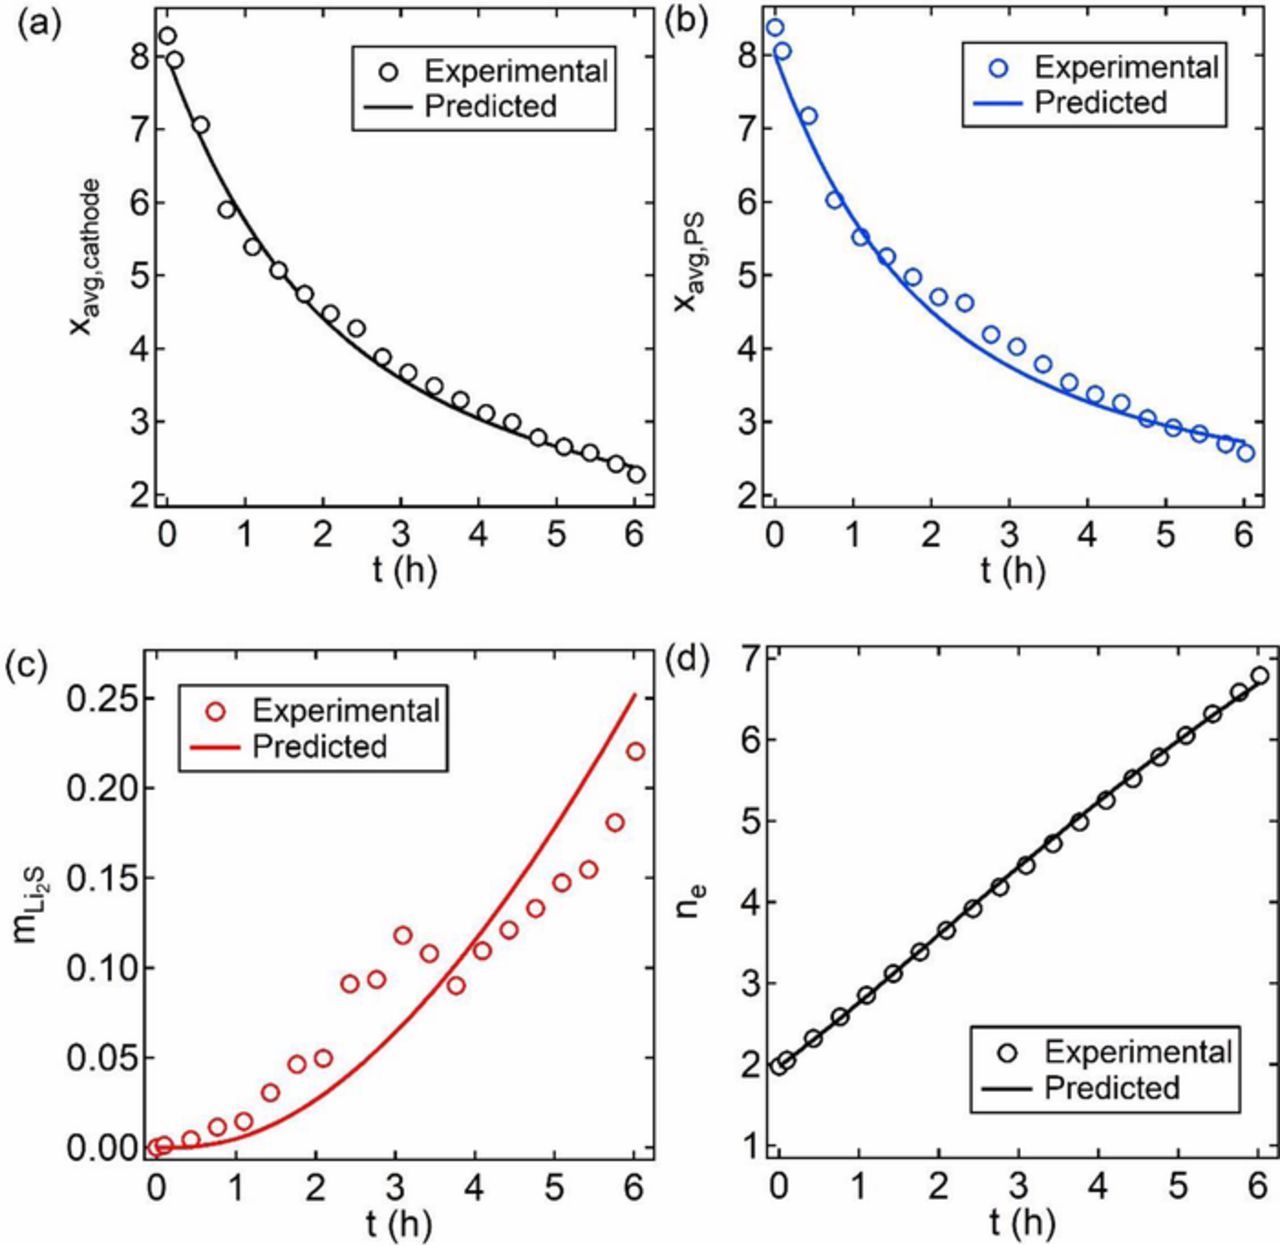
Figure 8. Comparing experimental measures and the predicted values of (a) xavg,cathode, (b) xavg,PS, (c)  , and (d) ne versus t, time in hours, using the three-reaction model fitted with k1 = 0.368 h−1, k2 = 3/4 k1, and k3 = 1/6 k1.
Figure 9 plots the predicted concentrations of Li2S8, Li2S4, Li2S2, and Li2S versus discharge capacity, based on our model, Equations 17–21.

Figure 9. Concentration profile of Li2S8, Li2S4, Li2S2, and Li2S predicted by model.
The results presented in Figures 8 and 9 represent the first step in quantifying the rates of reactions that occur in a sulfur cathode. Our simple discharge reaction models is also consistent with the reaction mechanism proposed by Hagen et al.24 Most other studies suggest that the reduction of sulfur in the cathode during discharge is likely to follow more complex schemes. For example, Barchasz et al.21 have proposed the following reaction for the reduction of Li2S4:
![Equation ([25])](https://content.cld.iop.org/journals/1945-7111/165/14/A3487/revision1/d0025.gif)
Such reactions require concerted action on several reactant molecules. In the example above, three Li2S4 molecules must react with two Li+ and two e− to yield the stated product. In contrast, the proposed reaction for Li2S4 (Equation 5) only involves one reactant molecule. The additional complication with Equation 25 is the fact that the reaction must involve many steps wherein the Li2S4 molecules are cleaved and then recombine to give four Li2S3 molecules. For these reasons, Equation 5 is more likely to proceed than Equation 25.
The reaction rates that we present are only applicable to the regime 0 ≤ Q ≤ 500 mAh/g (the discharge range covered by our experiments). It is likely that these rates will change as Li2S becomes the dominant species in the cathode. The shorter-chain polysulfides such as Li2S2 are insoluble46–48 and thus their concentration near reaction sites in the cathode may be significantly different from the bulk concentration. In addition to electrochemical reactions, polysulfides can interconvert through chemical reactions. Sophisticated models that include transport are needed to account for complications arising from polysulfide dissolution and concomitant shuttling effects. Further work is needed to explore the effects.
The subject of reaction mechanisms in sulfur cathode is of considerable current interest.21,27,51–57,28,31,32,35,38,42,49,50 Our detection of Li2S at the very early stage of discharge (as seen in Figure 8c) is consistent with the findings of Waluś et al.,20,58 Cuisinier et al.,33 and Conder et al.52 Similarly, the formation and subsequent consumption of Li2S4 up to 500 mAh/g of discharge in Figure 9 is similar to the findings of Dominko et al.,36 Zhang et al.55 and Zheng et al.51 Our results in Figure 9 also indicated a significant amount of Li2S2 inside the cathode at a depth of discharge of 500 mAh/g, which is consistent with the results of Kawase et al.54 Reaction mechanisms in the sulfur cathode have also been studied using computational simulations by Burgos et al.59 They found that a variety of radical and dianion species were formed in their simulation cell. However, S82− dianions were formed at the early stage of discharge, S42− dianions dominated the intermediate stage of discharge, and S42− dianions dominated the late stage of discharge at low applied current density. Our experimental findings and approach are consistent with these results.
Conclusions
In this work, we presented an operando XAS study of a solid-state Li-S cell. The use of a block copolymer electrolyte enabled the construction of an all solid-state Li-S cell that could readily be probed by XAS. Li2S8 was used as the active material inside the cathode instead of S8 to facilitate dispersion of the sulfur-containing species in the electrode. The main objective of the operando XAS experiment was to study the discharge process. By using a thin cathode with relatively low sulfur content, we demonstrated that the XAS signal reflected all of the sulfur-containing species located throughout the depth of the cell. The average chain-length of sulfur-containing species, xavg,cell, was determined from the ratio of the areas under the main-edge and pre-edge XAS peaks located at 2473 and 2471 eV. The measured values of xavg,cell at a given depth of discharge was in excellent agreement with predictions based on the number of electrons delivered to the cell as measured by the potentiostat. In addition, the production of Li2S as a function of depth of discharge was monitored by tracking the area under a unique XAS peak located at 2476 eV. The XAS measurements were used to estimate rate constants of discharge reactions presented in the introduction (Equations 4–6 where we introduced rate constants k1, k2 and k3). While the overall rate of reaction in the cathode is controlled by the current density used to discharge the cell, the relative rate constants, k2/k1 and k3/k1, depend on the electronic structures of the polysulfides participating in the reactions. To our knowledge, this work presents the first estimate of relative rate constants for discharge reactions in Li-S cells.
It is well established that the rate at which Li-S cells can be charged and discharged is compromised by dissolution of polysulfides and the insulating nature of the reactants and products. In addition to these factors, the relative reaction rates may present fundamental limitations on the practical power density of Li-S batteries. The present study is only a step toward understanding these limitations.
Acknowledgments
This work was supported by the Assistant Secretary for Energy Efficiency and Renewable Energy, Office of Vehicle Technologies of the US Department of Energy under Contract DE-AC02-05CH11231 under the Battery Materials Research program. Use of the Stanford Synchrotron Radiation Lightsource, SLAC National Accelerator Laboratory, is supported by the U. S. Department of Energy, Office of Science, Office of Basic Energy Sciences under Contract No. DEAC02-76SF00515. We thank Mike Toney for helpful discussions, and for helping us get access to the XAS instrument at SLAC. The Advanced Light Source is supported by the Director, Office of Science, Office of Basic Energy Sciences, of the U. S. Department of Energy under Contract No. DE-AC02-05CH11231.
ORCID
Deep B. Shah 0000-0001-7816-031X
Nitash P. Balsara 0000-0002-0106-5565