Abstract
Understanding the factors limiting Li+ charge transfer kinetics in Li-ion batteries is essential in improving the rate performance, especially at lower temperatures. The Li+ charge transfer process involved in the lithium intercalation of graphite anode includes the step of de-solvation of the solvated Li+ in the liquid electrolyte and the step of transport of Li+ in the preformed solid electrolyte interphase (SEI) on electrodes until the Li+ accepts an electron at the electrode and becomes a Li in the electrode. Whether the de-solvation process or the Li+ transport through the SEI is a limiting step depends on the nature of the interphases at the electrode and electrolyte interfaces. Several examples involving the electrode materials such as graphite, lithium titanate (LTO), lithium iron phosphate (LFP), lithium nickel cobalt aluminum oxide (NCA) and solid Li+ conductor such as lithium lanthanum titanate or Li-Al-Ti-phosphate are reviewed and discussed to clarify the conditions at which either the de-solvation or the transport of Li+ in SEI is dominating and how the electrolyte components affect the activation energy of Li+ charge transfer kinetics. How the electrolyte additives impact the Li+ charge transfer kinetics at both the anode and the cathode has been examined at the same time in 3-electrode full cells. The resulting impact on Li+ charge transfer resistance, Rct, and activation energy, Ea, at both electrodes are reported and discussed.
Export citation and abstract BibTeX RIS

This is an open access article distributed under the terms of the Creative Commons Attribution 4.0 License (CC BY, http://creativecommons.org/licenses/by/4.0/), which permits unrestricted reuse of the work in any medium, provided the original work is properly cited.
To improve the power performance of Li-ion batteries, it is important to understand the factors that limit the Li+ charge transfer kinetics. Li-ion batteries comprised of a graphite anode and a lithium cobalt oxide cathode in an electrolyte consisting of 1 M LiPF6 in ethylene carbonate (EC)-dimethyl carbonate (DMC)-diethyl carbonate (DEC) carbonate solvent mixture could not deliver their room temperature capacity at a rate of C/2 at −30 and −40°C.1 When DEC was replaced by a linear ester solvent, such as ethyl acetate (EA) or methyl butyrate (MB), the Li-ion batteries at −30 and −40°C could deliver over 80% of their room temperature capacity at the same rate.2 When the LiPF6 salt is replaced by lithium bis(oxalato)borate (LiBOB) in EC-ethyl methyl carbonate (EMC) (1:1 wt ratio) carbonate solvent mixture, the impedance of the graphite-electrolyte interface measured using graphite/Li half cells in the electrolyte with LiBOB is three times that in the electrolyte with LiPF6.3 These examples illustrate that the electrolyte components play crucial roles in affecting Li+ charge transfer kinetics in Li-ion batteries.
The Li+ charge transfer process starts from the solvated Li+ in the electrolyte to the reception of an electron (e−) from the electrode and becomes Li (i.e., LixC in graphitic anodes). This involves the de-solvation step of Li+ before entering into a layer of solid electrolyte interphases, or SEI, that is often referred to that on the anode such as carbonaceous materials, and the diffusion step of Li+ through the SEI, which is pre-formed on the electrode at the electrode and electrolyte interfaces, before receiving an e− from the electrode at the electrode and SEI interface. Abe et al.4–6 believe that the Li+ de-solvation process is the rate limiting step, which is supported by the results from the investigation of the electrolytes of different solvent systems using LiClO4 salt at highly oriented pyrolytic graphite (HOPG), Li4Ti5O12 and Li+ solid conductors interfaces. The question is whether the de-solvation as a limiting step can be extended to the cathode-electrolyte interface. Jow et al.7 examined the Li+ charge transfer kinetics at the graphite anode-electrolyte interface and LiFePO4 (LFP) cathode-electrolyte interface at the same time in a full cell, Gr/LFP, using Li as a reference electrode in 1 M LiPF6 in EC-DMC-MB with vinylene carbonate (VC) as an additive. It is found that the activation energy (Ea) at the graphite-electrolyte is about 67 kJ mol−1, which is much higher than 33 kJ mol−1 found at the LFP-electrolyte interface. It is concluded that the electrodes and their associated electrode-electrolyte interfacial layer as SEI is controlling the Li+ charge transfer kinetics.
Smart et al.8 studied the effect of additives on the performance of MCMB/LiNixCo1−xO2 Li-ion cells. It was determined that the discharge capacity at −40°C can be improved by the addition of additives such as VC and LiBOB. As additives change the characteristics of the SEI (but presumably do not significantly impact the bulk electrolyte properties), it is concluded that the SEI plays a crucial role in the Li-ion cell performance. The impact of additives such as VC, LiBOB, and lithium bis(fluorosulfonyl)imide (LiFSI), etc. on the impedance of the anode-electrolyte and the cathode-electrolyte interfaces in Gr/LiNiCoAlO2 cylindrical cells in 1.0 M LiPF6 in EC-EMC-methyl propionate (MP) (20:20:60 vol %) at low temperatures was studied by Jones et al.9 It was found that the additives impact the impedance at the anode differently from that at the cathode. Different electrolyte components, including additives, result in different reduction and oxidation reactions during cell formation and cycling at the anode and cathode10 and therefore, different SEIs.
Both the de-solvation step and the transport of Li+ in SEI are important steps in controlling the rate. The question of which is the dominant one is an interesting one to answer. This paper will first review how we define the charge transfer process and how the charge transfer resistance is measured. This paper intends to provide a review of the Li+ charge transfer process in Li-ion batteries, when the de-solvation step is dominant and when the diffusion of Li+ in SEI is dominant, followed by a discussion on possible reasons behind them and a conclusion.
Li+ Charge Transfer Process
The Li+ charge transfer process is defined as the process of turning a solvated Li+ in the electrolyte into Li in the electrode by accepting an electron from the electrode. At the graphite anode, during charge, as shown in Fig. 1a, the Li+ charge transfer process is made of the following three steps ignoring the transport of the solvated Li+ in the electrolyte before reaching at the SEI and electrolyte interface. This is reasonable as the electrolytic conduction of 1 M LiPF6 in EC: EMC (30:70 vol.%) varied from 1.1 mS cm−1 at −40°C to 9.6 mS cm−1 at 25°C with an activation energy of Li+ conduction of only 22 kJ mol−1 or less.11,12
- (1)Li+⋅(solv.)n → Li+, (De-solvation of Li+ at the SEI/electrolyte interface)
- (2)Li+ → Li+, (Li+ transport through anode SEI towards anode)
- (3)x Li+ + x e− + C6 → LixC6. (Li+ charge transfer: Li+ reaching the anode and accepting an electron at the anode-SEI interface or at the anode-electronic conductor/SEI interface. The electron is supplied through the external circuit during charge.)
The kinetics of the Li+ transport in the SEI is determined by the nature of SEI, which is made of mixtures of inorganic and organic Li+ conductors.13

Figure 1. (a) A schematic view of the Li+ charge transfer process during charge. (b) A schematic view of the Li+ charge transfer process during discharge.
At the cathode, there is a Li de-intercalation process resulting in a solvated Li+ in the electrolyte, which is described in the following steps.
- (1)LiCoO2 → x Li+ + x e− + Li1-xCoO2, (Li de-intercalation, dissolution, from LiCoO2 to become Li+ and e−)
- (2)Li+ → Li+, (Li+ transport through cathode/electrolyte interphases, CEI)
- (3)Li+ → Li+⋅(solv.)n (Li+ solvation in electrolyte)
During discharge as shown in Fig. 1b, the Li+ charge transfer process that involves the Li+ de-solvation step from the solvated Li+ in the electrolyte is occurring at the cathode and the Li de-intercalation step, LixC6 → x Li+ + x e− + C6, is occurring at the anode.
Step 3, in which the Li+ accepts an electron and becomes Li intercalated graphite, is considered a fast step. Step 4, the de-intercalation kinetics at the electrode and electrolyte interface, is also considered fast. The subsequent diffusion of Li in the electrode bulk active material is often the slower and rate limiting step in the battery charge discharge processes at normal ambient temperatures. Although the diffusion of Li within the active cathode or anode material is not our main focus, it is worth of our understanding as it links to the Li+ charge transfer kinetics at the electrode and electrolyte interface closely. The relative facility of each of these steps changes as a function of temperature, so the rate limiting step may change at different temperatures. For example, studies by Wang et al.,14 involving the low temperature characterization of graphite and MCMB coke anodes, have shown that the stage transformation resistance, or diffusion in the bulk electrode, is rate determining at 25°C, whereas the SEI resistance is rate limiting at −30°C. As described, the researchers reported over a 27-fold increase in the SEI resistance from 25°C to −30°C, which was the primary cause for the high polarization observed at low temperature. Smart et al.15 have previously reported that cells consisting of MCMB anodes and LiNiCoO2 cathodes with various electrolytes display poorer cathode kinetics compared to the anode. However, at temperatures below −30°C the lithium intercalation kinetics at the MCMB appear to become performance limiting, illustrating that the kinetics change at different temperatures for the different electrodes. Others have also reported MCMB anodes to be performance limiting at temperatures < −20°C compared to the LiCoO2 cathodes.16 These studies illustrate that broad conclusions of which electrode is rate determining over a wide range of temperatures may not be valid. Nonetheless, the diffusion of Li in the electrode changes with temperature and can be dominating in certain systems depending on temperature.
Therefore, the investigation on whether the de-solvation step, step 1, and the diffusion of Li+ across the SEI and CEI, steps 2 and 5, respectively, occurring at the electrode/electrolyte interfaces are possible rate limiting steps will be our main focus. How do we characterize the charge transfer kinetics? How do we determine which step is rate limiting?
Electrochemical Charge Transfer Resistance
The resistance resulting from the charge transfer process is denoted as Rct, which results from contributions from both the de-solvation step and the diffusion in the SEI step. The Rct follows the relationship based on the thermally activated process,17
![Equation ([1])](https://content.cld.iop.org/journals/1945-7111/165/2/A361/revision1/d0001.gif)
where Ao, Ea, R and T are a frequency factor, the activation energy, the gas constant and the temperature in Kelvin, respectively. The Ea of the Li+ charge transfer process, or the lithium-ion kinetics, represents the barrier that the Li+ needs to overcome to cross the interface between the electrolyte and the electrode. The value of Ea can be obtained from the slope of a log(1/Rct) versus the inverse of temperature (1/T) plot.
Electrochemical impedance spectroscopy (EIS) measurements18 can be used to characterize the resistance of different processes occurring in an electrochemical cell through the fitting of the impedance spectra, Nyquist plots, to an equivalent circuit.
Which step is rate limiting appears to depend on the cell components that are used in the formation of interfaces or interphases, including the electrode and electrolyte type selections. The cell interfaces that can potentially lead to the de-solvation process being a rate limiting step is to be considered first, and then the conditions under which the Li transport in SEI as a rate limiting step will be discussed.
De-Solvation of Solvated Li+ as a Rate Limiting Step
Abe et al.4 reported the study of the activation energy of the Li+ charge transfer process across the HOPG electrode and electrolyte interface. When the HOPG electrode is held at 0.4 V or lower vs. Li/Li+ in 1 M LiClO4 in EC:DEC electrolyte, there is a SEI formed on HOPG and the solvated Li+ needs to de-solvate to diffuse through SEI and reach the electrode before accepting an electron. When the HOPG is held at 1.1 V in 1 M LiCF3SO3 in 1,2-dimethoxyethane (DME) electrolyte, there is no SEI formed on HOPG, and the solvated Li+ can intercalate into graphite directly. The Ea for this process, which involves no de-solvation, is only 25 kJ mol−1. This is much lower than an Ea of 53 to 59 kJ mol−1 for the prior process, which involves de-solvation because of the existence of the SEI. It is therefore concluded that the rate limiting step is de-solvation. Further studies support this conclusion. Two of them are briefly reviewed below.
Li+ charge transfer at the interface between solid-state ceramic electrolyte and liquid electrolyte
The study of the solid-state (SS) electrolyte and liquid electrolyte interface was first reported by Abe et al.6 This study uses a four-Li electrode cell as shown in Fig. 2,6 in which the SS electrolyte disk is in the center and in contact with the liquid electrolyte only. Two Li electrodes on each side of the SS electrolyte with one being the reference electrode and other one being the counter electrode are designed. This design allows the measurement of Li+ de-solvation and solvation into and out of the SS electrolyte without encountering other complications. The SS electrolytes used in this study are crystalline lithium lanthanum titanate, Li0.35La0.55TiO3 (LLT),19,20 and Li-Al-Ti-phosphate (Li1+xAlxTi2-x(PO4)3) based glass electrolyte (Ohara glass).21 The activation energy of Li+ charge transfer at the interfaces of the Ohara glass and the liquid electrolytes including 1 M LiCF3SO3 in dimethyl sulfoxide (DMSO), propylene carbonate (PC), and mono-fluoroethylene carbonate (FEC) are 69.9, 57.3 and 31.5 kJ mol−1, respectively, based on the charge transfer resistance obtained from the EIS measurements, which are consistent with the DFT calculated reaction enthalpy, ΔH, values of −235.5, −217.1, and −190.3 kJ mol−1, respectively. The ΔH is defined as H (Li+ - solvent) – [H(solvent) + H (Li+)]. The de-solvation step as a rate limiting step is clearly demonstrated in this interface. These results suggest that the higher reaction enthalpy energy of solvent or the higher solvation ability of the solvent with Li+ leads to higher activation energy for de-solvation.

Figure 2. Experimental set up for the measurement of the Rct between the solid-state ionic conductor such as LLT or glass electrolyte and liquid electrolyte such as 1 mol dm−3 of LiCF3SO3 in PC, DMSO or FEC (reproduced with permission by Electrochemical Society, Inc. from Ref. 6).
Li+ charge transfer at the interface between Li4Ti5O12 (LTO) and liquid electrolyte
The study of the Li+ charge transfer at the lithium titanate, Li4Ti5O12 (LTO), and liquid electrolyte interface was recently reported by Ishihara et al.5 The liquid electrolytes studied include 1 M LiClO4 in PC, EC:DMC (1:1 v/o) and DMC, respectively. The charge transfer resistance was measured at 1.56 V vs. Li/Li+, at which potential LTO has the highest redox capacity and the lowest charge transfer resistance. The Eas for the Li+ charge transfer at the interfaces between LTO and the above electrolytes are 64, 54 and 37 kJ mol−1, respectively. Similarly, the Ea values are consistent with the solvent reaction enthalpies of PC, EC and DMC with Li+, which are −217.1, −210, and −190 kJ mol−1, respectively.
In the above two examples, there are not traditional SEI layers present at the interfaces between the ceramic Li+ conductor and the liquid electrolyte and between LTO and the liquid electrolytes. Yet, in both cases the activation energy correlates well with the solvation ability of the solvent to Li+.
Li+ Transport in the SEI as a Rate Limiting Step
In Li-ion batteries, the SEI formed between the graphite anode and the electrolyte allows the repeated charge/discharge operation of the batteries achieving long cycle life with little loss of capacity. The charge and discharge rates achievable are increasingly limited with decreasing temperature. A study of low temperature impedance of Li-ion batteries indicates that the impedance of the cell is dominated by the charge transfer resistance, Rct.22 The Rct includes mainly the resistance for the de-solvation step and the diffusion of Li+ in SEI. The de-solvation (and solvation) step should occur at both the anode and the cathode before a Li+ can intercalate into the electrodes. If the de-solvation process was the rate limiting step, it should be reasonable to expect the Ea at both the anode and cathode should be similar. If they are different, the roles of the SEI and CEI need to be considered. Three studies that are used as examples to clarify which step is the rate limiting step in Li-ion batteries are presented below.
Differentiating Li+ charge transfer at graphite/electrolyte and LiFePO4/electrolyte interfaces in a full cell
Jow et al.7 studied the Li+ charge transfer kinetics at both the graphite anode/electrolyte interface and the cathode/electrolyte interface at the same time using a full cell, graphite (Gr) as an anode and LiFePO4 (LFP) as a cathode, with Li as a reference electrode in the cell containing an electrolyte consisting of 1 M LiPF6 in EC-DMC-MB with VC as an additive. It was observed that the activation energy (Ea) at the graphite-electrolyte is about 67 kJ mol−1, which is much higher than the 33 kJ mol−1 found at the LFP-electrolyte interface.
The large difference in Ea cannot be explained by the de-solvation process, since the electrolyte is the same in the cell. The difference could be attributed to the fact that the interphase formed on the graphite anode (SEI), resulting from the reduction of the electrolyte, is different from the interphase formed on the LFP electrode, or the cathode-electrolyte interphases (CEI), generally resulting from being in contact with organic-based electrolyte (i.e., such as decomposition products being formed at high potential or involving species formed at the anode).23–25 In the case of the LFP electrode, the surface film is expected to be much less significant compared to the anode, primarily due to the low operating potential which limits the onset of electrolyte oxidation.26 It is possible that the different compositions of SEI and CEI on the electrodes can lead to different energies for the de-solvation process. It is reasonable to assume that, even if the solvation energy is affected by the different SEI and CEI interphases, the cause for large Ea difference should still be attributed to the different SEI and CEI associated with their respective electrodes. Therefore, it is concluded that the electrodes and their associated electrode-electrolyte interfacial layers, SEI or CEI, is controlling the Li+ charge transfer kinetics.
Impact of additives on Li+ charge transfer kinetics on both anode and cathode
Jones et al.9 investigated the impact of electrolyte compositions on the charge discharge behavior of Li-ion cells consisting of LiNi0.80Co0.15Al0.05O2 (NCA) cathodes and graphite anodes with Tonen separator (polyethylene) in a baseline electrolyte of 1.0 M LiPF6 in EC:EMC:MP (20:20:60 vol. ratio), where MP is methyl propionate. The test cells are in a spiral wound configuration with a capacity of about 105 mAh incorporating a Li reference electrode allowing the monitoring the charge transfer resistance at the anode and the cathode at the same time. The schematics of the cell construction are shown in Fig. 3. By introducing different additives, it is reasonable to expect that the nature of the SEI and CEI formed during formation resulting from the reduction on the anode and oxidation on the cathode with the electrolyte would vary from one additive to the other. However, the bulk electrolyte in the cells should remain relatively constant, since the additives are introduced in low concentration. The additives with their concentrations selected for this study include lithium bis(oxalato)borate (LiBOB) in 0.1 M concentration, vinylene carbonate (VC) in 2 wt %, 1,3-propanesultone (PS) in 2%, lithium difluoro(oxalato)borate (LiDFOB) in 0.1 M, and lithium bis(fluorosulfonyl)imide (LiFSI) in 0.1 M. The structures of these additives are shown in Fig. 4.

Figure 3. Schematics of a spirally wound full cell with a Li metal reference electrode placed between the anode and the cathode for monitoring the charge transfer resistance at both electrodes at the same time.

Figure 4. Additives studied in this example.
The impedance of the cells at the temperatures of 23, −20, −30, −40°C are measured at the cell voltage set at 4.07 V, at which the potential of the graphite anode is of about 0.090 to 0.105 V vs. Li/Li+ and the potential of the NCA cathode is about 4.179 V vs. Li/Li+. The impedance, including that at the anode and that at the cathode, for the baseline electrolyte with and without these additives have been measured. The impedance of both the graphite anode and the NCA cathode at 23°C are shown as Nyquist plots in Figures 5a and 5b, respectively. The Rcts at this temperature judging from the diameter of the semicircle are quite small at both the anode and cathode, with the values at the anode being about three times larger than that at the cathode. The straight lines after the semicircle shown Fig. 5 suggest that a diffusion limited process most likely occurring in the electrodes is limiting the rate performance of the cell.

Figure 5. (a) Nyquist plots of the impedance of the graphite anode in Gr/NCA cell in the electrolytes with and without various additives at 23°C. (b). Nyquist plots of the impedance of the NCA cathode in Gr/NCA cell in the electrolytes with and without various additives at 23°C.
The impedance of both the graphite anode and the NCA cathode at −30°C are shown as Nyquist plots in Figures 6a and 6b, respectively. At this temperature, the cell resistance is dominated by the resistance at the graphite anode. Fig. 6a shows that the electrolytes with LiDFOB and LiFSI produce the SEI layers with resistance similar to the baseline electrolyte, while the other additives, VC, LiBOB, and PS, produce more resistive SEIs on the graphite anode. Fig. 6b shows that the electrolytes with VC, LiBOB, LiDFOB, and PS additives produce less resistive CEIs than the baseline electrolyte on the NCA cathode.

Figure 6. (a) Nyquist plots of the impedance of the graphite anode in Gr/NCA cell in the electrolytes with and without various additives at −30°C. (b) Nyquist plots of the impedance of the NCA cathode in Gr/NCA cell in the electrolytes with and without various additives at −30°C.
The equivalent circuit as shown in Fig. 7 is used to analyze the charge transfer resistance, Rct, which is equivalent to R2 as shown in the figure. The activation energy, Ea, of the Li+ charge transfer process at the anode and at the cathode, can be determined from the slopes of the log (1/Rct) vs. 1000/T plots as shown in Figs. 8a and 8b. These plots all display a good linear relationship. The room temperature Rct values at the cathode in the electrolytes with VC and LiDFOB are not shown, as the numbers are too small to be accurate. However, the estimated values would fall within the linear relationship with the values at lower temperatures. These Ea values at both graphite anode and NCA cathode are summarized in Table I.

Figure 7. Equivalent circuit used to match the impedance spectra.
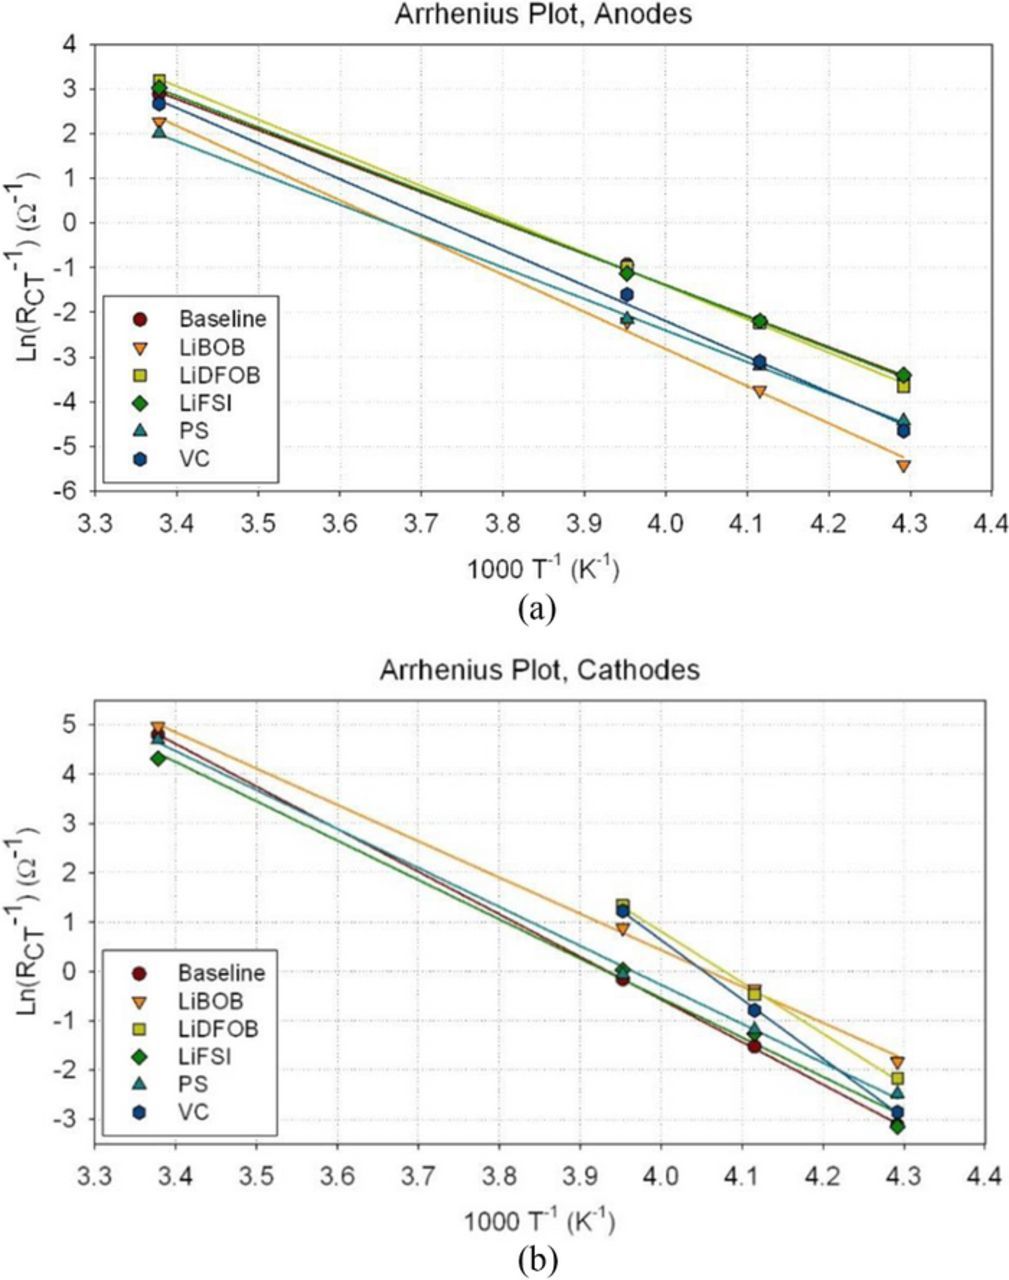
Figure 8. (a) Log (1/Rct) vs. 1000/T°K plots for the graphite anode for the Gr/NCA cells containing baseline electrolytes with and without additives. (b) Log (1/Rct) vs. 1000/T°K plots for the NCA cathode for the cells containing baseline electrolytes with and without additives.
Table I. Activation energy of Li+ charge transfer at the graphite anode/electrolyte interface and the NCA cathode/electrolyte interface.
| Ea, kJ mol−1 | ||
|---|---|---|
| Electrolyte | At Graphite Anode | At NCA Cathode |
| Baseline | 57.7 | 71.8 |
| + 2% VC | 66.1 | 100.0 |
| + 0.1 M LiBOB | 69.1 | 61.2 |
| + 0.1 M LiDFOB | 61.9 | 85.9 |
| + 2% PS | 58.7 | 65.7 |
| + 0.1 M LiFSI | 58.7 | 66.4 |
Baseline electrolyte: 1 M LiPF6 in EC:EMC:MP (20:20:60 v/o).
The effects of LiFSI and LiBOB additives on Rct and Ea are especially noteworthy. The addition of LiFSI in the baseline electrolyte results in lower Rct at the graphite anode than that in the baseline electrolyte and an Ea similar to that of the baseline electrolyte. It also results in lower Rct at the cathode than that in electrolyte without FSI and, at the same time, slightly lower Ea for Li+ charge transfer at the cathode. The addition of LiBOB results in a lower Rct and Ea on the NCA cathode than that in the baseline electrolyte. However, the presence of LiBOB results in higher Rct and Ea on the graphite anode compared to the baseline electrolyte. Different additives lead to different reduction and oxidation reactions at the anode and the cathode and, therefore, different SEI and CEI, respectively.10 The bulk electrolyte compositions remain about the same. Therefore, we conclude that the SEI is the rate limiting step in the Li-ion batteries.
Li+ charge transfer between HOPG and 1 M LiClO4 in DMC electrolyte
Yamada et al.27 studied the Li+ charge transfer kinetics at the interface between graphite electrodes and liquid electrolytes at 0.2 V vs. Li/Li+. One interesting part of this study is the investigation of the Li+ charge transfer between HOPG and 1 M LiClO4 in DMC electrolyte across interfaces or SEIs that are pre-formed in different electrolytes. The Eas for two such preformed SEI are different and are summarized in the Table II below.
Table II. Ea for Li+ charge transfer at the interface between HOPG, which has different preformed SEI, and the electrolyte of 1 M LiClO4 in DMC.27
| Electrode/SEI/Electrolyte Systems | |||
|---|---|---|---|
| Electrode | SEI preformed in | Electrolyte | Ea, kJ mol−1 |
| HOPG at 0.2 V vs. Li/Li+ | 1 M LiClO4 in EC:DMC (1:1 v/o) | 1 M LiClO4 in DMC | 40 |
| 1 M LiClO4 in EC:DMC (1:1 v/o) + 3 w/o PFS* | 52 | ||
The SEI on HOPG varies with the electrolyte compositions including solvents, salts, and additives that undergo reduction reactions for forming the SEI. The cyclic voltammogram (CV) of HOPG in 1 M LiClO4 in EC:DMC (1:1) + 3 w/o PFS indicates reduction reactions starting from about 2.0 V to 1.3 V vs. Li/Li+ while the CV of HOPG in 1 M LiClO4 in EC:DMC (1:1) shows no reduction reactions until the voltage decreases to less than 0.7 V vs. Li/Li+.27 This suggests that a more robust SEI is formed from the reduction of PFS, which could contain Li fluorinated compounds, than that formed in the electrolyte without PFS. With the same electrolyte but different SEIs on HOPG, this demonstrates that SEI dominate the Li+ charge transfer kinetics.
Discussion
At the interfaces between SS ceramic electrolyte, LLT or Ohara glass, and liquid electrolyte and between the LTO and liquid electrolyte interface, the Ea for Li+ charge transfer correlates well with the ability of these solvents binding the Li+.6,5 At the SS electrolyte and the liquid electrolyte interface, we can consider that the SS electrolyte is equivalent to a SEI as in Li-ion batteries. In this case, LLT or Ohara glass is not a rate limiting factor. Considering both LLT and Ohara glass are fast Li+ conductors, with high Li+ conductivity of around 1.0 × 10⁻³ S cm−1 and an activation energy of around 33 kJ mol−1,19–21 it is reasonable that the rate limiting step is dominated by de-solvation in these systems. At the interface between the LTO and liquid electrolyte at 1.5 V vs. Li/Li+, there is no electrolyte reduction reaction and therefore no SEI is formed on LTO at 1.5 V vs. Li/Li+ in LiClO4 in EC:EMC electrolyte.5 Furthermore, LTO is a good Li+ conductor near 1.5 V vs. Li/Li+, where LTO shows the highest Li+ redox reactions. Li+ conduction in LTO has been studied and shown an Ea of around 27 kJ mol−1 using electrochemical methods28 or varying between 0.30–0.48 eV for the spinel phase Li4Ti5O12 and between 0.20–0.51 eV in the lithiated rock salt phase Li7Ti5O12 using first principle calculations.29 With no SEI and fast Li+ conduction in LTO, the Li+ de-solvation process is a rate limiting step at the LTO and electrolyte interface.
The studies of Li+ charge transfer at Gr/electrolyte interface and at the LFP/electrolyte interface in a Gr / electrolyte / LFP full cell in the same electrolyte shows a large difference in Ea between the two interfaces.7 This large difference is attributed to the difference in the nature of the SEI and CEI on the graphite anode and LFP cathode, respectively. It is worth noting that the Ea for Li+ charge transfer across the LFP/electrolyte interface is 33 kJ mol−1, which is very similar to that for the electrochemical FePO4 to LiFePO4 phase transformation, which is found to be about 30 kJ mol−1.30–32 This number is derived from using the Avrami-Johnson-Mehl-Eroofev equation.30–32 A recent study by Johannes et al.33 on hole polaron formation and migration in olivine phosphate materials using DFT method is also worth noting as a reference. It is found that the polaron migration barrier in LFP, which is closely linked to the Li+ conduction kinetics, is 0.20 eV or 19.3 kJ mol−1. This number is lower than the activation energy for the electrochemical FePO4 to LiFePO4 transformation. It could suggest that there is a CEI on LFP at the voltage less than 3.6 V, even if it is insignificant, that can affect the charge transfer kinetics.
The additives in the electrolyte impact not only anode, but also cathode, Li+ charge transfer kinetics in Li-ion cells, such as Gr / electrolyte / NCA cell studies,9 where the reduction and oxidation reactions of the electrolytes varied with the selection of additives. This agrees with the Li+ charge transfer kinetics studies of HOPG in 1 M LiClO4 in DMC electrolyte, in which HOPG has a different preformed SEI. In summary, all components in the electrolyte such as salt, e.g. LiClO4 vs. LiPF6, solvent, e.g. carbonate vs. ester, additive, e.g. LiFSI vs. VC, can change the nature of SEI and CEI, and therefore influence the Li+ charge transfer kinetics.10,34 Table III summarizes the impact of salt, solvent and additive on the activation energy of Li+ charge transfer at the graphite anode using limited examples for illustration only.
Table III. Activation energy of Li+ charge transfer at the graphite electrode with electrolytes with different salts, solvents and additives.
| Electrode @ Potential vs. Li/Li+ | Electrolyte | Ea, kJ mol−1 |
|---|---|---|
| HOPG @ 0.2 V | 1 M LiClO4 in EC:DMC (1:1 v/o) | 55a |
| Graphite @ 0.1 V | 1 M LiPF6 in EC:EMC (30:70 w/o) | 68b |
| Graphite @ 0.1 V | 1 M LiPF6 in EC:EMC:MP | 57 |
| Graphite @ 0.1 V | 1 M LiPF6 in EC:EMC:MPc + VC (2 wt%) | 66 |
| Graphite @ 0.1 V | 1 M LiPF6 in EC:EMC:MPc + LiFSI (0.1 M) | 58 |
Recent computational studies of the de-solvation kinetics and the transport properties of the SEI are worth mentioning as references for the above experimental studies.36,37 Molecular Dynamics simulations were performed to evaluate the de-solvation energy of an electrolyte consisting of 1 M LiPF6 / EC:DMC (3:7 mole ratio) in contact with a SEI made of Li2EDC, (CH2OCO2−/Li+)2, or Li2BDC, key SEI components.36 The many-body polarizable APPLE&P force field was used in the simulations. Ea, the activation energies, for the Li+ solvation−de-solvation reactions are 0.42−0.46 eV (40–44 kJ mol−1) for the SEI−electrolyte system. Ea for the Li+ diffusion in bulk Li2EDC is 0.64 eV (62 kJ mol−1).37 The activation energy for the lithium diffusion in the other common SEI compound Li2CO3 for the combined process of the formation the Li+ defect and Li+ hopping was estimated to be around 0.7 eV (67.5 kJ mol−1) at low voltages close to lithium metal potential, indicating that many common SEI components have similar activation energy.38 However, it should be noted that the SEI in Li-ion batteries is more complicated than that assumed in the simulation. The computational results in general agree with what have been observed.
Conclusions
As mentioned previously in the section of Li+ Charge Transfer Process14–16 and a recent study on LiNi1/3Co1/3Mn1/3O2 by Kasnatscheew et al.,39 the lithium migration through the solid bulk active electrode materials may be rate limiting in some systems under certain conditions, especially at warmer temperatures. In the context of the above results and discussion, Li+ charge transfer kinetics is mostly dominated by the SEI in Li-ion batteries. In the case when the SEI is very conductive and of low activation energy for Li+ conduction, such as LLT and Ohara glass, the Li+ charge transfer kinetics is dominated by the de-solvation process. In the case when there is no SEI or CEI, or insignificant SEI/CEI, such as with the LTO/electrolyte interface or LFP/electrolyte interface, the Li+ charge transfer kinetics is dominated by de-solvation or by the Li transport in the electrode.
When the additive is introduced in the electrolyte, the redox chemistries on the electrodes are modified resulting in different SEI and CEI from the original. Using full cells, such as Gr / 1 M LiPF6 in EC:EMC:MP / NCA with a Li reference electrode, allows one to examine the full impact of additives on the Li+ charge transfer kinetics at both the anode and the cathode at the same time. In this work, we found that the LiBOB additive leads to a reduced Rct and Ea at the NCA cathode, but results in much increased Rct and Ea at the graphite anode. The LiFSI additive amongst those studied in this work provides the best overall benefits in terms of Li+ charge transfer kinetic improvement.
Acknowledgment
Some work described here was carried out at the Jet Propulsion Laboratory, California Institute of Technology, under contract with the National Aeronautics and Space Administration (NASA) and supported by the NASA Planetary Sciences Division (PSD). The authors also wish to thank Oleg Borodin of the U.S. Army Research Laboratory for helpful discussion.
ORCID
T. Richard Jow 0000-0003-1615-8593