
Abstract
The pit stability product of 316L stainless steel (SS) under a salt film was examined by experimental techniques, analytical methods, and numerical modeling. Both analytical and numerical results suggested that electromigration had a measurable contribution to the dissolution current during stable pit growth under a salt film, preventing the use of the 1D Fick's law of diffusion to obtain the pit stability product under such conditions. Moreover, the numerical results indicated that migration contributed to almost ⅔ of the mass transport limiting current. Although the diffusion coefficient of metal cations decreased with an increasing concentration inside the pit, it could be replaced by a constant diffusion coefficient, defined as an equivalent diffusion coefficient. When the complexation reaction was cconsidered, the modeling results agreed with the experimental data, indicating that a 4.2 M FeCl2 could be used as a simplified pit-like electrolyte to estimate the pit stability product under a salt film for 316L SS.
Export citation and abstract BibTeX RIS

This is an open access article distributed under the terms of the Creative Commons Attribution 4.0 License (CC BY, http://creativecommons.org/licenses/by/4.0/), which permits unrestricted reuse of the work in any medium, provided the original work is properly cited.
List of symbols
| ci | Concentration of species i (mol m−3) |
| ci,bulk | Concentration of species i in bulk solution (mol m−3) |
| Di | Diffusion coefficient of species i (m2 s−1) |
| Ni | Molar flux of species i (mol m2 s−1) |
| Ri | Reaction rate of species i (mol (m3 s)−1 |
| zi | Charge number of species i |
| n | Number of charges transferred in the oxidation reaction |
| R | Universal gas constant 8.314 (J (K mol)−1) |
| T | Temperature (K) |
| F | Faraday's constant 96485 (C mol−1) |
| E | Electrode potential (V) |
| EFe | Equilibrium potential of oxidation reaction (V) |
| ba | Tafel slope of the oxidation reaction (mV dec−1) |
| i0 | Exchange current density (A cm−2) |
| i | Dissolution current density (A cm−2) |
| x | Pit depth (m) |

| Forward reaction constant (the unit is related to hydrolysis reaction) |

| Backward reaction constant (the unit is related to hydrolysis reaction) |
| K | Equilibrium constant |
| M | Molar weight (kg mol−1) |
| h | Salt film thickness (m) |
| n | Normal vector |
| v | Moving velocity vector (m s−1) |
| σ | Electrolyte conductivity (S m−1) |
| Φ | Electrolyte potential (V) |
| ui | Mobility of species i (m2 (V s)−1) |
| ρ | Density (kg m−3) |
| Ψ | Potential drop across salt film (V) |
| Ψ0 | Electric field across salt film (V m−1) |
Stable pit propagation requires maintaining a sufficiently aggressive solution at the pit base, which results from competitive metal dissolution and diffusion of metal cations out of the pit cavity, as first considered by Galvele. 1–5 In Galvele's work, the competition of these two processes in one-dimensional (1D) pit growth was mathematically solved at steady flux conditions. Galvele plotted the solution to the various differential equations as the concentration inside the pit versus the product of the pit dissolution current density and pit depth, later defined as pit stability product (x·i). 6 Once the pit stability product is lower than a critical value, the aggressive acidic solution at the pit interface would get diluted, resulting in pit repassivation. 1,4,5
In the past several decades, the critical pit stability product and critical solution chemistry during stable pit propagation under a salt film have been the focus of many researchers. 7–15 In this regard, numerous experimental and mass transport modeling works focused on one-dimensional (1D) pit propagation to estimate the pit stability product. 8,9,16–21 The most common mass transport method is based on 1D Fick's law of diffusion. For example, Tester et al. used 1D Fick's law of diffusion to calculate the time evolution of the dissolution current density during potentiostatic polarization using a 1D pit setup. 18 The authors pointed out that migration in the pit solution could be ignored in the mass transport model because almost all the potential drop inside the pit occurred across the salt film. Gaudet et al. suggested that the effects of a variable diffusion coefficient and electromigration tended to counter each other. 16 The authors argued that the constant diffusion coefficient values used in their models agreed with those in dilute solutions. However, they used different diffusion coefficient values to fit the flux data, which could render the diffusion modeling unreliable and requires further clarifications.
Many researchers later adopted Gaudet et al.'s concept. 7–9,14,21–24 In their studies, the pit stability product under a salt film was estimated using 1D Fick's law of diffusion exclusively, assuming a constant diffusion coefficient. In a recent work by Nguyen and Newman, the authors incorporated electromigration in the mass transport equations, capable of predicting the critical parameters for pit stability with different bulk NaCl solutions. 25 However, there are no mass transport models to calculate the pit stability product under a salt film that incorporate the effects of diffusion, electromigration, and viscosity, which govern the physics of ion transport processes inside the pit.
Available 1D pit models assume a certain pit depth and calculate the required dissolution current density or concentration profile based on the saturation concentration at the respective depth. There have been no attempts to develop transition models that can be used to track the continuous pit interface movement and salt film deposition. Therefore, in this paper, the role of electromigration and a variable diffusion coefficient in the estimation of the pit stability product were investigated. The work combines a well-accepted analytical method with a newly developed mathematical framework capable of tracking pit growth and salt film deposition. Additionally, the use of a FeCl2 solution as a simplified 316L SS pit electrolyte for pit stability product estimations is discussed.
Experimental
A "sandwich" like 1D pit electrode was built using 316L SS wire (Tokusen Kogyo Co., Ltd, Japan) with a 49.5 μm diameter. The composition of the wire is shown in Table I. Details on the preparation of the electrode can be found in our previous work. 26
Table I. Composition (wt%) of the Type 316L SS wire used throughout this work.
| C | Si | Mn | P | S | Ni | Cr | Mo | Fe |
|---|---|---|---|---|---|---|---|---|
| 0.019 | 0.520 | 0.820 | 0.028 | 0.000 | 12.500 | 17.400 | 2.030 | Bal. |
Figure 1 shows a schematic diagram of the setup. Electrochemical measurements were carried out with a Gamry Reference 600 potentiostat in a test cell containing unbuffered 0.6 M NaCl (pH = 6.3), prepared with analytical grade reagents and deionized (DI) water with a resistivity of 18.2 MΩ·cm. The solution was left open to air during the experiments. The 1D electrode was used as the working electrode (WE), and a graphite rod served as the counter electrode (CE). An Ag/AgCl (sat. KCl) electrode (SSC) was used as the reference electrode (RE) immersed in the solution via a Luggin capillary to minimize IR drop. The 1D pit electrode was placed upwards in the test cell. The temperature of the test solution was maintained at 25 °C with a water bath. The temperature fluctuation inside the test cell was kept within 0.1 °C.

Figure 1. Schematic diagram of the electrochemical test setup.
Download figure:
Standard image High-resolution imageBefore the experiments, the exposed surface was ground down to 600 grit SiC paper successively, followed by ultrasonic cleaning in DI water for 5 min. The 1D electrode was first cathodically polarized at −1.30 VSSC for 5 min to remove the surface oxide film. Subsequently, an anodic potential of +1.30 VSSC was applied to initiate the pit. The potential was decreased to +0.80 VSSC to allow pit propagation. The potential was finally decreased to +0.45 VSSC and +0.3 VSSC successively to grow the pit to the desired depth. More details of the experimental method can be found elsewhere. 26 The pit was re-passivated by a downward polarization at 100 mV s−1 to prevent continuous pit growth once the required depth was reached. The limiting current density data was extracted from the last 5 s of the potentiostatic hold at +0.3 VSSC. The average limiting current densities were then plotted as a function of the reciprocal of the pit depth.
The actual pit depth was measured after the experiments using a light optical microscope (LOM) and a white-light interferometer (Alicona InfiniteFocus), as is shown in Figure 2. Figure 2a illustrates the two steps involved in a pit depth measurement. The image from the top glass slide to the metal wire surface was obtained using the extended depth of focus (EDF) function in the first step. The d1 value is the distance between the edge of the top glass slide and the pit interface (Figure 2b). The second step involved is to measure the height difference between the edge of the first glass layer and the pit mouth, denoted as d2 (Figure 2c).

Figure 2. Schematic diagram showing the measurement of the actual pit depth after the experiments (a). The first step is to measure the depth with the light optical microscope (LOM) from the edge of the first layer of glass slide to the pit interface (b). The second step is to measure the height difference between the edge of the first glass layer and the pit mouth (c).
Download figure:
Standard image High-resolution imageModel Development
Figure 3 shows the schematic representation of the 1D pit concept and geometry. A Finite Element Method (FEM, COMSOL Multiphysics 5.5) was applied to solve the time-dependent equations. The following assumptions were made:
- (1)Dilute solution theory is applicable.
- (2)The convection in the pit can be neglected.
- (3)A salt film precipitates at the dissolving metal interface when the metal cation concentration reaches the saturation value, which does not influence the electrochemical reactions occurring on the metal surface and the mass transport inside the pit.
- (4)Both salt film precipitation and dissolution occur at the dissolving metal interface. The mass transport process through the salt film is not considered.
- (5)FeCl2 is used as the simplified pit solution; the saturation concentration at 25 °C is 4.2 M. Kuo and Landolt determined the saturation concentration of ferrous ions at the metal surface to be 4.2 M based on measurements of the limiting current density. 29 Later, Newman et al. used 4.2 M FeCl2 as a simplification for the saturated pit solution for 304SS. 16 Recently, Srinivasan et al. have also used 4.2 M FeCl2 as the simplified pit solution for the pit stability product estimation of 316L SS. 10
- (6)Super-saturation is not considered since it is a transient condition.

Figure 3. Schematic diagram of the one-dimensional pit concept (a) and geometry (b) used in the modeling.
Download figure:
Standard image High-resolution imageMass transfer equations
The pit cavity includes the following four species: Na+, Cl−, Fe2+, FeCl+ (named as components 1–4, respectively). Then, the Nernst-Planck equation is given as:

where ci, Ni and Ri are the concentration, molar flux and reaction rate of species i, respectively.
The molar flux of species i is defined as,

where, Di , zi and ui are the diffusion coefficient, charge number and mobility of species i, respectively; F is Faraday's constant; Φ is the electrolyte potential.
The mobility, ui, is given by the Nernst-Einstein equation.

where, R is the universal gas constant; T is the temperature in K unit.
Besides considering mass transfer due to diffusion and electro-migration, the electro-neutrality condition is taken into account to ensure a zero net charge at any local point in the pit solution.

The potential distribution was assumed to be governed by, 30

where,

Jun et al., and Srinivasan et al. have demonstrated the importance of solution viscosity on diffusivity, indicating that the diffusion coefficient would decrease with an increase in pit depth.
8,19,31
Thus, it was necessary to consider a variable diffusion coefficient due to the concentration gradient inside the pit. The diffusion coefficients of Cl−, Na+, Fe2+ and FeCl+ in FeCl2 solutions of different concentrations-obtained with OLI Studio 10.0-are plotted versus chloride concentration, as is shown in Figure 4. The influence of the bulk NaCl concentration (0.6 M NaCl) on  is also shown in Figure 4, as indicated by the arrows. The results showed that the function representing the change in
  with Cl− can be used to estimate the diffusion coefficient inside the pit.

Figure 4. Diffusion coefficients of Cl−, Na+, Fe2+, FeCl+ as a function of chloride concentration that approximately reflect the concentrated pit solution.
Download figure:
Standard image High-resolution imageElectrochemical reaction
The anodic reaction is given by:

The dissolution current density, i, is estimated as

where, E is the electrode potential at the pit base, EFe and i0 are the equilibrium potential and exchange current density of the oxidation reaction, respectively. In the saturated pit solution, the equilibrium potential was independent of pit depth. The equilibrium potential of the iron oxidation reaction was estimated based on the Nernst equation with a ferrous concentration of 4.2 M. 27 Although the exchange current density (0.25 A m−2) was chosen arbitrarily, it did not influence the estimation of the pit stability product if the saturation concentration could be maintained at the pit base.
Salt film precipitation
A salt film precipitates at the dissolving metal interface when the concentration of metal cations reaches the saturation value, and it can accommodate the extra IR drop to main the metal cation at the saturation point at the pit interface. 14,24,32 The oxidation reaction combined with the salt film deposition was needed to maintain the surface concentration at the saturation point. Due to the uncertainty in defining the precipitation kinetics constant, dissolution kinetics constant, as well as the initial value of the salt film thickness, the dissolution of the salt film was also introduced in our model, increasing its robustness. The salt film would dissolve only when the concentration was lower than the saturation concentration and the salt film thickness was higher than zero.
As indicated by Rayment et al., FeCl2·4H2O was found to be the main composition of the salt film formed on 316L SS. 33 In a recent work by Li et al., they found that the co-precipitated salt film formed on 304SS one-dimensional pit interface contained both Fe2+ and Ni2+. 34 In this work, the salt film was assumed to be FeCl2 to simplify the simulation. The reaction order of Fe2+ and Cl− was assumed to be one. Thus, the net precipitation rate of the salt film can be expressed as:

with

where, h is the thickness of the salt film,  and
and  are the precipitation kinetics constant and dissolution kinetics constant, respectively.
Here,  are step functions, and presented as:


The Fe2+ and Cl− consumption rates at the salt film interface can be expressed as:


The thickness of salt film can be calculated by the integral of precipitation rate with time.

The salt film is assumed to have a high electric field, which remains unchanged with variations in the salt film thickness. 14,24,32,34 The potential across the salt film is calculated by:

where ψ0 is the electrical field across the salt film, the value of which is assumed to be 2.1 kV cm−1 in this work. 28
Thus, the electrode potential at the pit base is obtained as:

The solution IR drop is not considered in this model, because solution IR drop will not influence the estimation of the pit stability product once the saturation concentration can be maintained at the pit interface.
Complexation reaction
The equilibrium constant of the Fe2+complexation reaction is approximately five orders of magnitudes higher than the equilibrium constant of the hydrolysis reaction 35 ; therefore Fe2+ is more likely to react with Cl− instead of hydrolyzing to generate H+. The hydrolysis reaction was not considered for pit stability product estimations. The homogeneous complexation reaction considered in the present model is:

Where  and
and  are the forward and reverse kinetics constants, respectively, which are related to the equilibrium constant,

Then, the consumption rates of Fe2+, Cl−, and FeCl+ are,


Boundary conditions
The electrolyte potential and applied potential at the pit mouth have a value of 0 VSSC and +0.30 VSSC, respectively.
At the pit surface, the diffusion flux of Fe2+ equals its production rate involved in the electrochemical reaction, which could be calculated based on Faraday's law,

For other species that are not involved in electrochemical reactions the boundary condition at the pit surface is:

The concentration of species at the pit mouth is assumed to be equal to the bulk solution:

Moving interface
The computational geometry was realigned timely with the new position of the pit base via an arbitrary Lagrangian-Eulerian (ALE) method continuously to track pit propagation, which allows moving boundaries without movement of the mesh. 35,36 If the mesh displacement becomes large and the mesh quality degrades during the calculation, the computational domain would be re-meshed, and all solution variables would be mapped from the old mesh to the new one. For the pit base, the normal component of the pit growth rate can be calculated by the following equation:

Lastly, the artificial boundaries are considered to have zero displacements.
Initial conditions
A linear concentration gradient was applied inside the pit as the initial condition. The pit depth and the salt film thickness were taken as 100 and 0.6 μm, respectively. A time step Δ t = 10 s was selected for the time-dependent mass transport equations because the stable condition inside the pit was obtained after 10 s. Table II presents the parameters used in the calculations.
Table II. Parameters used in the model.
| Parameter | Value | Unit | Source |
|---|---|---|---|
| EFe | −0.45 | VSSC | Ref. 27 |
| Eapp | 0.30 | VSSC | Experiment |
| iFe,0 | 0.25 | A m−2 | Chosen arbitrarily |
| ba | 0.12 | V dec−1 | Ref. 7 |

| 10−8 | m3 (mol s−1)−1 | Chosen arbitrarily |

| 0.1 | mol (m−3 s−1) | Chosen arbitrarily |
| ψ0 | 2.1 | kV cm−1 | Ref. 28 |

| 104 | 1 s−1 | Chosen arbitrarily |
| K | 4 × 10⁻⁶ | m3 mol−1 | OLI Studio |

| 0.1988 | kg mol−1 | OLI Studio |

| 1930 | kg m−3 | OLI Studio |
| M | 0.5574 | kg mol−1 | Ref. 7 |
| ρ | 8030 | kg m−3 | Ref. 7 |
Results and Discussion
Experimental results
Figure 5 shows the current density versus time plot during pit growth until a depth of around 1 mm. It was found that the current density reached the maximum value quickly after pit initiation, followed by a gradual decay of the current density. When the potential decreased from +0.80 to +0.45 VSSC and further to +0.30 VSSC, the amplitude of the current density remained stable, indicating that the pit propagation was under mass transport control.

Figure 5. Variation of the current density with time until the pit depth reaching 1 mm.
Download figure:
Standard image High-resolution imageFigure 6 shows the limiting current density (ilim ) under a salt film versus the reciprocal of the pit depth (1/d). A linear relationship was observed, the slope of which yielded the pit stability product (x·i), which was 1.00 A m−1 under a salt film and in the range of the results documented in the literature (i.e., 0.8 to 1.1 A m−17,9,10 ). The linear function indicated that the pit growth was under mass transport control. 7,9,16 In this regard, a constant pit stability product corresponds to a negligible boundary layer thickness, 7,9,16 validating the assumption that the concentration at the pit mouth was equal to the bulk solution concentration. However, although the 1D Fick's law of diffusion is commonly used to estimate the pit stability product under a salt film, 7–9,14,16,18,21–24 it is still unclear whether the pit growth was under pure diffusion control, which is addressed in the following sections.

Figure 6. Variation of the mass transport limiting current density as a function of the inverse of the pit depth obtained for 316L SS in 0.6 M NaCl at 25 °C. The pit stability product under a salt film was extracted by curve fitting.
Download figure:
Standard image High-resolution imageAnalytical results without complexation reactions
The pit stability product can be solved analytically when the hydrolysis and complexation reactions inside the pit are ignored. During the pit growth, the following equation can be used to calculate the dissolution current density: 1
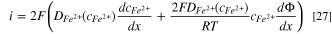
where i is the dissolution current density, x is the pit depth;  is the diffusion coefficient of ferrous ions, which is assumed to be a function of the ferrous concentration;
  is the electrical field inside the pit.
Once a stable condition is reached, it is reasonable to assume that the net Cl− and Na+ flux is zero, 1 thus,


where,  and
and  are the diffusion coefficient of chloride and sodium ions respectively, which are the functions of concentration;
  and
and  are the chloride and sodium ion concentrations, respectively.
Then, the electric field or potential gradient inside the pit can be obtained from Eq. 28 as:

By taking into account the following boundary conditions for x = 0 ( and
and  ), the concentration of chloride and sodium ions can be obtained by integrating Eqs. 28 and 29, respectively, as:


where c0 is the concentration of chloride and sodium ions in the bulk solution.
Electroneutrality is considered inside the pit, thus:

By solving Eqs. 31–33, the concentration of chloride ions inside the pit is obtained:

Then, by replacing Eq. 30 into Eq. 27, the dissolution current density can be obtained as:

The  in Eq. 35 can be replaced by Eq. 34. Thus,
According to Eq. 34,  thus,
thus,

By substituting  back to Eq. 37, then the dissolution current density is obtained:
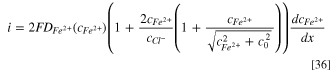
The concentration of  is taken as zero at the pit mouth. Integrating Eq. 38 yields,
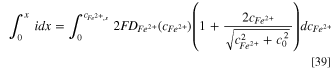
Based on the mean value theorem for definite integrals, 37 the pit stability product (x·i) is obtained as:

with the equivalent diffusion coefficient, Deq , defined as:

where,  is the saturation concentration of Fe2+
at the pit interface.
is the saturation concentration of Fe2+
at the pit interface.
The analytical solution showed that the pit stability product (x·i) remained constant even when the variable diffusion coefficient and migration were included. Additionally, the variable diffusion coefficient can be replaced by Deq during pit growth, which is independent of pit depth. Although it is known that Deq should lie between the values of dilute and saturated solutions, it is not possible to obtain an accurate value analytically when migration is taken into account. Thus, based on the diffusion coefficient values used in this study (Figure 4), it was found that:

The pit stability product in Eq. 40 is similar to that presented in a recent publication by Nguyen and Newman. 25 Unlike Nguyen and Newman, our model considered variable diffusion coefficients to account for viscosity effects on diffusivity. These variable diffusion coefficients were taken into consideration in mass transport equations, which was not attempted in Ref. 25. The constant diffusion coefficient used by Nguyen and Newman was defined as the equivalent diffusion coefficient (Deq ) in Eq. 41. Admittedly, using a constant diffusivity value would yield the same solution to Eq. 40. However, our work went beyond a mathematical simplification and provided a physical meaning to the constant diffusion coefficient (i.e., Deq ), as explained above.
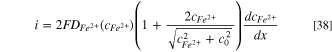
When migration is not considered in the mass transport process, the dissolution current density, inm , can be calculated as:

Based on the mean value theorem for definite integrals, 37

Where the equivalent diffusion coefficient without migration,  is
is

In contrast to the previous case,  can have an analytical solution and should lie between the values of dilute and saturated solutions as well.
Based on the diffusion coefficient values used in this study (Figure 4), it was found that:

If the pit stability product was evaluated with 1D Fick's law of diffusion,  should be at least 10.12 × 10⁻¹⁰ m2 s−1 to reach the lowest (x·i) value in Eq. 42, i.e., where migration is taken into consideration. When FeCl2 was used as the simplified pit solution, if the 1D Fick's law of diffusion was applied to fit the pit stability product obtained experimentally (Figure 6), a value of
  = 12.23 × 10⁻¹⁰ m2 s−1 was obtained. Even when a high saturation concentration is considered, i.e., [Fe2+] = 5.02 M, for the saturated pit solution and 2.18 is used for charge transfer number, the estimated
  needs to be 9.40 × 10⁻¹⁰ m2 s−1 to reach the pit stability product. These values are higher than those in an infinitely dilute solution (i.e., 7.1 × 10⁻¹⁰ m2 s−1), suggesting that 1D Fick's law of diffusion is not an adequate fit to estimate the pit stability product and will result in the overestimation of the diffusion coefficient and saturation concentration. The analytical solutions shown in Eqs. 40 and 44 indicated that migration could not be ignored during the pit growth and the estimation of pit stability products. Therefore, the pit growth under a salt film is not purely diffusion-controlled, and migration effects should be considered.
Numerical results without complexation reaction
The complexation reaction of ferrous ions with Cl− was ignored in this part to validate the analytical results. It is thus necessary to first discuss the reliability of the proposed model. An extensive body of work documents the dependence of IR drop inside the pit and salt film thickness on pit depth. 7,14,17,20,32 In this regard, the IR drop inside the pit was found to be independent of pit depth, 7,14,17,20 whereas the salt film thickness should increase with pit depth. 32
The IR drop inside the pit and the salt film's thickness during pit growth under a salt film were estimated to validate the model. As seen in Figure 7, in agreement with previous work, 7,14,17,20 the IR drop inside the pit cavity remained constant. The IR drop value obtained herein was in accord with the values documented in the literature. 1,17 Similarly, the salt film thickness variation with pit depth was consistent with the findings in the literature. 32 Figure 7 suggested that the salt film thickness had to increase with increasing pit depth to accommodate the extra IR drop during 1D pit potentiostatic anodic polarizations, validating the choice of exchange current density.

Figure 7. Variation of the IR drop inside the pit and salt film thickness with the pit depth.
Download figure:
Standard image High-resolution imageThe migration effect on the pit stability product under a salt film was evaluated numerically with the 1D pit model developed herein, while the diffusion coefficient functions shown in Figure 4 were used as inputs. If Fe2+ migration was not taken into account,  was extracted from the modeling results with migration included as a function of the Fe2+ concentration, which incorporates the effect of both NaCl and FeCl2.
The calculated and experimental mass transport limiting current densities (ilim) vs the inverse of the pit depth (1/d) with and without migration are presented in Figure 8. It was found that ilim followed a linear relationship with 1/d, independently of migration inside the pit. However, at the same pit depth, ilim was almost three times higher when migration was considered, suggesting that migration accounted for ⅔ of the ilim. Therefore, migration should not be ignored when estimating the (x·i) values under a salt film, consistent with the analytical solutions presented above. The pit stability product with migration was 1.05 A m−1, extracted from the slope of the curve in Figure 8. An error of 5% would be introduced if 4.2 M FeCl2 is used as the saturated pit solution needed to estimate the pit stability product without considering the complexation reaction.

Figure 8. Comparison of the experimental data with numerically determined mass transport limiting current density values with the inverse of the pit depth when electromigration is included or excluded, as indicated.
Download figure:
Standard image High-resolution imageAlthough the analytical solution predicted that an equivalent diffusion coefficient (Deq ) could replace the variable diffusion coefficient inside the pit, a numerical model was required to obtain Deq . Figure 9 shows ilim vs 1/d curves with different Deq values. The ilim followed a linear relationship with the 1/d for different Deq values. The pit stability product varied between 0.81 and 1.38 A m−1, which agreed with the prediction of the analytical solution in Eq. 42. The (x·i) value was between those obtained in dilute and saturated solutions, in accordance with the prediction of the analytical results. When Deq was 4.83 × 10⁻¹⁰ m2 s−1, the results overlapped with those obtained using a variable diffusion coefficient. This Deq value was close to that of Gaudet et al. (4.98 × 10⁻¹⁰ m2 s−1), 16 and Nguyen and Newman (4.80 × 10⁻¹⁰ m2 s−1) 25 when the constant diffusivity with electromigration was considered. Additionally, when Deq = 4.83 × 10⁻¹⁰ m2 s−1 was substituted into Eq. 40, a value of (x·i) = 1.07 A m−1 was obtained under a salt film. This 2% discrepancy with the numerical result could be attributed to the assumptions made in the analytical solutions, i.e., that the net flux of Cl− and Na+ was zero. As is shown in Figure 10, with the increase of the pit depth, more chloride migrated into the pit cavity, leading to a non-zero net Cl− flux. These findings confirmed the robustness of the new model to incorporate both continuous pit growth and salt film precipitation.

Figure 9. Numerically determined mass transport limiting current density values vs the inverse of the pit depth for various diffusion coefficients and different Deq values of Fe2+.
Download figure:
Standard image High-resolution image
Figure 10. Chloride concentration profile as a function of the distance from pit mouth for two pit depths (500 and 1000 μm), as indicated.
Download figure:
Standard image High-resolution imageAs indicated in Eq. 40, the pit stability product is independent of the Cl− diffusion coefficient. Figure 11 illustrates the effect of chloride diffusivity on the pit stability product under a salt film. A linear relationship was found between ilim and 1/d, the slope of which was independent of the chloride diffusion coefficient. These findings confirmed the analytical results, suggesting that the chloride diffusion coefficient did not influence the (x·i) value under a salt film. In the modeling of pit growth under mass transport control, the viscosity effect on the diffusion coefficient of metal cations needs to be considered, while the viscosity effect on chloride diffusivity could be ignored.

Figure 11. Numerically determined mass transport limiting current density as a function of the inverse of the pit depth for constant Cl− diffusion coefficient values.
Download figure:
Standard image High-resolution imageNumerical results considering the Fe2+ complexation reaction
The pit stability product calculated in Figure 8 was higher than the experimental value by 5%, which could be attributed to the influence of complexation reactions inside the pit that were ignored thus far. In this regard, the charge carried by FeCl+ is lower than that of Fe2+, which would reduce the flux due to electromigration. Figure 12 compares the experimentally and numerically determined ilim vs 1/d, which agreed with the expected linear relationship. When a complexation reaction was included, the calculated pit stability product was 1.02 A m−1, in good agreement with the experimental data. The difference between the model and the experimentally determined pit stability product was within 2%. The results indicated that 4.2 M FeCl2 was an accurate simplification of the saturated solution at the pit. Thus, the estimation of the pit stability product under a salt film under mass transport control does not require considering the complete set of reactions expected in the pit solution based on the 316L SS composition (e.g., hydrolysis and complexation reactions of Cr3+, Fe2+, Ni2+, and Mo3+).

Figure 12. Comparison of the experimental data with numerically determined mass transport limiting current density with the inverse of the pit depth when complexation reaction included or excluded.
Download figure:
Standard image High-resolution imageFe2+ and FeCl+ were assumed to have the same equivalent diffusion coefficient (Deq ) inside the pit cavity. Figure 13 shows the simulated ilim vs 1/d using the proposed Deq and considering migration inside the pit when the complexation reaction was taken into account. As with the results shown in Figure 9, when Deq = 4.83 × 10⁻¹⁰ m2 s−1, the values overlapped with those obtained with a variable diffusion coefficient, indicating that Deq can also be used as an approximation even when the complexation reaction was included.

Figure 13. Numerically determined mass transport limiting current density as a function of the inverse of the pit depth for various diffusion coefficients and different Deq values when complexation reactions were included.
Download figure:
Standard image High-resolution imageConclusions
Numerical and analytical solutions were combined with experimental results to investigate the critical factors in the estimation of the pit stability product under a salt film. The following conclusions were drawn based on the evidence presented above:
- 1.Migration has a measurable influence on the mass transport limiting current during stable pit growth under a salt film. Therefore, migration effects should be considered in pit stability product estimations.
- 2.Although the diffusion coefficient of metal cations decreased with increasing concentration inside the pit, a constant pit stability product was observed, supported by both analytical and numerical results.
- 3.The variable diffusion coefficient of metal cations can be replaced by an equivalent diffusion coefficient, Deq , simplifying pit stability product calculations under a salt film.
- 4.The broadly used 1D Fick's law of diffusion is inaccurate for estimating the pit stability product under a salt film, resulting in the over-estimation of the equivalent diffusion coefficient,

- 5.A FeCl2 solution could be used as a simplified pit solution for estimating the pit stability product of 316L SS. When the complexation reaction is considered, the error was within 2%. The equivalent diffusion coefficient, Deq , was 4.83 × 10⁻¹⁰ m2 s−1.

Acknowledgments
This project was financially supported by Shell (Technology Centre, Bangalore) and Curtin University.