Abstract
Experiments on stainless steel artificial pit electrodes in sodium chloride were used to inform a diffusion model developed based on the mass transport behavior within a one-dimensional corroding pit. Measurable estimates of the dissolution flux as well as the potential describing the conditions of interest were obtained from experiment as the one-dimensional pit stability product under a salt film (i·x)saltfilm and the repassivation potential Erp, respectively. These parameter estimates were acquired as a function of pit depth and were related to the concentration of the metal cation at the corroding surface at each depth via a one-dimensional mass transport model. These results allowed for the construction of a quantitative framework relating the various electrochemical parameters describing the transition from pit stability to repassivation. Such an analysis permitted the straightforward estimate of the critical surface concentration associated with this transition, which resulted in a single conservative lower bound of 50% of the saturation concentration for the minimum aggressive chemistry to sustain stable pitting and prevent repassivation. Along with published data, these results were utilized to advance the idea that the critical pit solution chemistry is independent of bulk chloride concentration up to 4 M, a range frequently encountered in atmospheric conditions.
Export citation and abstract BibTeX RIS

This is an open access article distributed under the terms of the Creative Commons Attribution 4.0 License (CC BY, http://creativecommons.org/licenses/by/4.0/), which permits unrestricted reuse of the work in any medium, provided the original work is properly cited.
Many authors have separately reported the critical electrochemical conditions necessary for stable pitting and repassivation, focusing on dissolution flux,1–8 pit solution chemistry,9–16 or potential.17–31 The existence of these critical parameters is predicated upon the steady-state relationship that emerges between two competing processes. These processes are i) metal dissolution and hydrolysis that results in a local aggressive chemistry inside the pit, and ii) the dilution of this chemistry by diffusion out of the pit that contributes to repassivation.32–34 The mathematical description of this relationship for a one-dimensional pit was framed by Galvele1 in terms of the product of the current density and the pit depth, (i·x), which was termed the pit stability product in later studies.35–38 Once this product decreased below a critical value, (i·x)crit, the conditions in the pit would no longer be able to sustain the local aggressive chemistry necessary for active dissolution. Galvele's formulation, originally intended to describe the conditions leading to pit initiation, has also been successfully extended to pit propagation.4,7,35–37 Experimental assessment of the Galvele pit model is typically performed using the artificial pit or lead-in-pencil electrode,4,7,39–42 which consists of a metal wire embedded in epoxy. The lead-in-pencil electrode is particularly useful because it closely represents Galvele's pit model configuration, i.e. a single activated surface and inert walls.7,8 Additionally, the precipitation of a salt film40,43–48 at high anodic potentials in corrosive solution leads to diffusion-limited dissolution – a quasi-steady state condition that permits the study of one-dimensional mass transport. Consequently, the presence of a salt film at the corroding surface was considered necessary as a critical condition for stable pitting.13,36,37,49 However, studies have shown that pits could grow at potentials lower than those at which the salt films were stable,5,50 thus indicating the possible existence of intermediate steady states corresponding to lower degrees of saturation. This reasoning motivated attempts by Isaacs and coworkers to identify such film-free steady-states.4,7,42 The results of these studies indicated the presence of such states associated with several surface concentrations, thereby demonstrating that single, unambiguous critical values for the surface concentration and the associated potential at which stable pitting was sustained could not be extracted. Nonetheless, these data provided the commonly accepted range of 60% to 80% of metal chloride saturation as the critical surface concentration which has informed the view of many authors investigating pitting stability as a function of chloride concentration.8,51–55
In a similar vein, there has been considerable debate over the identification and measurement of a critical potential that could be used to characterize stable pitting. Initial perspectives on a critical potential below which pitting would not be stable suggested either the open circuit potential in the pit solution or the pitting potential as possible candidates.1,17,18,20,23,56–58 The selection of the open circuit potential in the pit solution as a critical potential was based on the understanding that a net cathodic reaction would be expected to ensue should the pit electrochemistry cause the potential to decrease below this value.20 This choice for the critical potential was hamstrung by the fact that equal rates of the anodic and the cathodic reactions in the pit would not result in a sufficiently aggressive local chemistry9,12,59,60 required to sustain pitting due to the elevation of the local pH by the local cathodic reaction. Laycock and Newman8 presented the argument that the critical potential was one below which the salt film would not be stable, calling this parameter the transition potential ET. Their work showed that ET was equivalent to the pitting potential, but measured in a pit solution chemistry corresponding to a salt film on the surface. This interpretation for a critical potential however, relies on the salt film solubility representing the critical solution chemistry, which is not necessary for stable pitting as has been stated previously. The value of utilizing the pitting potential as a critical parameter was also called into question when it was observed that it was dependent on the scan rate employed in the cyclic potentiodynamic polarization scans typically used for its measurement.22,61,62 Furthermore, these tests showed that the repassivation potential – recorded as the potential at which the current response in the reverse scan decreased to the value of the passive current measured during the forward scan – was also affected by the scan rate. The repassivation potential value appeared to be dependent on the charge density passed,22 as it decreased with decreasing scan rate. These insights on the influence of prior pit growth on repassivation were used by Thompson and Syrett28 to advance the idea that the critical potential describing both pitting initiation and repassivation was a single unique potential. The authors posited that this potential was artificially separated into the pitting potential and the protection potential by the parameters used in the cyclic polarization technique that tended to minimize incubation time and maximize pit growth following initiation. This concept was similar to the one proposed by Smialowska and Mankowski,24 which examined the development of a critical potential based on the comparison of pitting and crevice corrosion of stainless steel in chloride media.
On the other hand, Pickering and coworkers21,27,63 argued for loss of pit stability on the basis of an ohmic (IR) drop mechanism that would result in lower potentials and current densities as the pit grew deeper. However, when the Galvele criterion is applied to this interpretation, extremely deep pits would be expected to remain stable as long as they were sustained by a correspondingly low current density. This inference is challenged by the observation that pits cannot grow indefinitely and necessarily do repassivate, thereby implying the necessary existence of critical lower bounding conditions. Also, provided that the critical potential is one at which the pit still remains active, this value cannot be lower than the potential where the net anodic current density vanishes, i.e., the open circuit potential in the pit solution noted previously.
Sridhar and coworkers29,64–66 attempted to address the diverse viewpoints on the critical potential by defining a parameter that could serve as conservative lower bound, which would be useful in engineering practice. Their methodology involved measuring repassivation potential using a variant of the THE method developed by Tsujikawa and Hisamatsu,25,26,67 which essentially consisted of high-potential potentiostatic pit initiation and galvanostatic propagation, followed by the application of stepped potential holds at lower and lower potentials until a finite low anodic current density was attained. Potential steps below this value would lead to a rapid decrease in current density, indicating repassivation. Results from these tests showed that the repassivation potential decreased with increasing charge density before approaching a plateau value at sufficiently large charge densities. Very long-term (>5 years) testing indicated that samples held above this plateau value underwent pitting. On the other hand, samples held below this value did not initiate new pits and neither did existing pits continue to grow. This measure of the critical potential was therefore adopted as the repassivation potential (Erp) because it provided a measurable, consistent, conservative lower bounding estimate. Rebak and coworkers31,68,69 have extended these results to crevice corrosion in nickel alloys, attesting to this measurement as a consistent evaluation of a critical potential. A qualitative discussion on how this potential was related to surface concentration at repassivation based on arguments using ohmic drop21,27,27 as well as mass transport restriction due to pit geometry was proposed in these studies. However, only a limited quantitative assessment of the critical solution chemistry associated with this potential was provided – a treatment with respect to behavior in simulated pit solutions of different pH, which showed an active-to-passive transition when the pH was increased. Furthermore, despite the indubitable lower bound obtained in potential, the use of large-area samples meant that the occurrence of multiple pits resulted in some ambiguity about the relationship between charge density calculation and corrosion damage depth. Recent work based on this study has focused on developing a general repassivation potential model66,70,71 based on oxide nucleation72 in competition with the presence of a hydrous metal halide, which has been useful in calculating the Erp in various field environments. The objective of these studies, however, was not to quantitatively associate Erp with the other critical factors describing the transition from pit stability to repassivation. The authors considered that a surface concentration close to, but not at saturation, represented the critical value, but this value was not quantified. These latter studies also adopted the repassivation potential obtained from creviced samples as the conservative lower bound for Erp. This consideration is consistent with the reasoning presented by Srinivasan et al.,73 who showed that crevice formation in large-area samples resulted in attaining the Erp lower bound at lower measured charge densities than with artificial pits.
It must therefore be recognized, as noted by Newman,74 that whether expressed as solution chemistry, dissolution flux, or potential, these critical factors describe the same phenomenon: the transition between stable pitting and repassivation. As has been stated, studies that have discussed a single critical parameter have not quantitatively related it to the other associated factors. Therefore, a quantitative framework is required to establish scientifically defendable connections among the critical electrochemical parameters that characterize the conditions in the pit that mark the boundary between active localized dissolution and repassivation. Determining these critical factors accurately and in quantitative relation to each other is necessitated by their substantial effect on a priori damage size bounding estimates when used as input data in predictive models75–78 useful for structural integrity analyses. Maximum pit size estimates using these models have been shown to vary by up to a factor of 3 depending on the critical value of surface concentration,78 this variation would have a significant impact on fracture mechanics-based design for metallic components employed in corrosive atmospheres.79,80 In this study, the one-dimensional architecture of the artificial pit technique is leveraged to both obtain experimental measures of steady state dissolution flux and repassivation potential. These experiments are combined with mass transport modeling that utilizes these parameters to determine the metal chloride concentration at the corroding surface, which is difficult to access directly due to the restrictive geometry and aggressive chemistry of the pit. Previous work on artificial pits that has considered pit stability in the context of repassivation73,81 is also revisited in order to rationalize the results obtained so that the quantitative strength of the framework is reinforced. This study therefore provides a single experimental and modeling paradigm to evaluate the critical surface concentration and potential characterizing the transition from pit stability to repassivation.
Experimental
Artificial pit experiments
One-dimensional artificial pit electrodes were constructed using 316L stainless steel wires (California Fine Wire Company, Grover Beach, CA) of diameter 50.8 μm embedded in epoxy. The composition of the wires is shown in Table I. The electrode surface was polished to 320 grit with SiC abrasive paper and then placed upright in a test cell containing 0.6 M NaCl solution. The exposed area of the electrode was 2.03 × 10⁻⁵ cm2. A saturated calomel reference electrode (SCE) and a platinum mesh counter electrode were utilized for all tests.
Table I. Composition of stainless steel wire used (all values in weight percent). Composition provided by vendor was confirmed by quantitative speciation using inductively coupled plasma optical emission spectroscopy (ICP-OES).
| Alloy | C | Mn | P | S | Si | Cr | Ni | Mo | N | Cu | Fe |
|---|---|---|---|---|---|---|---|---|---|---|---|
| 316L | 0.019 | 1.356 | 0.030 | 0.0287 | 0.406 | 17.07 | 10.66 | 2.16 | 0.0499 | 0.232 | 67.98 |
Pitting was initiated by applying a potential of +750 mVSCE for a short duration (2 to 5 minutes) and then propagated to various depths by applying a lower potential of +450 mVSCE. This sequence was followed by a rapid cathodic polarization scan at 5 mV/s to a final potential of −900 mVSCE in order to obtain measurable estimates of (i·x)saltfilm and Erp. Variants of this procedure have been employed in other recent pitting studies that have focused on pit stability and repassivation.73,81,82 All electrochemical testing was carried out at an average ambient temperature of 22°C using either a Gamry Reference 600 (Gamry Instruments, Inc., Warminster, PA) potentiostat or a Bio-Logic SP-150 (Bio-Logic SAS, Claix, France) potentiostat.
Mass transport modeling
In order to relate the experimentally measured electrochemical parameters of dissolution flux and potential to pit solution chemistry, the one-dimensional diffusion kinetics of the artificial pit electrode were modeled. The model geometry was set up as shown in Figure 1 with the following constraints:
- The system is considered to be axisymmetrical with respect to the x-axis as shown.
- Initial concentration at the bottom of the pit C (x = 0, t = 0) = Csat.
- Concentration at the pit mouth set to zero for all time.
- A linear concentration gradient was set up within the pit at t = 0, i.e, C (x, t = 0) = Csat
 .
. - The walls of the pit were considered to be inert, i.e., flux across these boundaries was set to zero for all time.
- A constant diffusion coefficient D of 8.24 × 10⁻⁶ cm2/s as employed by Gaudet et al.7 based on FeCl2 diffusion in 1 M HCl.a

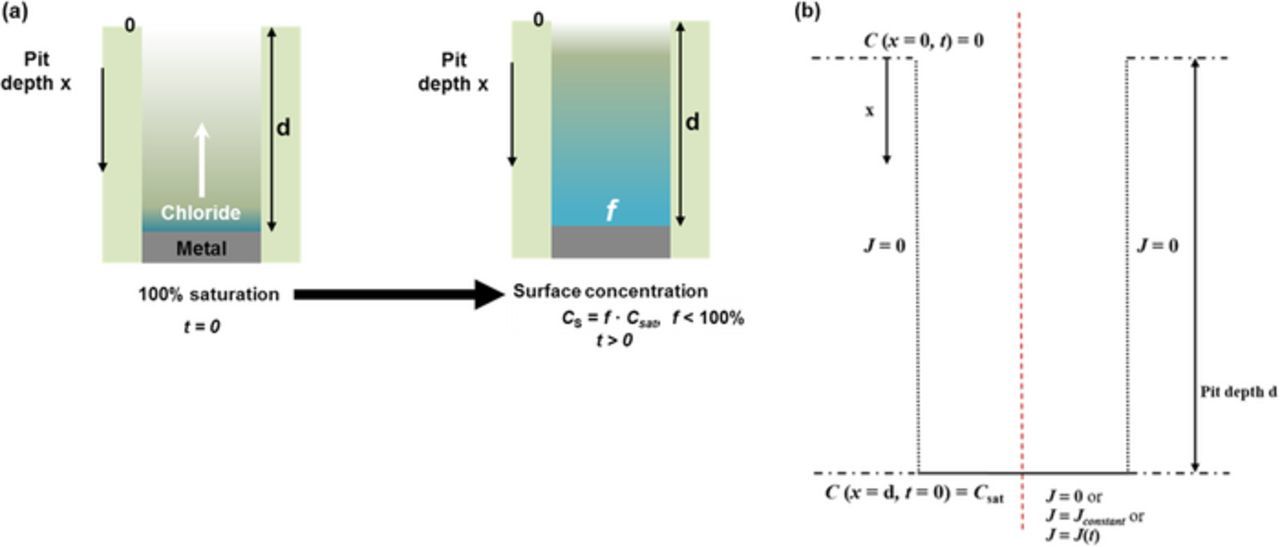
Figure 1. One-dimensional pit system considered in modeling (diagrams not to scale). (a) Schematic depiction of process modeled. (b) Geometry of system utilized in modeling. The one-dimensional diffusional characteristics of the system are considered along the x-axis as indicated. Time-evolution of the system was calculated for three cases of flux boundary conditions at the bottom of the pit. The origin was considered to be at the center of the pit mouth. Inert boundaries are indicated by the dotted lines.
The time-evolution of the mass transport of this system was analyzed for three different flux boundary conditions at the bottom of the pit: zero flux, constant flux, and a transient flux. Analytical solutions were obtained for the system under the boundary conditions of zero flux and constant flux at the corroding surface. For the transient flux however, numerical methods involving finite element analysis had to be employed. The COMSOL Multiphysics v5.2 (COMSOL, Inc., Burlington, MA) software was used to model the geometry in Figure 1b under the specified boundary conditions. Simulations were run until differences in calculations from successive iterations as determined by the error estimation capability of the software decreased to lower than the threshold tolerance of 0.1%.
The values for the constant flux and transient flux were estimated from the experimental data from each pit depth in two ways:
i) Constant flux: An average current density was calculated by integrating the area under the current density versus time curve between the limits of recording the potentials corresponding to the two surface conditions of interest, i.e., the transition potential ET where the salt film disappears8 and the repassivation potential Erp (Figure 2a). The time variable tact was defined as the experimental time taken for the instrument to scan from a surface condition described by 100% saturation to the surface condition at which the Erp measurement is made. The expression for tact can be written in terms of the potentials that describe the respective surface conditions of interest and the scan rate ((dE/dt)):
![Equation ([1])](https://content.cld.iop.org/journals/1945-7111/163/13/C759/revision1/d0001.gif)
The average current density iavg can then be expressed as:
![Equation ([2])](https://content.cld.iop.org/journals/1945-7111/163/13/C759/revision1/d0002.gif)

Figure 2. Extraction of kinetic parameters from experiment. (a) Polarization kinetics data indicating measurements of the diffusion-limited dissolution current density iL, the repassivation potential Erp and the transition potential ET. (b) Extraction of pit stability product under a salt film across various pit depths. All data refer to 316 L in bulk 0.6 M NaCl.
This average value was expressed as a fraction ϕ of the measured diffusion-limited dissolution current density iL which is obtained from experiment (Figure 2):
![Equation ([3])](https://content.cld.iop.org/journals/1945-7111/163/13/C759/revision1/d0003.gif)
ii) Transient flux: The transient current density response i(t) corresponding to the recording of Erp during the polarization sequence was obtained from experimental data (similar to representation shown in Figure 2a) and was used as the input for the flux boundary condition  , where z is the average number of electrons transferred during every instance of the congruent dissolution of 316L = 2.2, and F is Faraday's constant = 96485 C/mol-equivalent; these values are consistent with those used in the literature.5,7,8,54 The consequent time-dependent transport problem was solved numerically using the COMSOL Multiphysics software, as mentioned previously. The time-evolution of concentration at the corroding surface was obtained for different pit depths for these alternative boundary conditions as well, and expressed in terms of a fraction f of the saturation concentration Csat (Cs = f · Csat).
Results
Artificial pit experiments
The main advantage of the one-dimensional artificial pit configuration is the ability to obtain a straightforward, unambiguous geometry in which the pit depth serves as a single externally controlled variable against which electrochemical parameters associated with pitting and repassivation can be mapped. The pit depth was calculated directly from the charge density passed during the two potential holds. The rapid scan rate employed during the potentiodynamic polarization sequence permitted the assumption of a fixed pit depth for the purpose of the diffusion modeling due to the fact very little additional dissolution occurred73 during this step. As an example, for the pit of depth 475 μm (shown in Figure 3a), the polarization sequence contributed 17.5 C/cm2 of the total charge density of 1433 C/cm2, or 1.2%. Furthermore, as attested to by other studies in the literature,73,82,86 the rapid scan rate permitted analysis of the kinetics of the system without substantial dilution of the aggressive chemistry at the pit base. Extraction of the kinetic parameters from the experimental data (Figure 2a) followed the method described by Srinivasan et al.73 Linear regression was performed on the data obtained by plotting the value of the diffusion-limited dissolution current density against the reciprocal of the pit depth. The slope of this linear fit provided an estimate of the pit stability product under a salt film (i·x)saltfilm, as shown in Figure 2b. It is also important to ensure that the value of (i·x)saltfilm implemented be isolated from the effect of bulk [Cl−]. This requirement can be accomplished by either collecting pit stability data exclusively from depths deeper than approximately eight to ten times the pit diameter81 or by using the relationship developed by Woldemedhin et al.82 which maps the linear dependence of (i·x)saltfilm on bulk [Cl−], which for 18-8 stainless steels in chloride has been calculated to be 0.9 A/m. From Figure 2b, the value of (i·x)saltfilm in 0.6 M NaCl is determined to be 0.8 A/m. This estimate agrees well with the reported (i·x)saltfilm value of 0.83 A/m for a bulk [Cl−] of 0.6 M from the Woldemedhin et al.82 study.
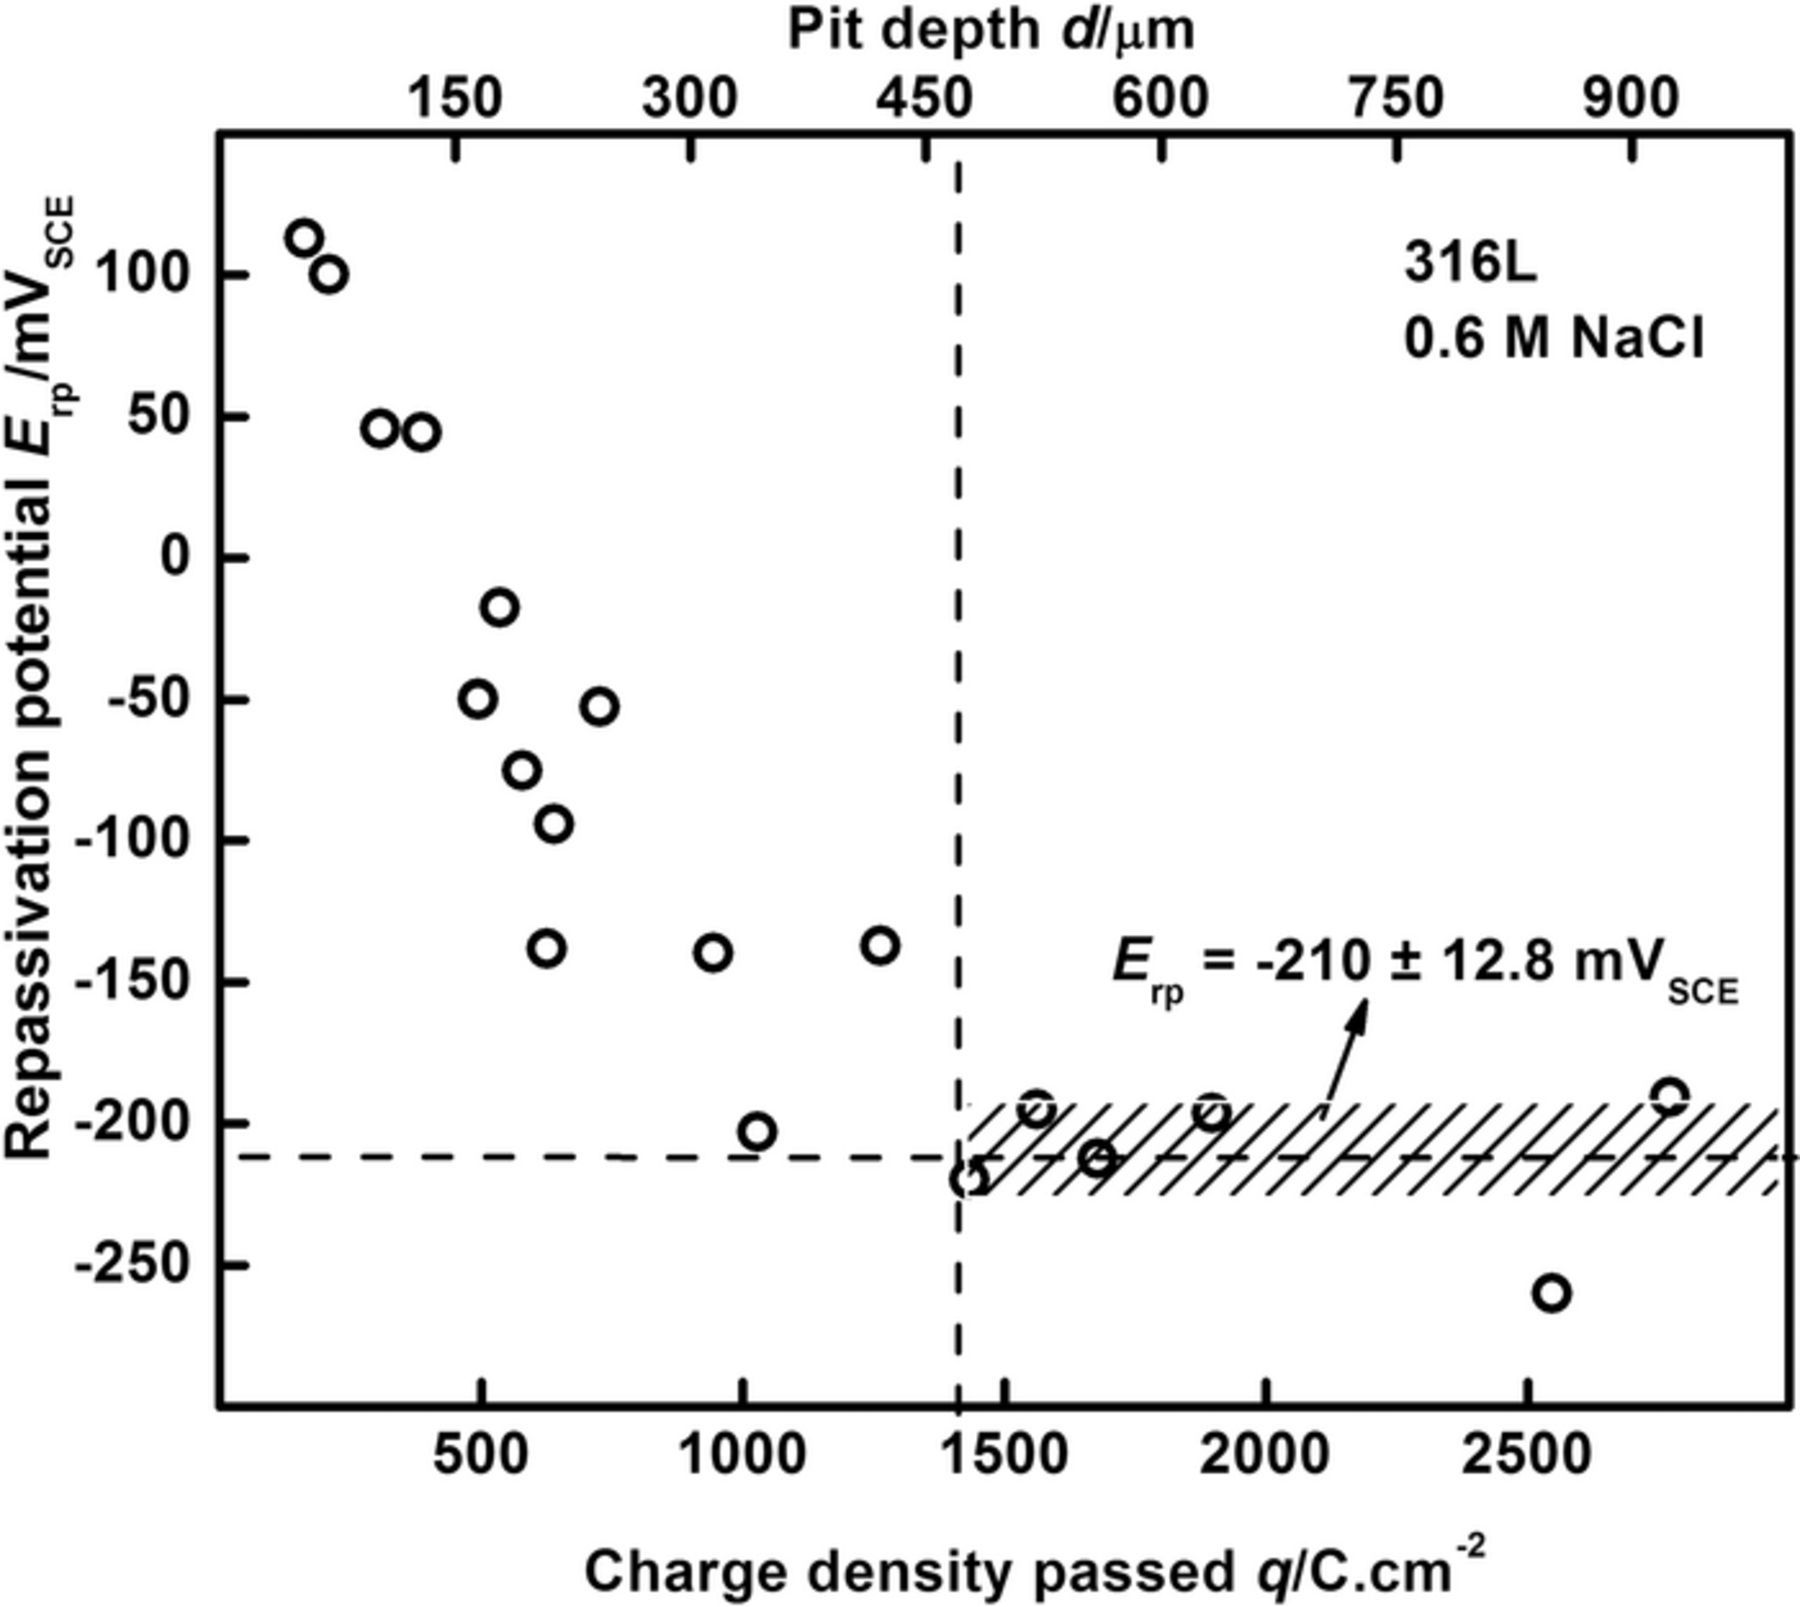
Figure 3. Extraction of the measured repassivation potential Erp from anodic kinetics data at various pit depths. The Erp value denoted is the plateau which the recorded values approach at deep pit depths/high charge density. Data refer to 316L in bulk 0.6 M NaCl.
At each pit depth attained following growth under potentiostatic control, the potential at which the subsequent polarization scan attained an anodic current density value of 30 μA/cm2 was recorded as an estimate of the repassivation potential Erp. As shown in Figure 3, the measured Erp decreased initially as the pit depth increased, but became relatively independent of depth once sufficient charge density had been passed (or equivalently, a sufficiently large pit depth had been attained). This depth at which the Erp saturates can be determined from statistical analysis as well as phenomenological evidence. For a given dataset collected at a particular scan rate,73 the value of the depth beyond which the Erp does not change over a large range was calculated via a Student's t-test (at the 95% confidence level). This depth is then compared to the value at which the steady state flux emanating from the pit can be definitively approximated by one-dimensional mass transport based on the pit depth as a measure of the diffusion length, as reported by Srinivasan et al.81 This latter value therefore serves as an internal consistency check on the scan rate employed. The recorded Erp values at depths greater than this value are then averaged to obtain the mean Erp, which is recorded as the repassivation potential of the alloy in the conditions of interest, as denoted on the plot in Figure 3. These results, both in trend and in value, were consistent with other studies on Erp in the literature.29,64–66,70,71,73,82
Discussion
The results obtained from experiments and modeling were analyzed to determine the concentration at the corroding surface of the pit as it is about to repassivate. This treatment involved studying the diffusion flux of the system as the measurement of repassivation potential was performed. The effects of varying the assumed boundary conditions on the critical surface concentration as well as the impact of scan rate on repassivation were investigated. The possibility was examined that a single critical pit solution chemistry governs the anodic stability criteria across bulk environments encountered during atmospheric corrosion.
Diffusion flux is modeled by mass transport analysis as Erp is measured
The mass transport model provided an estimate of the time taken for the corroding surface to dilute from a chemistry described by 100% saturation of the cation chlorides (i.e., the presence of a salt film) to lower concentrations, described by the parameter f. The evolution of surface concentration as the pit dilutes was derived in terms of the pit depth d and time t, for a constant diffusion coefficient D:
![Equation ([4])](https://content.cld.iop.org/journals/1945-7111/163/13/C759/revision1/d0004.gif)
This expression is similar in form to that obtained by Newman and Isaacs.4 The value of D is taken to be 8.24 × 10⁻⁶ cm2/s, a value close to that of Fe+2 in 1 M HCl,87 that has been shown to be a reasonable approximation of the effective diffusion coefficient of the 'stainless steel cation' in multiple studies.7,42,54,73,82,84 The expression in Equation 4 is relevant to the boundary condition that considered the flux at the corroding surface to be zero.
Approximating the series to the first term and solving for the time to dilution to a given fraction of saturation (denoted as tf) yields the following expression:
![Equation ([5])](https://content.cld.iop.org/journals/1945-7111/163/13/C759/revision1/d0005.gif)
As Figure 4 shows, the truncated series expression (Equation 5) closely approximates the time to dilution calculated from the complete solution obtained by finite element analysis of the diffusion problem using COMSOL Multiphysics v5.2, particularly for values of f less than 70%. In order to calculate the concentration of the corroding surface at the point where the pit begins to repassivate, it is instructive to observe how the surface concentration at the moment of the experimental measurement of Erp varies at different pit depths. Comparing tf with tact (defined in the previous section) for various pit depths would permit the estimation of the surface concentration when the experimental measurement of Erp is recorded. In this case, tact effectively serves as a measure of the time available for the corroding surface to dilute from 100% saturation.
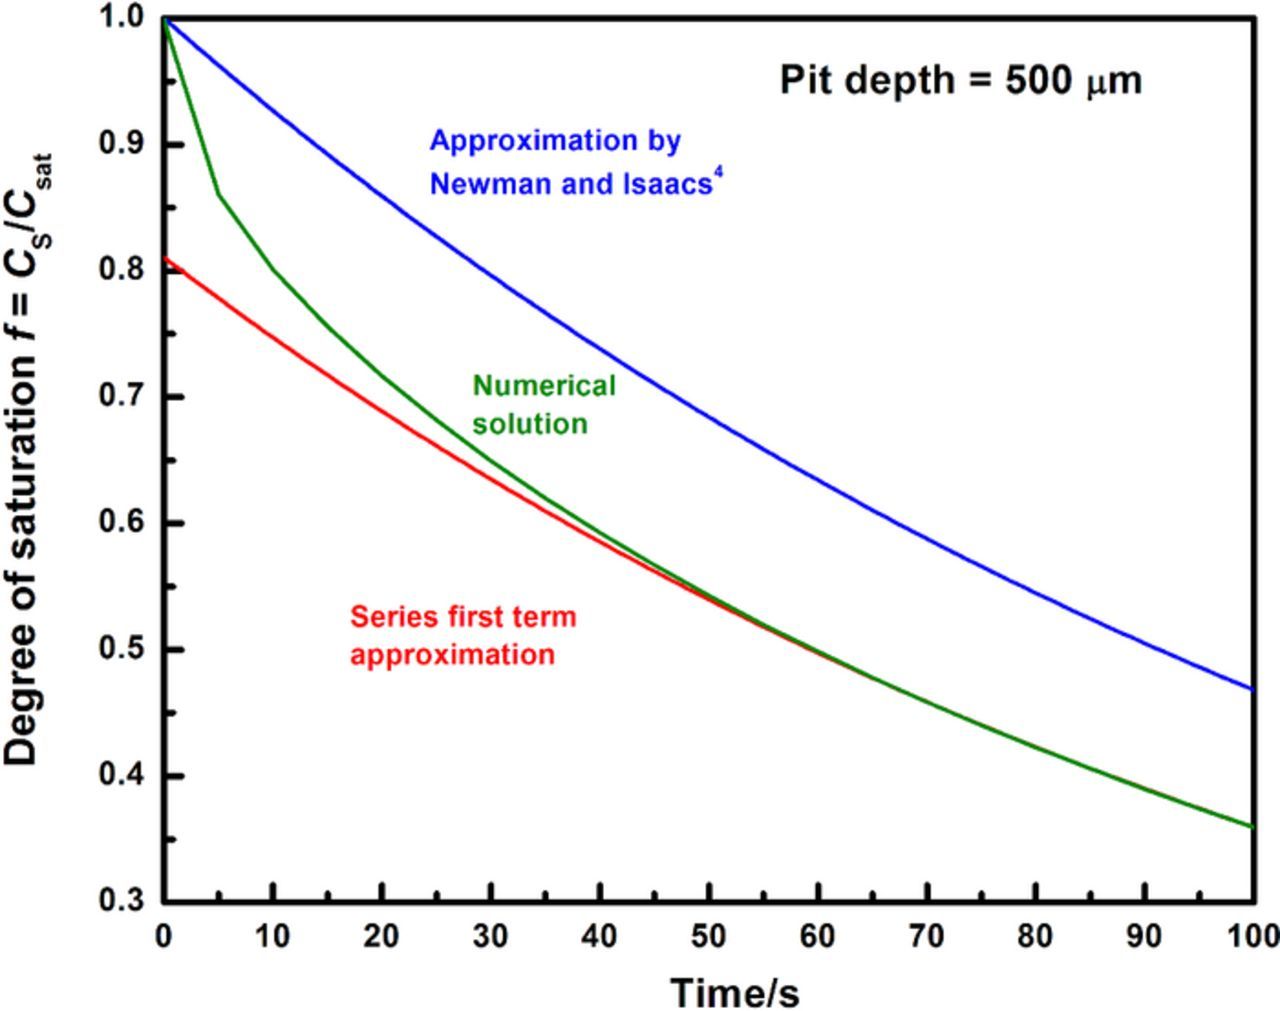
Figure 4. Time-evolution of the surface concentration in the system considered in model as estimated by three different methods. (a) Base-10 logarithmic approximation reported by Newman and Isaacs.4 (b) Complete solution obtained using finite-element analysis. (c) Expression obtained in Equation 5 following truncating the series in Equation 4 to the first term.
The experimental time tact is compared to the calculated time to dilution tf, to obtain the difference Δt:
![Equation ([6])](https://content.cld.iop.org/journals/1945-7111/163/13/C759/revision1/d0006.gif)
The variation of Δt with pit depth at different levels of dilution can be examined, as shown in Figure 5 for a surface concentration corresponding to 60% of saturation. This plot can be analyzed to evaluate how concentration of the cation chloride at the corroding surface changes as Erp measurements are made at different pit depths, permitting an interpretation of the effect of diffusive transport on repassivation. From the data in Figure 5, it can be seen that at shallow pit depths, Δt > 0 because given the short diffusion length, the time provided (because of the experimental scan rate) for the pit to dilute to 60% of saturation is greater than the time required for the pit to dilute to this value. Therefore, by the time the Erp is measured, the actual surface concentration is less than the value represented by the curve. Conversely for deep pits, Δt < 0 because mass transport out of the pit is more restricted due to the longer diffusion path. Therefore, the time permitted for the pit to dilute to 60% of saturation is less than the time required for the pit to dilute to this value. It follows then that, by the time the Erp is measured for deep pits, the actual surface concentration is higher than the value represented by the curve. These observations imply that, for some intermediate pit depth, tact will be equal to tf and thus Δt = 0. At this pit depth, the surface concentration when the Erp measurement is made would be equal to the value described by the curve.
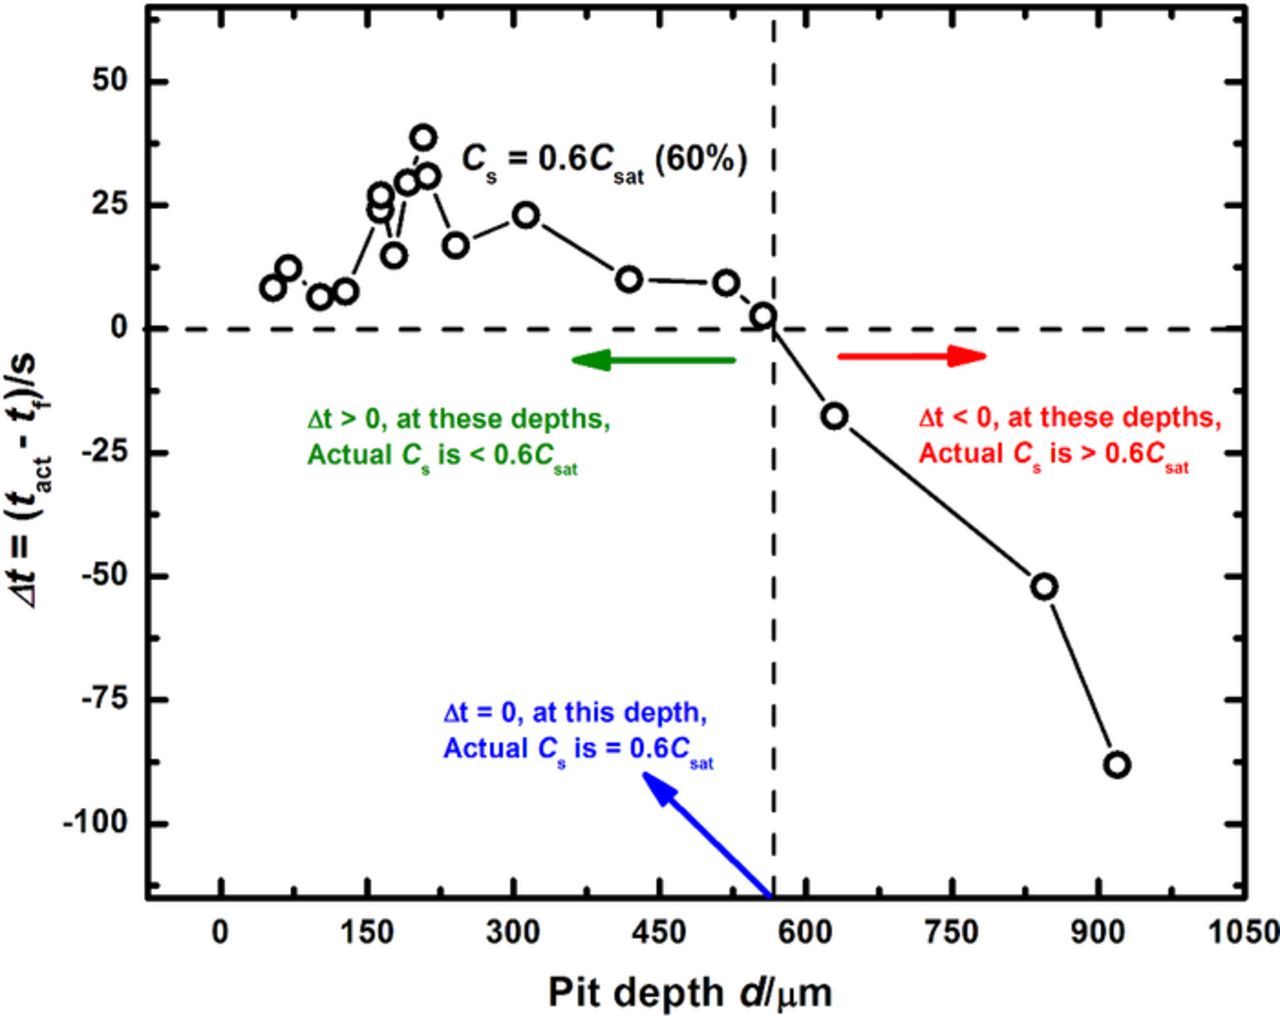
Figure 5. Estimation of concentration of '316L cation' at the corroding surface of the one-dimensional pit at various pit depths as the Erp is measured. This plot compares how the time to dilute to 60% of saturation is affected by the imposed constraints of an experimental scan rate.
Following the logic thus outlined, a series of curves mapping Δt as a function of pit depth can be obtained for various values of f. These curves are shown in Figure 6, from which the corresponding depths at which Δt = 0 can be estimated for each surface concentration. In order to determine which of these values of surface concentration truly represents repassivation of the surface, the plot of repassivation potential versus pit depth as obtained from the artificial pit experiments is examined. As shown in Figure 3, the Erp is seen to decrease with increasing pit depth before reaching a plateau for sufficiently deep pits. The depth at which this transition to the plateau occurs indicates that the mass transport is sufficiently restricted such that the aggressive solution chemistry is not lost by diffusion before the experimental measurement of Erp is recorded.29,64–66,81
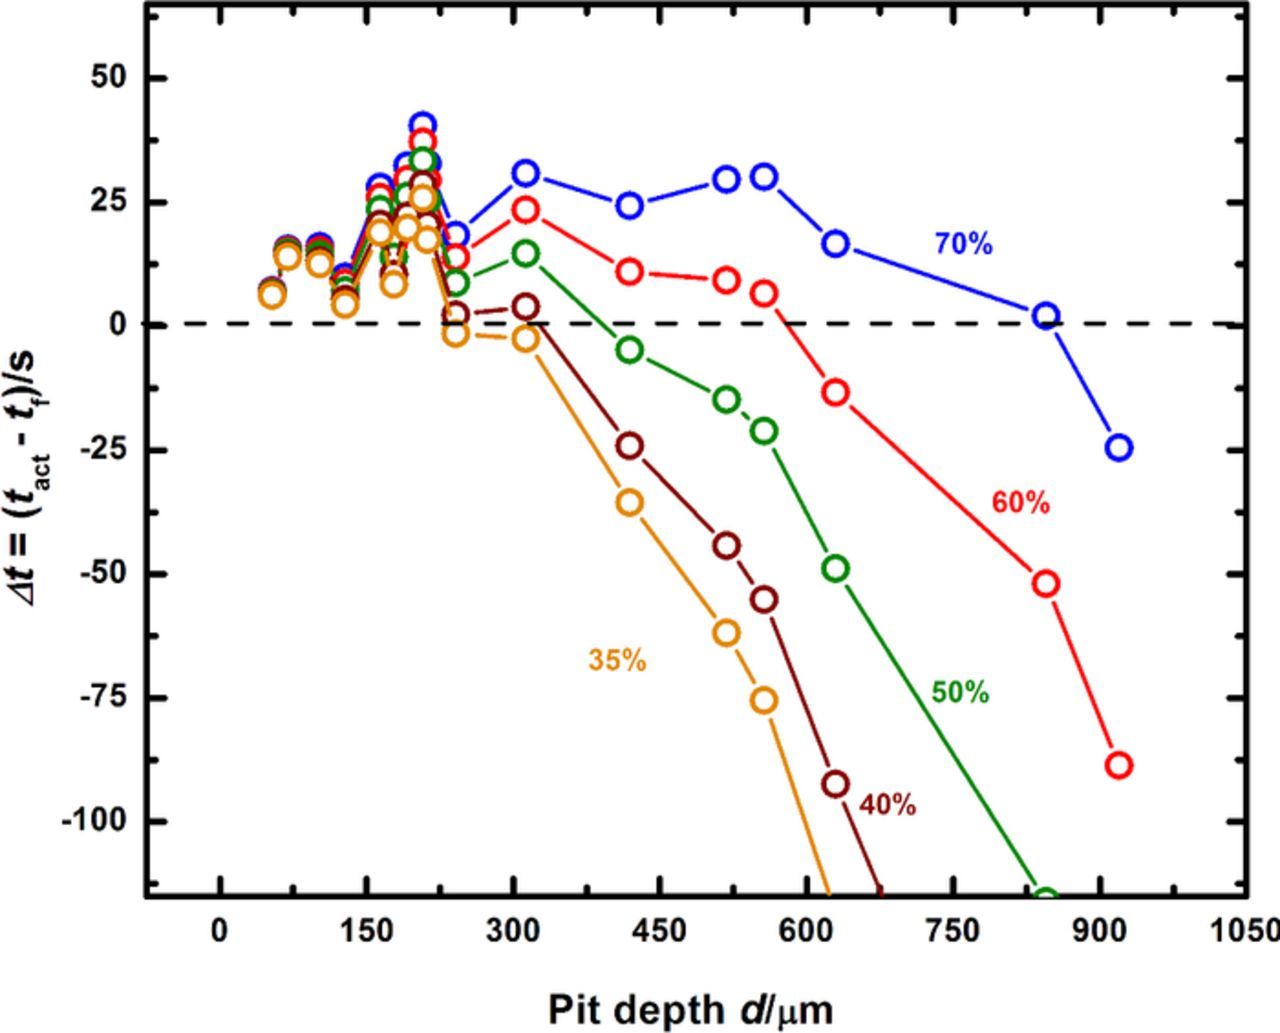
Figure 6. Δt mapped as a function of pit depth for different values of surface concentration of cations at the corroding surface. Note that as pit chemistry becomes more aggressive, a deeper pit is required to provide sufficient mass transport restriction to achieve stability (as indicated by the depth where Δt = 0).
Figure 7 shows a composite of the two pit-depth dependent plots of Δt and Erp. By comparing the depths at which Δt = 0 for various levels of dilution to the depth at which the transition to the Erp plateau takes place, the value of f describing the surface condition as repassivation is about to occur can be estimated. In this manner, a pit depth value serves as a surrogate indicator of critical pit solution chemistry. Using the data in Figure 7, an estimate of this critical surface concentration is seen to be between 50% and 60% of saturation, with the lower value chosen as a conservative estimate. This approach shows that the critical solution chemistry is in fact lower than the estimates of 60% to 80% obtained by Gaudet et al.7 based on the multiple intermediate steady states that follow salt film-free dissolution of stainless steel artificial pits. The ambiguity in identifying a critical surface concentration because of multiple intermediate steady states7,42 is avoided in this study which provides a single value of the critical solution chemistry and relates it to a critical potential Erp defined with respect to a critical diffusion flux. Therefore, an intermediate solution chemistry is identified at which not only are both dissolution and dilution fluxes equal, but also the associated potential represents a critical measure of the repassivation condition. In this manner, the method described herein illustrates a comprehensive, quantitative framework that identifies and measures a set of electrochemical parameters critical to both pit stability and repassivation.
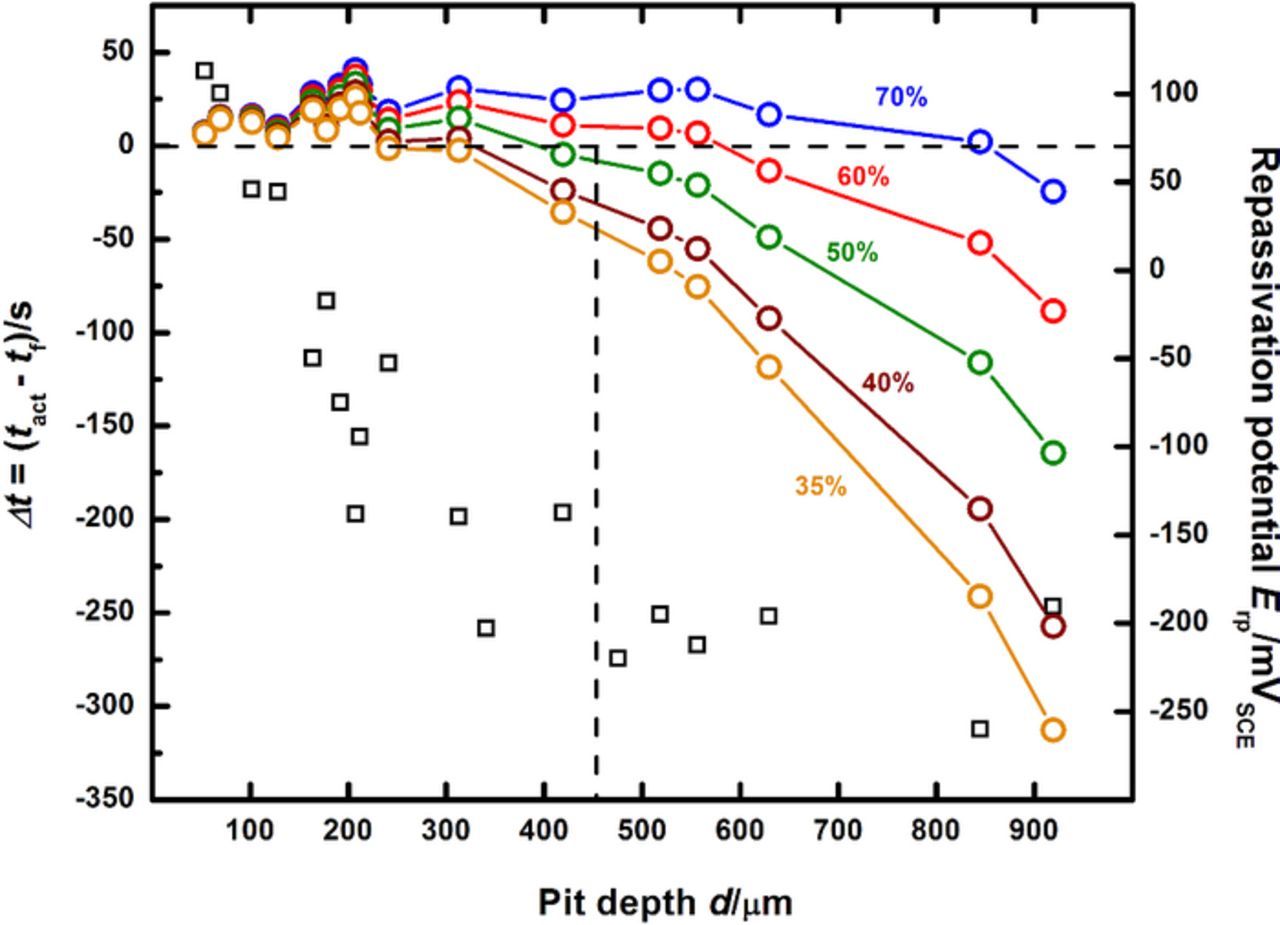
Figure 7. Estimation of the concentration of metal cations at the corroding surface as the pit transitions from stability to repassivation, under zero flux boundary conditions.
Conservative estimate of surface concentration consistent with alternative boundary conditions
The quantitative framework proposed in this study showed similar results upon extension to experiments that considered a non-zero flux at the corroding boundary. The corresponding expression (truncated to the first term) for the time-dependent concentration and the related time to dilution (tf) under the constant flux boundary condition are the following:
![Equation ([7])](https://content.cld.iop.org/journals/1945-7111/163/13/C759/revision1/d0007.gif)
![Equation ([8])](https://content.cld.iop.org/journals/1945-7111/163/13/C759/revision1/d0008.gif)
where φ is the average current density iavg expressed as a fraction of the experimentally measured diffusion-limited current density iL, as defined in Equations 1 through 3.
Figure 8a shows how the results obtained using a constant flux boundary condition are practically identical to those obtained with the simpler zero flux consideration. Figure 8b shows the series of curves drawn in the manner of those shown in Figure 6, but with tf determined using the constant flux boundary condition. The resulting estimate of the critical surface concentration is slightly less than 60%, which agrees well with the solution obtained using a zero flux boundary condition (between 50% and 60%). The constant flux boundary conditions applied served as an upper bound for this approach and therefore the use of 50% of saturation as the critical surface concentration as a conservative estimate is justified.
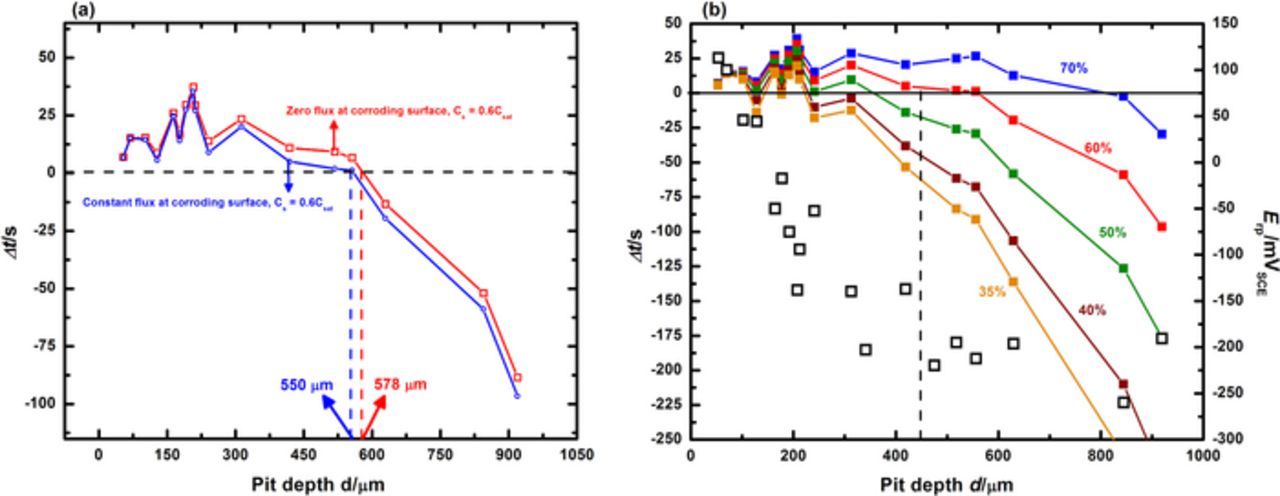
Figure 8. (a) Δt obtained under both zero flux and constant flux boundary conditions considered, mapped as a function of pit depth for a surface concentration at 60% of saturation. Note that the pit depth where Δt = 0 is practically identical for both cases. (b) Estimation of the concentration of metal cations at the corroding surface as the pit transitions from stability to repassivation, under constant flux boundary conditions.
The framework considered in this work can also accommodate time-dependent flux boundary conditions, where the transient flux is associated with the moment the Erp is measured in the experiment. As a result of the manner in which the Erp is measured (as described in the Experimental section), the calculations based on this flux consideration directly provide the surface concentration where Δt = 0 as a function of pit depth, thereby precluding the intermediate step of comparing tact and tf. These values of surface concentration where Δt = 0 are then compared with the depth beyond which Erp reaches a plateau value to extract the critical surface concentration, similar to the non-transient flux cases considered previously. Figure 9 depicts these results, and the critical surface concentration is estimated to be slightly lower than 60% of the concentration at saturation. There is experimental scatter associated with this estimate because there is no inherent smoothing of the input data. The calculations based on the zero flux and constant non-zero flux boundary conditions do not encounter this problem because both utilize constant input; the former uses zero whereas the latter uses a value obtained from data averaging. However, despite this limitation, the critical value of surface concentration determined using the transient flux boundary conditions is in good agreement with – and bounded by – the conservative estimate of 50% of saturation from the zero flux consideration.
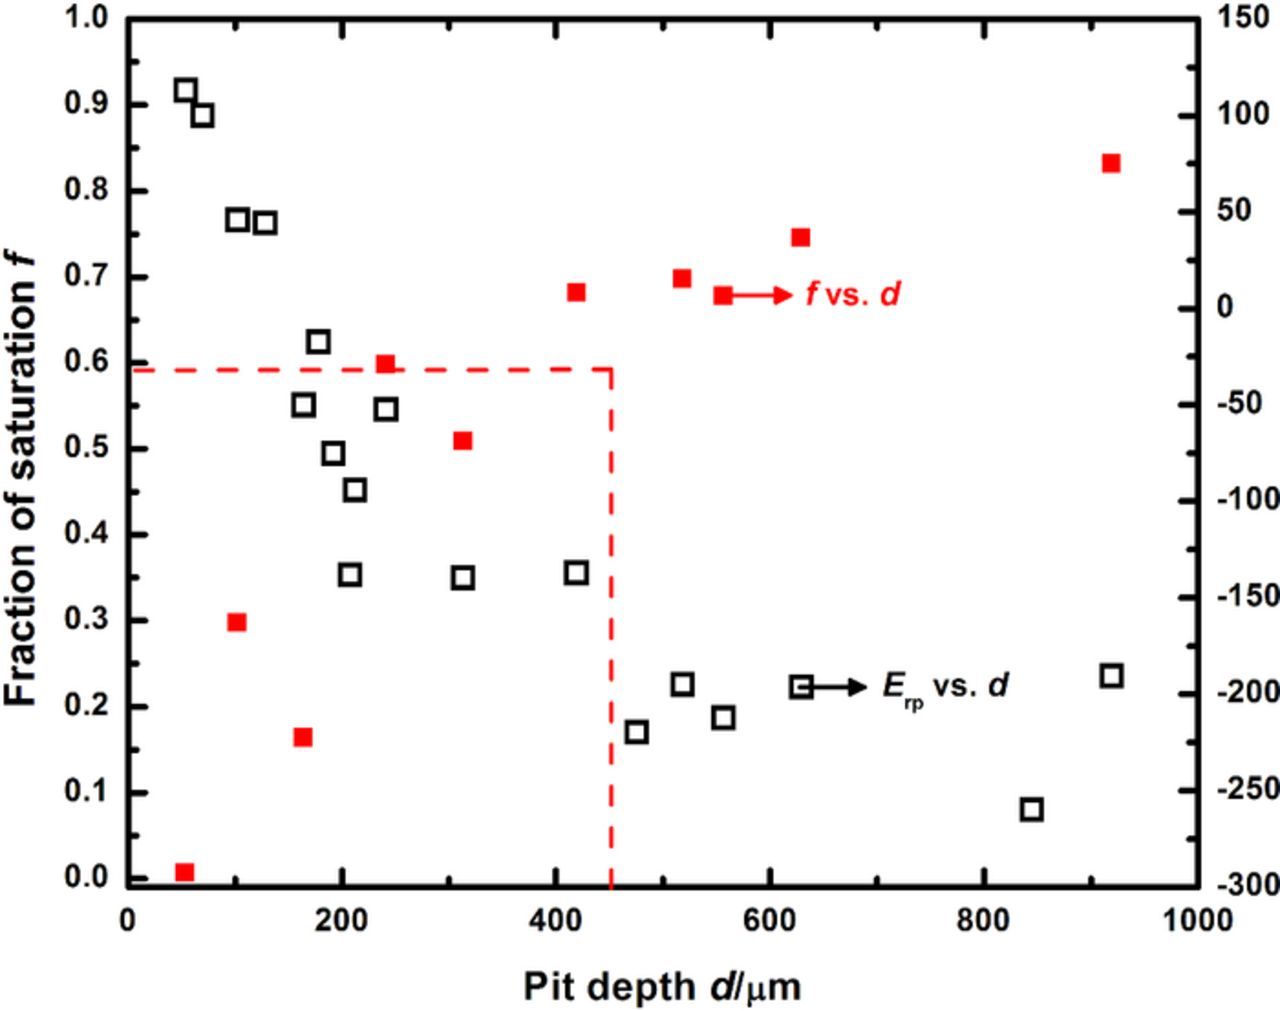
Figure 9. Estimation of the concentration of metal cations at the corroding surface as the pit transitions from stability to repassivation, when the transient current density at Erp measurement in the polarization scan sequence is considered as the time-dependent flux.
Scan rate does not affect repassivation potential once steady state conditions are attained
Figure 10 compares the Erp behavior with pit depth obtained at a higher scan rate of 100 mV/s, to the data obtained at 5 mV/s. Although the nature of the approach to the Erp plateau is reversed from that observed for the data obtained at 5 mV/s, with more negative potential values measured at shallow pit depths, the value to which the repassivation potential saturates is essentially identical. It is important to note that at depths greater than 400 μm (which correspond to a truly one-dimensional steady state mass transport response based on the pit depth81), the measured repassivation potential is stable around −200 mVSCE, which is the plateau value obtained at 5 mV/s as well. Recent work by Srinivasan et al.81 has shown that for pits of diameter 50 μm, true 1-D mass transport is not reached until about 400 μm. An experimental caveat regarding the choice of the scan rate in order to obtain the Erp trend with pit depth (decreasing as d increases, until a plateau is reached) has been reported in a previous high-throughput artificial pit study.73 In that study, the choice of a scan rate of 5 mV/s (which is more rapid than the value used in the ASTM standard tests62,67) avoided the excessive dilution of the aggressive chemistry which would be encountered at slower scan rates. It should be noted that for the data collected at 100 mV/s shown in Figure 10, the value of tact once the pit depth is greater than 400 μm is approximately 2 s. The concentration the corroding surface would dilute to at the end of this duration is ≈90% saturation (as calculated by numerical simulations similar to the one shown in Figure 4) at the end of the scan. Given that the Erp plateau values obtained for data collected at both scan rates agree very closely with each other, this result indicates that the repassivation potential is therefore independent of concentration at the corroding surface once the latter is greater than a critical value. Equivalently stated, these results lend quantitative support to the notion that once a minimum critical value of f is attained for which the pit is stable, it will continue to remain stable at more concentrated chemistries as well. For the system in this study, this has been determined, as shown in Figures 7 through 9, to be conservatively 50% of saturation. The results of this study indicate therefore that the selection of an appropriate experimental scan rate requires to be based on the attainment of true 1-D mass transport conditions as well as the necessity of sustaining a minimum aggressive chemistry for pit stability.
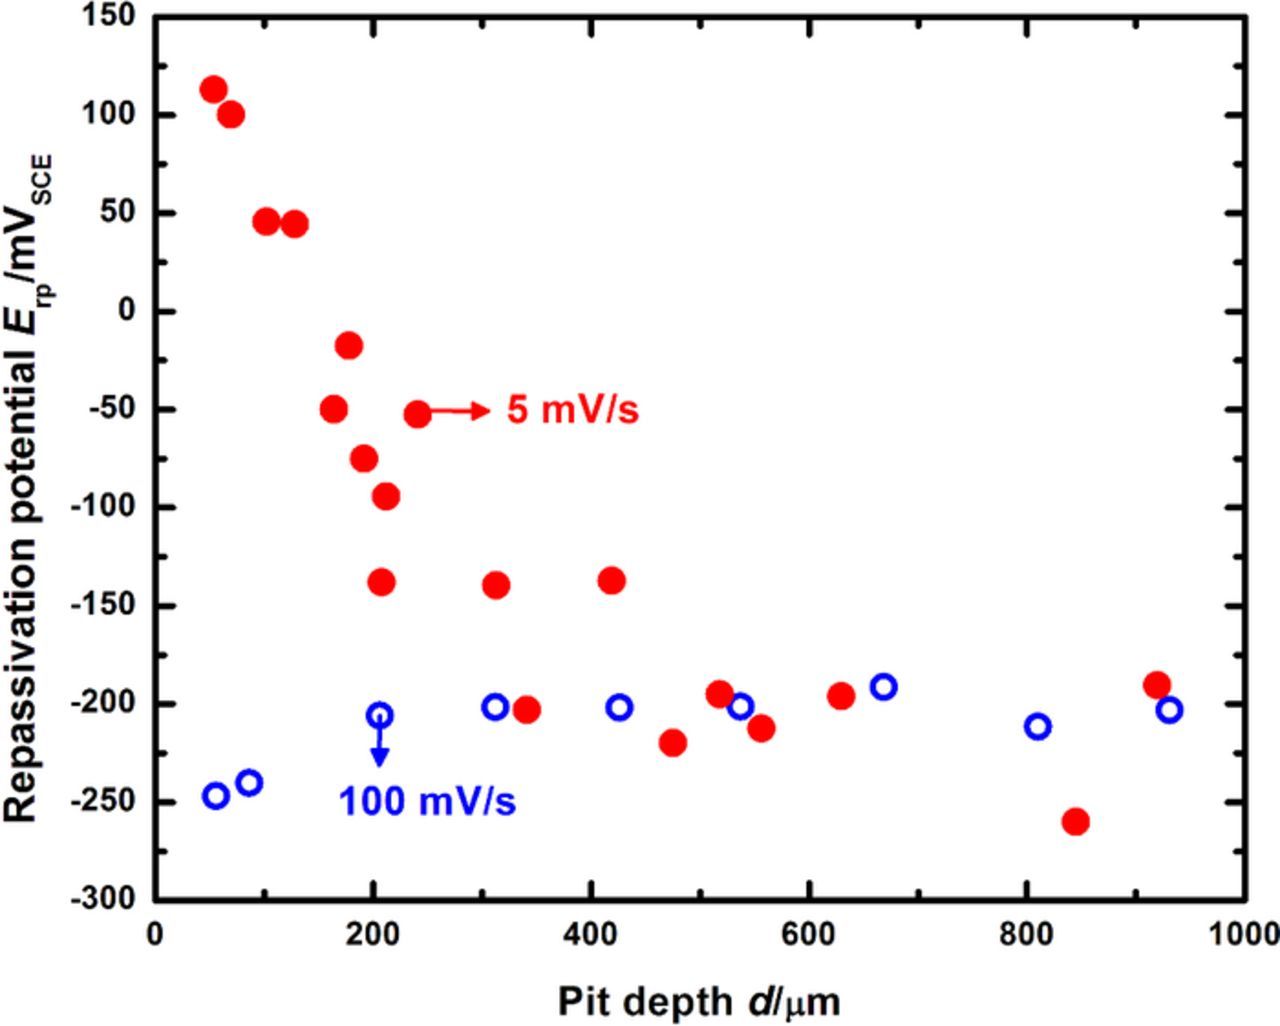
Figure 10. Effect of scan rate on Erp behavior with increasing pit depth.
Criterion of single critical surface concentration valid across most atmospheric conditions
Previous artificial pit studies have shown that (i·x)saltfilm ought to be corrected for the effect of bulk [Cl−],81,82 so that the experimental data may accurately reflect the theoretical 1-D Galvele mass transport formulation based on the cation concentration gradient in the pit.1 The results of this study, interpreted in this context, would therefore indicate that the critical surface concentration for pit stability is independent of the bulk electrolyte. Woldemedhin et al.82 assumed a constant value for D to rationalize the linear relationship observed between (i·x)saltfilm and bulk [Cl−]. Although this assumption simplifies the behavior of the system at high bulk [Cl−], these data may be revisited to investigate the notion that a single critical pit solution chemistry describes pit stability across various bulk chloride compositions. Figure 11 depicts the variation of the pit stability product (in terms of both (i·x) as well as D·C) across a range of bulk [Cl−] up to 5 M. Included in this figure, apart from the replotted (i·x)saltfilm data from Woldemedhin et al.,82 are pit stability product calculations for the following cases:
- Constant D = 8.24 × 10⁻⁶ cm2/s, Csat varies with bulk [Cl−] corrected for the common ion effect via numerical calculations based on the solubility product Ksp = [Me+z] [Cl−]z, as shown by Ernst and Newman for FeCl2.54 The value of Csat at zero bulk [Cl−] is assumed to be 5.02 M, as reported by Isaacs et al. from in situ X-ray studies.88 This value is in close agreement with (i·x)saltfilm values extrapolated to zero bulk [Cl−] reported by Srinivasan et al.81
- Both D and Csat vary with bulk [Cl−]. Calculation of the variation in Csat follows the procedure outlined previously. D is varied based on the change in dynamic viscosity (η) with [Cl−] within the pit44 following the method of Jun et al.84 OLI Analyzer Studio 9.2 is used to calculate the behavior of η in different concentrations of the solutions of interest (NaCl, LiCl, and FeCl3) at 25°C. η varies in the pit as a function of distance from the pit base. The concentrations of the 316L cation and Cl− were fixed at the pit base (C316L = Csat, [Cl−] = z·Csat) and pit mouth (C316L = 0, [Cl−] = bulk [Cl−]). The concentration of the bulk cation was allowed to then vary within the pit under the constraints of electroneutrality. A total pit depth of 500 μm was considered so that the system was definitively under 1-D mass transport in accordance with the work of Srinivasan et al.81
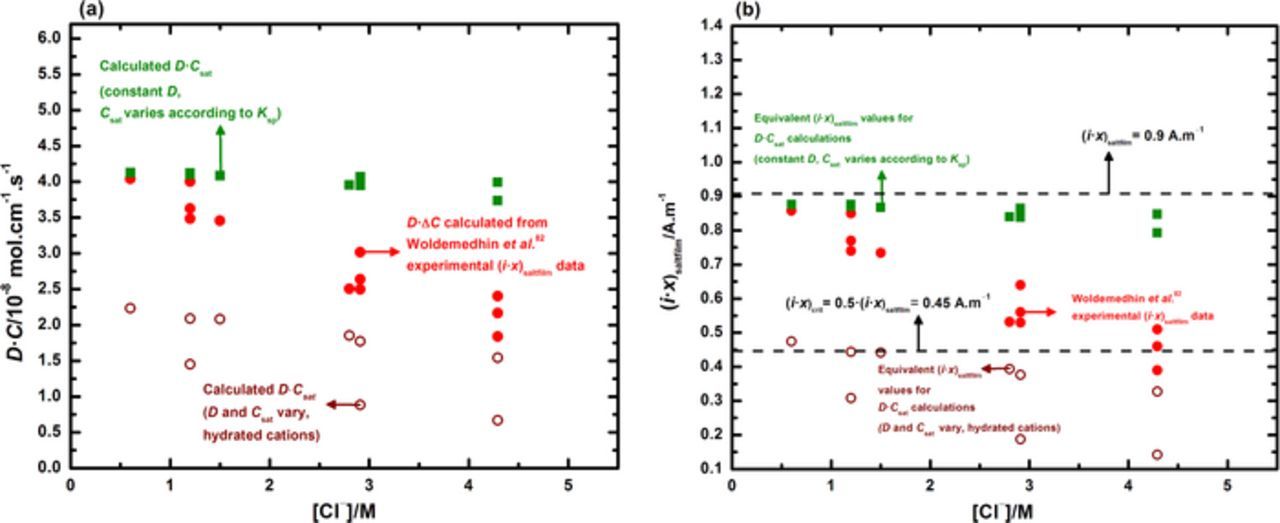
Figure 11. Bulk electrolyte effects on pit stability. Pit stability data are plotted in two equivalent forms: (a) D·C and (b) (i·x). Note that the critical value of f obtained by this study provides a lower bound for the experimental pit stability data up to a bulk [Cl−] of 4 M.
The Stokes-Einstein equation is then used to calculate D as a function of varying η:
![Equation ([9])](https://content.cld.iop.org/journals/1945-7111/163/13/C759/revision1/d0009.gif)
where k is the Boltzmann constant (= 1.38 × 10⁻²³ J. mol−1. K−1), T is the temperature in kelvin (= 298 K), and r is radius of the species whose transport is being considered. Values for the radii of the hydrated cations of iron(II), chromium(III), and nickel(II) were taken from Kielland.89 The radius for a hydrated 316L cation is calculated by weighting the radii of these individual cations in stoichiometric proportion of dissolution, which resulted in a value of 3.32 Å. Although not all cations in solution need exist in the hydrated state, this assumption serves as a reasonable lower bound on the diffusion coefficient obtained via these calculations.
Figure 11a shows that the pit stability data (represented in terms of D·C) at low bulk [Cl−] is well approximated by the assumption of constant D. The experimental data at high bulk [Cl−] is observed to be described well by the diffusion behavior of hydrated cations in concentrated solution. Figure 11b shows the same pit stability data as Figure 11a, but instead plotted in terms of (i·x). The value of (i·x)crit obtained from this study (corresponding to 50% of saturation of cation) is observed to be a valid lower bound on the pit stability data. These results therefore suggest that anodic stability criteria across a range of bulk chloride concentrations can be described by a single critical value. Depending on the influence of the common ion effect arising from the contribution of the bulk electrolyte to the solubility of the cationic chlorides, the critical value of 50% may lead to the precipitation of a salt film, particularly at high bulk [Cl−]. These results are in good agreement with the trends reported by Laycock et al.,55 which state that ET (the lowest potential at which the salt film is stable) decreases with increasing bulk [Cl−]. It would seem therefore, that for sufficiently high bulk [Cl−], the surface condition corresponding to the transition between active dissolution and repassivation may correspond to a salt film but with the cation concentration lower than 100% saturation.
Conclusions
A comprehensive quantitative framework to assess the electrochemical factors critical to both pit stability and repassivation was developed using artificial pit experiments and mass transport modeling. The artificial pit experiments informed a one-dimensional diffusion model by providing electrochemical parameters describing the dissolution flux and the repassivation potential in terms of the pit depth. Results from the model ascertained 50% of the cation concentration at saturation as the critical value of the chemistry of the actively corroding surface for the onset of repassivation. This critical value was determined to be a conservative lower bound for different boundary conditions. In this manner, the study quantitatively established that the same critical factors described both pit stability and repassivation by evaluating them via a unified methodology. Analysis of published pit stability data was extended to investigate the idea emerging from this work that a single critical surface concentration, independent of bulk environment, governed anodic dissolution during pitting. The rationale provided by this interpretation was demonstrated to account for the apparent dependence of the measured pit stability product on bulk [Cl−]. These results also indicate that the critical pit solution chemistry, calculated based on the cation concentration gradient, was constant for a range of [Cl−] up to 4 M.
Acknowledgments
Financial assistance from the Office of the Undersecretary of Defense Technical Corrosion Collaboration via the United States Air Force Academy Contract FA7000-10-2-001 is gratefully acknowledged. Assistance provided with modeling the diffusion equation with the constant flux boundary condition by Prof. William C. Johnson, Department of Materials Science and Engineering, University of Virginia, is appreciated. Modeling assistance with the time-dependent flux boundary conditions was provided by Chao Liu, Center for Electrochemical Science and Engineering, University of Virginia.
Footnotes
- a
This value falls within the range of the values of 7 × 10⁻⁶ cm2/s to 1 × 10⁻⁵ cm2/s reported for D in the literature.54,82–84 Also, using a constant diffusivity has been shown to approximate to a good degree the combined effects of variable diffusivity and electromigration on the flux of the system.4,7,85