Abstract
One-dimensional mass transport model calculations were utilized to design experiments with stainless steel artificial pit electrodes to determine the critical concentration of cations at the corroding surface representing the transition between stable pitting and repassivation. Rapid polarization scans following salt film precipitation and consequent open circuit dilution to different surface concentrations permitted the evaluation of kinetics at various degrees of saturation. These experiments showed a distinct change in kinetics as the surface concentration decreased, thus identifying the critical pit chemistry for the onset of repassivation. Chemical modeling of oxide precipitation from solution permitted the investigation of oxide nucleation across varying surface concentration as a function of pH as the cause of repassivation. This analysis enabled the estimation of the pH at which the first oxide would precipitate in the critical pit solution chemistry, which when combined with cation hydrolysis calculations, resulted in the evaluation of the critical pH at the transition between pit stability and repassivation. A mixed potential theory-based analysis of these results was utilized to provide mechanistic support to the quantitative framework describing critical factors for pitting stability and repassivation.
Export citation and abstract BibTeX RIS

This is an open access article distributed under the terms of the Creative Commons Attribution 4.0 License (CC BY, http://creativecommons.org/licenses/by/4.0/), which permits unrestricted reuse of the work in any medium, provided the original work is properly cited.
The chemistry of the corroding surface of an active pit is often characterized in terms of the concentration of the cations produced by dissolution and the acidic pH that results from their subsequent hydrolysis.1–7 Efforts to determine the critical concentration of metal cations required to sustain pitting have included direct in situ methods,4,8–10 electrochemical measurements in simulated pit solutions,4–6,11,12 as well as artificial pits.13–17 Invasive interrogation techniques result in the perturbation of the corroding solution which introduces additional mass transport, thereby complicating the interpretation of the resulting information.7,18 Kinetics measurements in simulated solutions require some approximation of the pit chemistry in terms of the species involved and their concentrations.12,19,20 Experiments based on the artificial pit technique possess an advantage over other methods because of the simplicity of their construction and access of the chemistry at the actual corroding surface via the associated potential and current density. Use of the lead-in-pencil artificial pit geometry in particular has been successful in estimating surface concentrations from the dissolution flux via one-dimensional mass transport analyses.16,21–29 The critical value of this concentration – below which the pit is no longer stable and begins to repassivate – remains a topic of debate. Opinion is divided16,22–26,30–37 over whether or not a salt film (and as a result, a solution at 100% saturation) is a necessary requisite for pitting to stably proceed.
In any case, the loss of the critical solution chemistry is expected to be accompanied by a rise in local pH due to the decrease in metal dissolution rate and subsequently diminished cation hydrolysis.5,38 Several authors have reported that high concentrations of Fe, Ni, and Cr result in an increase in H+ activity, resulting in a lower pH in the pit.5,6,39–43 Oldfield and Sutton6 formulated an empirical relationship between the measured pH in stainless steel pit solutions and the concentration of cationic chlorides, which was primarily based on the hydrolysis of CrCl3. Experimental measurements have resulted in a range of pH for stainless steel pits with values from −0.13 to 2.3 being reported.4,7,9,11,41,44,45 It must be noted however, that these studies investigated dissolution in highly concentrated pit solutions (close to saturation). The selected chemistries were obtained either by the application of high potential or experimentally simulated as an aqueous mixture of dissolved cationic chlorides. Long-term testing of stainless steel crevices has recorded pH values between 2 and 3.46 However, these estimates have not been quantitatively examined in the context of critical conditions associated with the transition from pit stability to repassivation. Attempts to investigate these conditions in concert have been impeded by the aforementioned difficulty in accessing occlusions without solution perturbation.7,18
Suzuki and Kitamura38 noted that for repassivation to occur, the local cathodic reaction inside the pit must play a role in increasing the pH beyond a critical value, concomitant with a decrease in the surface concentration. The influence of the local cathodic reaction on the chemistry of the corroding surface has been discussed in a number of studies relating to stainless steel crevice corrosion and crack tip electrochemistry.7,47–50 The basis for this argument emerges from charge conservation: the anodic dissolution current must be balanced by cathodic currents from both the external cathodic reaction on the surface exposed to the bulk solution and the internal cathodic reaction at the pit base. Owing to the anoxic conditions within the pit, the local cathodic reaction is typically the hydrogen evolution reaction (HER) via the reduction of water or protons, which contributes hydroxyl ions (or equivalently, consumes H+), thus causing the pH at the corroding surface to rise. It stands to reason therefore, that any consideration of the chemistry at repassivation has to include the effect of the local HER.
On the basis of thermodynamic calculations, Okada51 posited that repassivation occurred as a result of the nucleation of a protective oxide in competition with the stability of a hydrous salt film. The general repassivation model developed by Anderko and coworkers52–56 was founded upon this view. However, the authors assumed the surface condition at repassivation to be at or near saturation. The relationship between the critical potential that described the corroding surface at repassivation (Erp, the repassivation potential) and the actual local chemistry was not quantitatively examined with respect to whether such conditions would in fact result in oxide nucleation. Furthermore, although the Erp has been defined as the potential below which no further pitting takes place, its experimental measurement has been based on a user-selected current density. Multiple values for this current density have been utilized in the literature,19,20,52,57–60 from 1 μA/cm2 to 100 μA/cm2; however, a quantitative argument justifying this choice with respect to the chemistry at the repassivating surface has not been presented.
Recently, Srinivasan et al.26–29,37 have discussed the utility of using the artificial pit technique to probe critical conditions that govern the transition from stable pitting (active dissolution) to repassivation. These studies described a framework that utilized mass transport modeling to quantitatively connect measured estimates of both the Galvele14 pit stability product (i·x) and long-term Erp,19 which resulted in a methodology to evaluate the degree of saturation at the corroding surface as the pit approaches repassivation. These results were also applied in combination with pit stability data in concentrated chlorides25,35,36,61 to gain a better understanding of the anodic stability criteria for stainless steel pitting in atmospheric conditions.
The work presented in this paper focuses on incorporating the local chemistry of the corroding surface into this paradigm for critical pitting factors. Artificial pit data at successively dilute surface concentrations are examined for a transition in surface kinetics from dissolution to repassivation. Chemical modeling using concentrated solution thermodynamics is utilized to simulate both electrochemical processes occurring at the corroding surface – anodic dissolution as well as the local HER. This procedure permits the systematic study of the tendency of oxides to spontaneously precipitate from solutions corresponding to varying local chemistry, thereby enabling the evaluation of a critical pH that results in repassivation via oxide nucleation. These efforts are directed toward employing the critical pH as a physical basis for repassivation and developing a mechanistic foundation for the reported quantitative framework describing pit stability and repassivation.
Experimental
Mass transport modeling
The diffusion equation was solved for a one-dimensional pit configuration, applying the boundary condition of zero flux at the corroding surface. The schematic of this mass transport model is shown in Figure 1; the model itself has been discussed in detail by Srinivasan et al.29,37 This solution yields an expression for surface concentration as a function of time and pit depth (d) for a given value of the diffusion coefficient (D). The dilution time (tf) for a metal cation at the corroding surface from a saturated condition was then calculated for different values of the surface concentration (indicated by f, the fraction of concentration at saturation) using the following expression:
![Equation ([1])](https://content.cld.iop.org/journals/1945-7111/163/13/C768/revision1/d0001.gif)
This expression for tf was derived by truncating the first term of the series obtained as the solution for f. The value used for D (=8.24 × 10⁻⁶ cm2/s) was taken from studies on one-dimensional pitting in the literature.16,20,22,25 The time to dilute the surface concentration from 100% saturation to lower fractions (tf) was calculated for various pit depths. These values were then utilized in the setup of the artificial pit electrochemical technique as will be described.
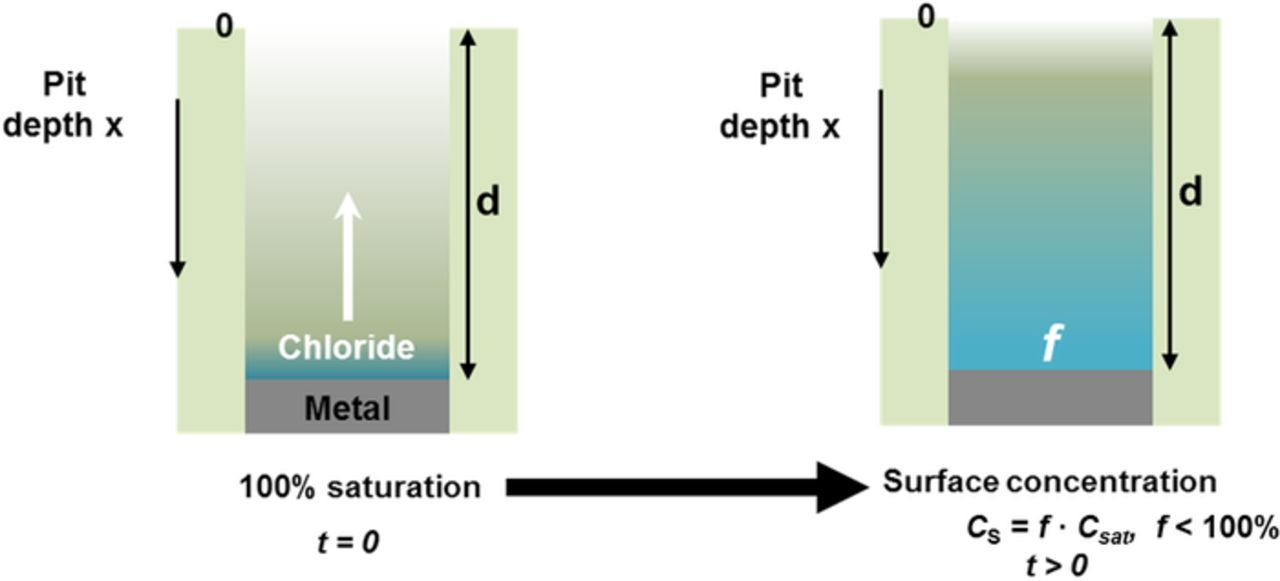
Figure 1. Schematic depiction of one-dimensional pit modeled. The one-dimensional diffusional characteristics of the system were considered along the x-axis as indicated.
Artificial pit experiments
One-dimensional artificial pit (lead-in-pencil) electrodes were constructed from 316L stainless steel wires (California Fine Wire Company, Grover Beach, CA) of diameter 50.8 μm embedded in epoxy. The composition of the wires used is shown in Table I. Once prepared, the electrode surface was polished to a finish of 320 grit with SiC abrasive paper. The electrode, with an exposed area of 2.03 × 10⁻⁵ cm2, was then placed upright in a test cell containing 0.6 M NaCl solution. A saturated calomel electrode (SCE) and a platinum mesh were employed as the reference electrode and counter electrode, respectively. All tests were performed at an average ambient temperature of 22°C using a Bio-Logic SP-200 (Bio-Logic SAS, Claix, France) potentiostat.
Table I. Composition of 316L (Fe, Ni, Mo, and Cr contents marked in bold) wire employed in study. All values in weight per cent. Composition provided by vendor was confirmed by quantitative speciation using inductively coupled plasma optical emission spectroscopy (ICP-OES).
| Alloy | C | Mn | P | S | Si | Cr | Ni | Mo | N | Cu | Fe |
|---|---|---|---|---|---|---|---|---|---|---|---|
| 316L | 0.019 | 1.356 | 0.030 | 0.0287 | 0.406 | 17.07 | 10.66 | 2.16 | 0.0499 | 0.232 | 67.98 |
The artificial pit was initiated following a potentiostatic hold at +750 mVSCE for a short duration (2 to 5 minutes) and propagated to a depth of 1000 μm under a salt film via a second potentiostatic hold at +450 mVSCE. This depth was chosen to ensure definitive one-dimensional mass transport, as demonstrated by Srinivasan et al.29 Following the second potentiostatic hold, the pit was allowed to dilute from 100% saturation to different fractions under open-circuit conditions based on the time to dilution (tf) calculated using Eq. 1. A rapid anodic polarization scan at 100 mV/s from open circuit to a final potential of +450 mVSCE was performed once each surface concentration was attained. A potentiostatic hold at +450 mVSCE ensured that salt film was re-precipitated prior to each successive dilution so that the surface condition would be reinitialized to 100% saturation. The duration of each of these potential holds was very brief (≈2 to 5 minutes), and therefore did not result in any substantial additional pit growth. In this manner, anodic kinetics data were extracted at each surface concentration, thereby permitting the systematic examination of the local conditions in the pit as they varied from active dissolution to repassivation.
Chemical solution modeling
The local chemistry of the corroding pit surface was modeled using the solution thermodynamics database of the OLI Analyzer Studio 9.2 (OLI Systems, Inc., Cedar Knolls, NJ) software. The saturated solution of FeCl2, CrCl3, NiCl2, and MoCl3 was simulated as a mixture of the four salts in stoichiometric proportion assuming congruent dissolution of Fe, Cr, Ni, and Mo for 316L corroding in sodium chloride at a temperature of 25°C and a pressure of 1 atm. The chemistry resulting from anodic kinetics with increasing dilution was simulated by successively decreasing the concentration from saturation while maintaining the stoichiometric proportion of the salts. The equilibrium pH of the modeled solution at each surface concentration was then calculated. The range of surface concentration chosen spanned from 5% to 85%. Surface concentrations outside this range were excluded because calculations resulted in pH estimates that caused the spontaneous precipitation of either CrO(OH) (at f < 5%) or FeCl2 (at f > 85%), which disturbed the stoichiometric proportion.
The local cathodic reaction (HER) was modeled via what amounts to an artificial titration at each successive dilution of the metal ion concentration at saturation (described previously as a mixture of the four cationic chlorides in stoichiometric proportion) from pH 0 to pH 8. As the rate of HER at the corroding surface increases, a simultaneous increase in pH at the surface would occur. To simulate this effect in the concentrated solution modeling, acid (introduced as HClO4) or alkali (introduced as LiOH) was added to the solution of interest. These species were chosen based on the fact that they would not interfere with the results by way of a common ion effect on the cationic chlorides generated from the stainless steel. Different oxide species were estimated to spontaneously precipitate depending upon the pH modeled in this manner. These oxides were identified upon precipitation as the pH was increased with the surface concentration of metal cation remaining constant. These estimates were performed across a range of surface concentration from f = 5% to f = 75%. Concentrations greater than f = 75% were excluded because these values resulted in FeCl2 precipitating prior to any oxides.
Results
The anodic kinetics for 316L obtained at increasingly dilute surface concentrations are shown in Figure 2. A distinct transition in kinetics is observed as the pit dilutes to successively lower concentrations. At an intermediate surface concentration corresponding to 55% of saturation, an active-to-passive transition is seen in the polarization curve, marking the onset of repassivation. These results agree with the estimate of critical surface concentration obtained in previous work by Srinivasan and Kelly.37 Figure 3 displays the results of that process of estimation via the superimposition of the two pit depth-dependent parameters, Δt and Erp. The time required for the potentiostat to scan from the lowest potential that permits a salt film is present (i.e., ET) to the measured Erp is denoted as tact. The difference between this time and the time to dilution to a given fraction of saturation f (i.e., tf) is denoted Δt (Δt = tact − tf). A series of curves is therefore obtained corresponding to different values of final surface concentration in terms of f. The surface concentration for which the depth corresponding to Δt = 0 is the same as the depth at which Erp begins to approach a plateau,19,27,28,36,58 is chosen as the critical surface concentration value. The estimate for 316L in 0.6 M NaCl was observed to be conservatively 50% of saturation. Another means of assessing the appropriateness of this value of f is via an examination of the transient behavior of open circuit potential (EOCP) in the pit solution as the pit dilutes. The data of EOCP for dilution to each surface concentration is plotted against time and the corresponding calculated value of f in Figures 4a and 4b respectively. These data support the estimate of the critical value of surface concentration obtained by Srinivasan and Kelly37 because the EOCP rises slowly with time (as shown in Figure 4a) once the pit has diluted to at least 55%. This rise is indicative of the repassivation of the steel surface. Similar EOCP behavior with time in stainless steel pit solution has also been observed by Suzuki and Kitamura.38
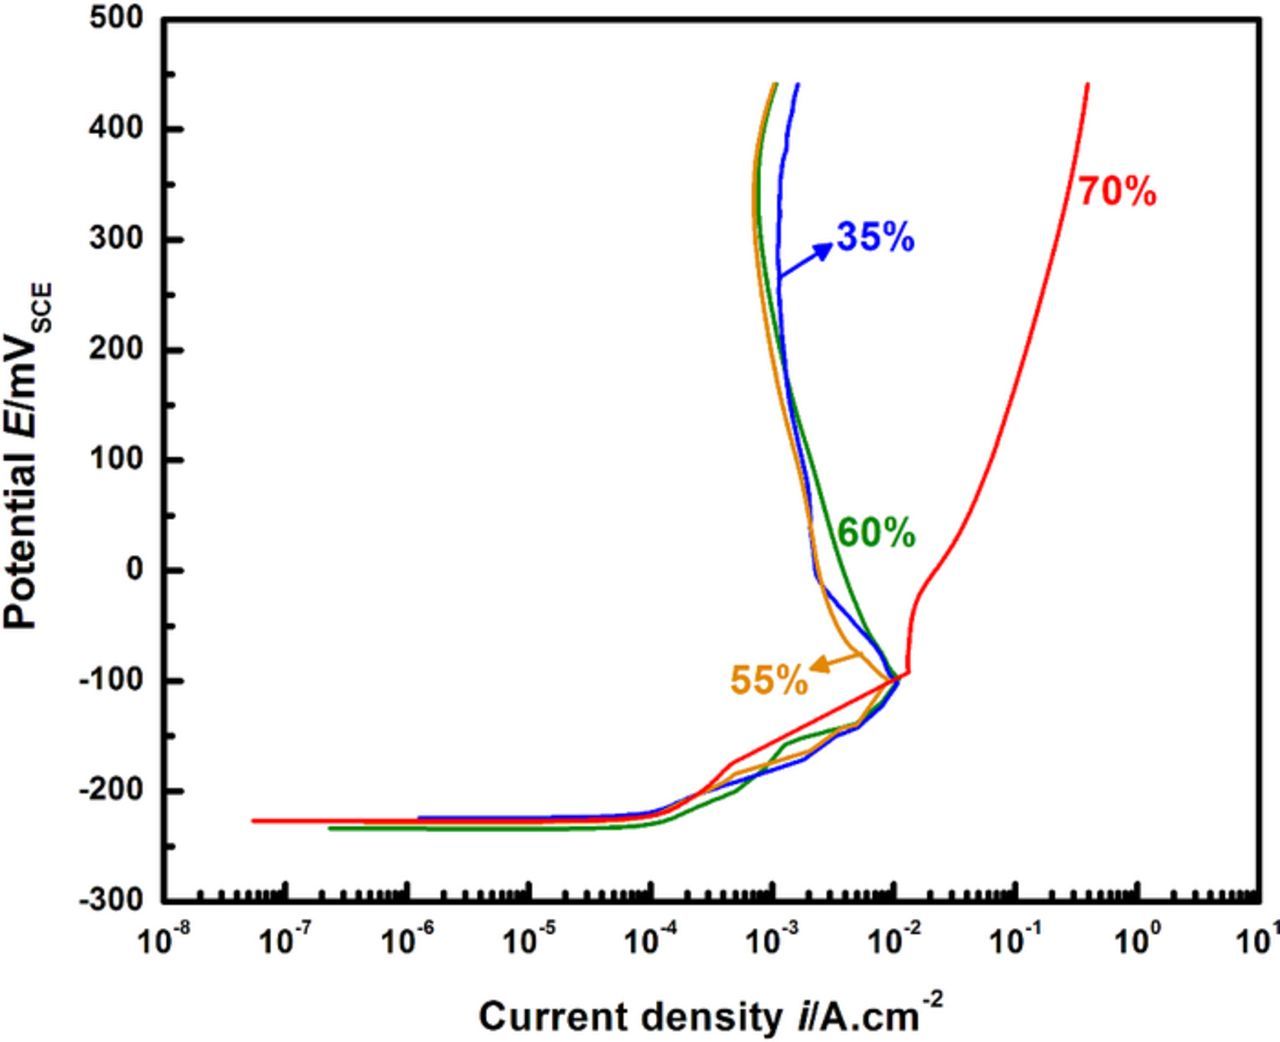
Figure 2. Results from anodic scans at successive dilution. Note the active-passive transition that emerges for 316L at concentrations lower than 60%, marking the change from active dissolution to repassivation.
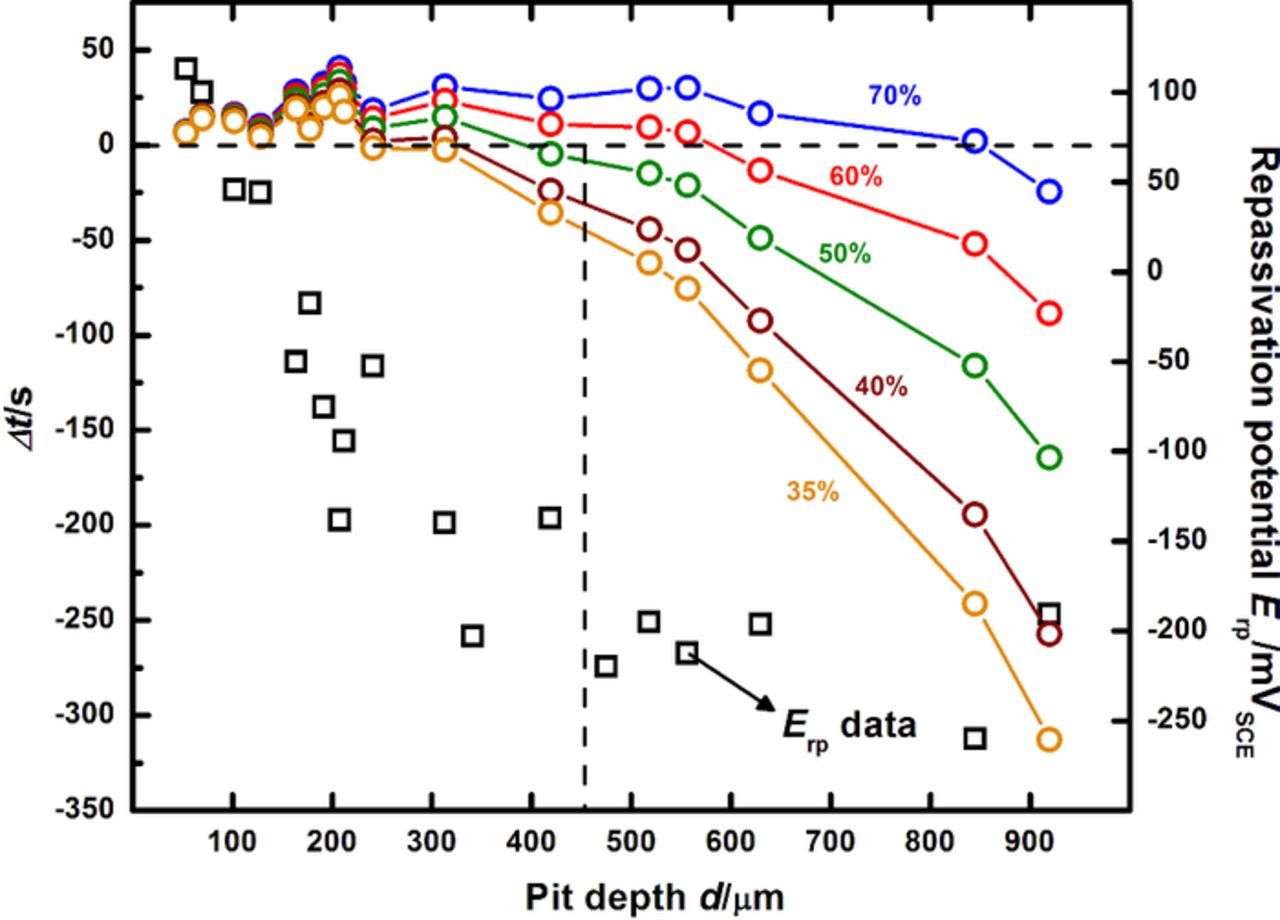
Figure 3. Estimation of concentration of metal cations at the corroding surface as the 316L pit transitions from stability to repassivation (replotted from Srinivasan and Kelly37). The data points represented as squares are the measured Erp values at each pit depth. The curves indicated by the connected circles denote at each pit depth Δt, the difference between the time provided for the instrument to scan between surface conditions where the salt film is present to that represented by the Erp. The vertical line at about 500 μm serves to indicate the depths at which Δt = 0 and the start of the Erp plateau coincide. The surface concentration associated with this depth therefore denotes not only an intermediate steady-state chemistry where dissolution and diffusion fluxes are equal but also that the potential describing this surface condition characterizes repassivation. The plot therefore conveys an approach to determine the critical surface concentration describing the transition between pit stability and repassivation. Note that this estimate of 50% of saturation serves as a conservative bound for the surface concentration at which the transition in anodic kinetics (active to passive) is observed for the data in Figure 2.
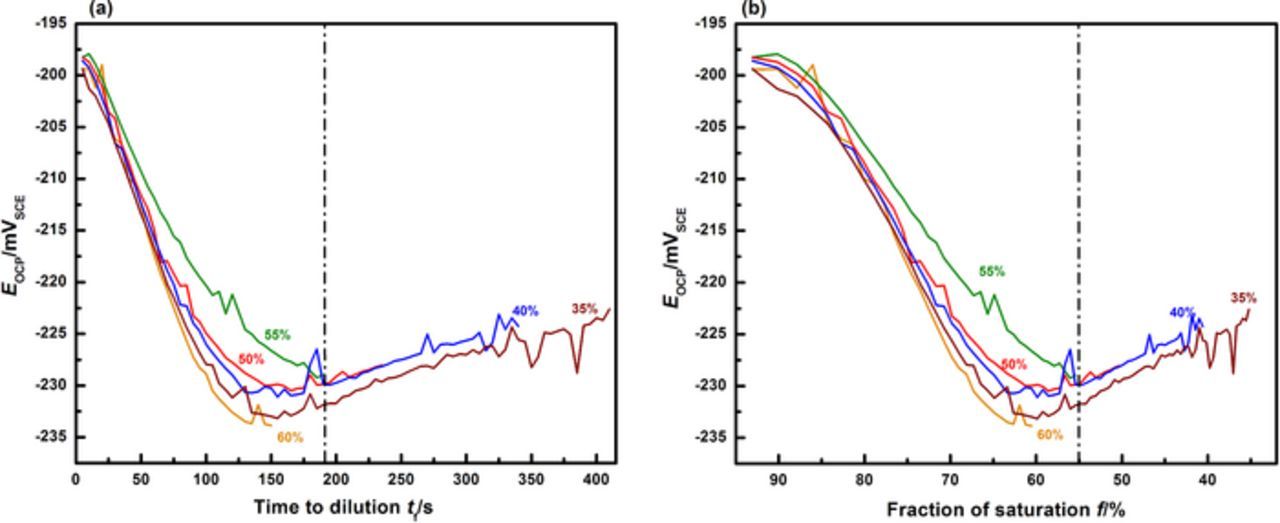
Figure 4. Open-circuit potential (EOCP) measurements prior to polarization scans at successive dilutions following re-precipitation of salt film. The percentages denoted indicate the fraction of saturation to which the corroding surface dilutes to at the end of the measurement. (a) EOCP variation with time. (b) EOCP variation with time replotted in terms of the instantaneous fraction of saturation. The dashed vertical lines in both plots indicates 55% of saturation – the EOCP decreases until at least this value is reached before beginning to gradually rise, suggesting the onset of repassivation.
Figure 5 shows the pH values calculated using the chemical solution model considering only anodic dissolution. This plot is also representative of simulated pit solutions prepared by mixing the respective cationic chloride salts in stoichiometric proportion in water which represent the condition with no cathodic reaction within the pit – as would be expected at high anodic dissolution rates. The solution pH increases gradually from values close to −0.25 for the most concentrated solutions considered (f = 75%) to 2.8 for the highest level of dilution considered (f = 5%), a change of nearly three orders of magnitude in H3O+ activity. These results are consistent with those obtained via the empirical relationship between cationic chloride concentration and pH reported by Oldfield and Sutton.6
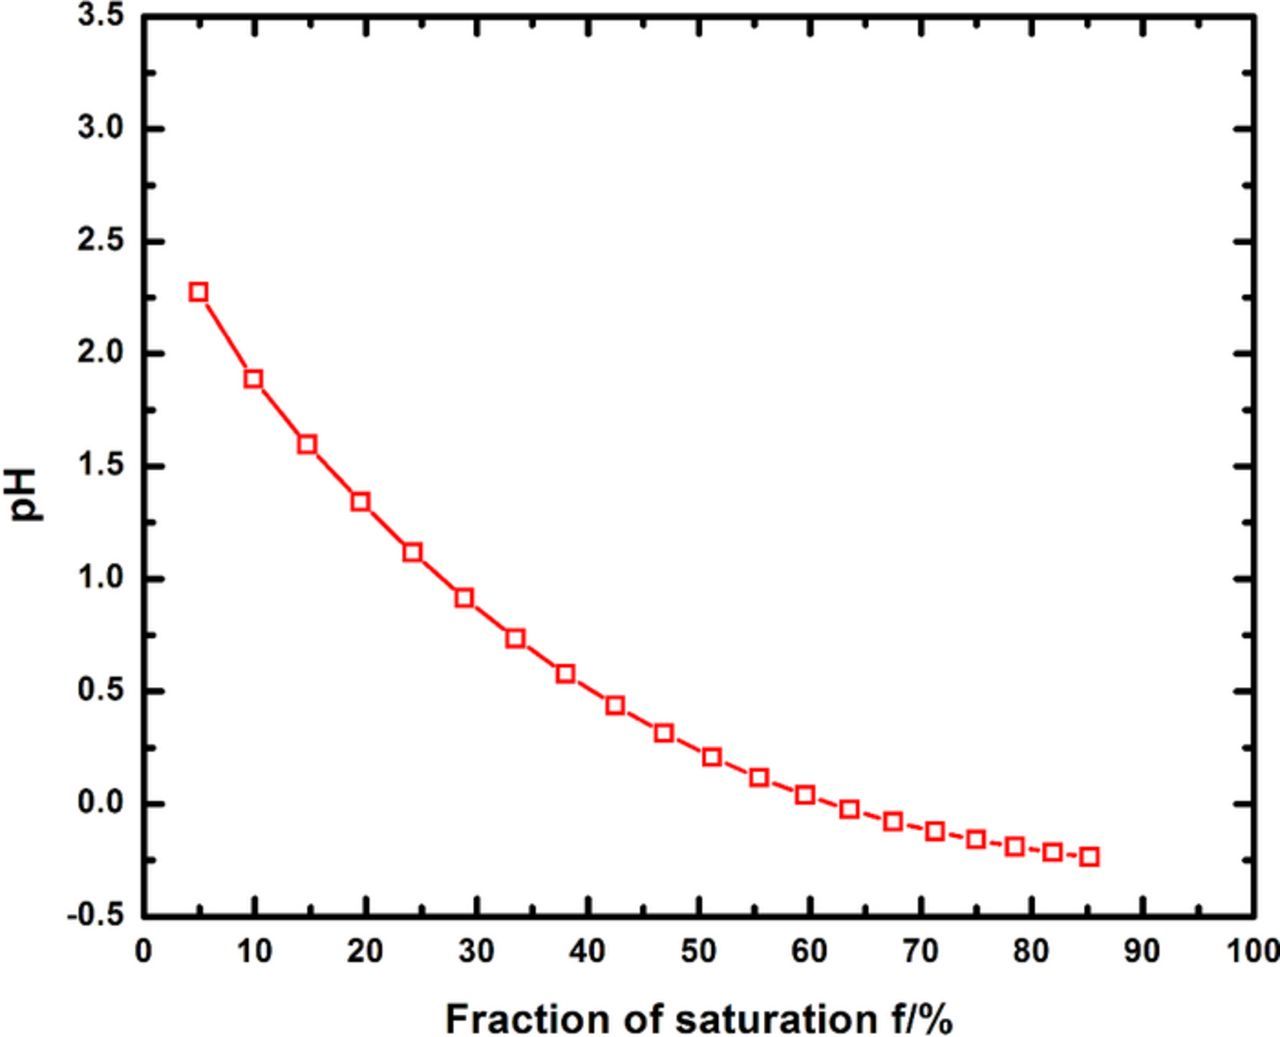
Figure 5. Calculated equilibrium pH resulting from chemical dissolution of cationic chlorides in stoichiometric proportion.
Discussion
The results from experiments and modeling in this study were amalgamated to investigate the influence of the local cathodic reaction on repassivation. Solution modeling was utilized to survey the effect of the local cathodic reaction on the pH of the corroding surface at successive dilution, permitting the estimation of the pH at which the first oxide nucleated at each surface concentration. Anodic kinetics provided the estimate of critical surface concentration, and in this chemistry, the critical pH was that value at which oxide precipitation occurred. Finally, employing the critical pH as a criterion for repassivation, the validity of the quantitative framework connecting critical factors for pitting stability was examined using mechanistic arguments based on mixed potential analysis of dissolution and HER kinetics.
Local cathodic reaction can result in pH rise which initiates repassivation
As outlined in the introduction, anoxic conditions result in the HER as the primary cathodic reaction inside the pit. The HER acts as a source of OH− (or equivalently, a sink for protons) which affects the pH at the corroding surface. The influence of this change in pH on the transition from active dissolution to repassivation can be investigated in terms of the reaction equilibrium of cation hydrolysis. This approach is analogous to the rationale of Galvele and coworkers62,63 that has considered the effect of OH− from the bulk solution on passivity breakdown. The following reactions summarize the processes that occur.
At the localized corrosion site:

where Me+z represents the '316L cation', a stoichiometric proportion of Fe+2, Cr+3, Ni+2, and Mo+3; z = 2.2 as has been utilized in several studies.16,23,28,36,59


The two preceding expressions denote a series of hydrolysis reactions which are dependent on the valence (z) of the 316L cation defined previously. The valence z determines the extent of completeness of hydrolysis, i.e. as pH increases, a greater availability of OH− leads to the cation being hydrolyzed closer to completion.
Internal (local) cathodic reaction (assuming HER):
(which may be expressed equivalently as 2H+ + 2e− → H2 to emphasize proton consumption)
Away from the localized corrosion site:
External cathodic reaction (assuming oxygen reduction):
The external cathodic reaction will occur on either the counter electrode (in the case of samples polarized in a three-electrode setup with a potentiostat) or on the boldly exposed surface. Regardless of the nature of this external cathode, its consideration in this treatment is only as a sink of electrons, i.e. it does not affect the local chemistry of the dissolution site because it is spatially distant. On the other hand, the internal or local cathodic reaction influences local dissolution chemistry because it occurs on the corroding surface, as well as functioning as an electron sink.
When anodic dissolution occurs at high rates (as observed at high potentials where salt film precipitation may occur), the local HER is suppressed. However, once potentials close to repassivation are approached, the local cathodic reaction rate increases as the anodic dissolution rates simultaneously decrease. This increase in the local cathodic reaction rate also indicates that its contribution toward the total cathodic current (which balances the total current from anodic dissolution) increases. This relationship is schematically shown in Figure 6.
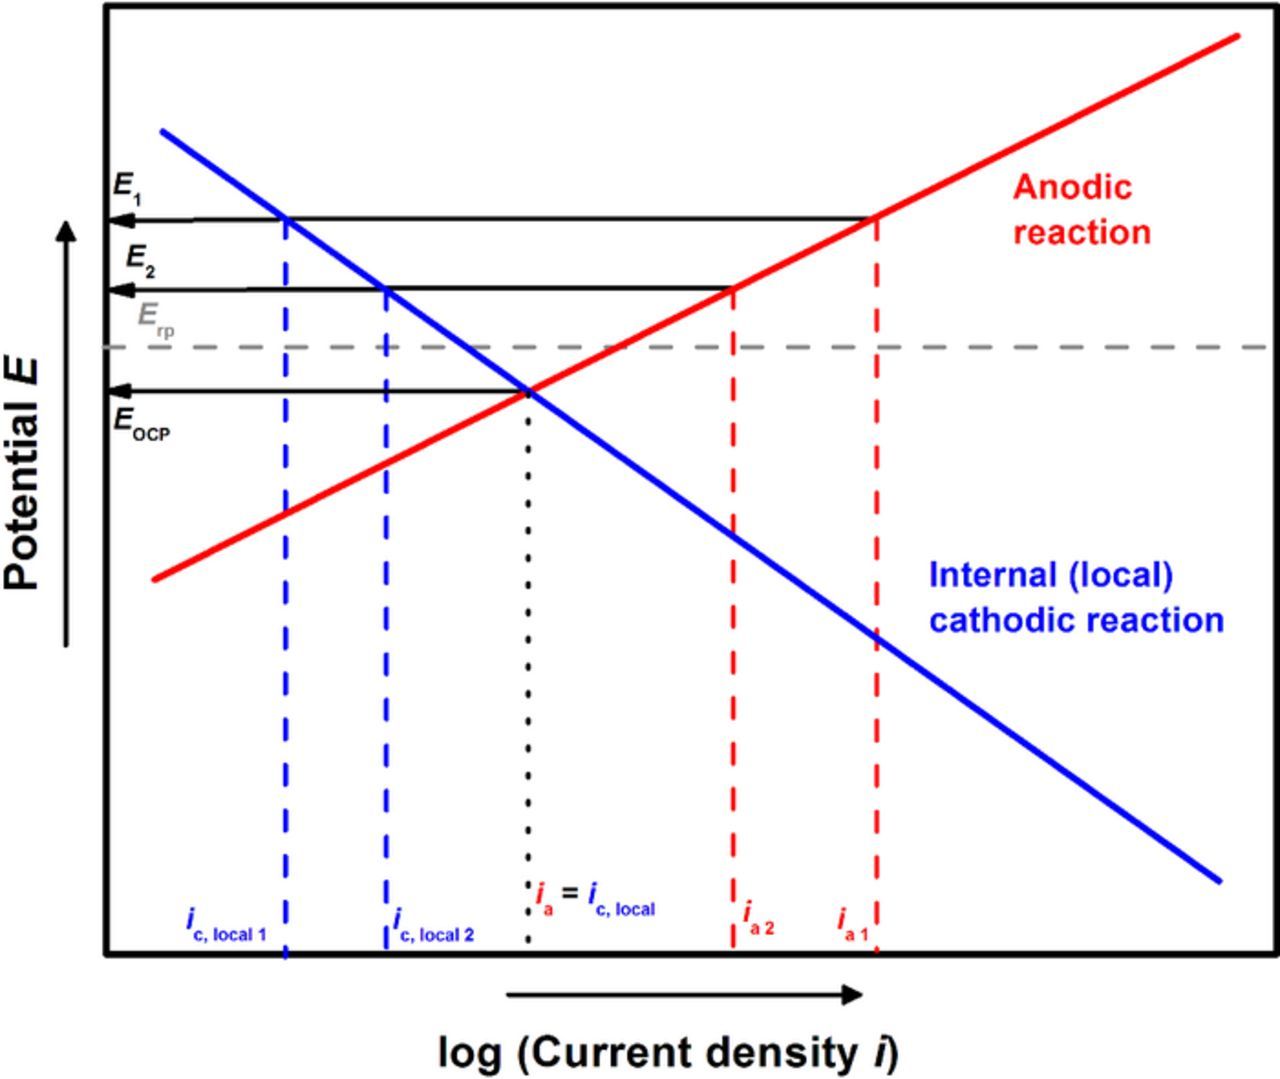
Figure 6. Schematic representation of the increasing influence of the local cathodic reaction toward balancing the current from anodic dissolution, as potentials close to repassivation are reached.
The influence of the local cathodic reaction on pH can be examined in the context of the extent of cation hydrolysis, which is quantitatively expressed as the number of hydroxyl ions consumed per cation produced from dissolution. This extent of hydrolysis is limited by the valence of the cation. For a given chemistry, the extent of hydrolysis of the cation produced by dissolution is determined by the availability of OH−. The rate of the local HER determines the availability of OH−, which can quantitatively be described by the pH. In this manner, the pH can be related to the local HER rate.
Applying this rationale to the electrochemical processes at the corroding surface, hydrolysis of every cation produced by dissolution to the limit set by its valence necessitates that the anodic dissolution current demand is satisfied entirely by the local cathodic reaction. Once the anodic current is completely balanced by the local cathodic current, the driving force for corrosion provided by the external cathodic reaction (galvanic separation) disappears. The extent of cation hydrolysis as an indicator of the effect of the local cathodic reaction on pit chemistry therefore also provides an estimate of its contribution toward satisfying the total anodic current.
Assuming congruent dissolution for the stainless steel, the Fe+2, Cr+3, Ni+2, and Mo+3 ions would be present in the solution according to the stoichiometric ratios as their respective elements in the alloy. Similarly, the hydrolysis of the 316L cation can be considered to be based on the three respective metal cations Fe+2, Cr+3, Ni+2, and Mo+3 following the same stoichiometry. Therefore, the extent of the hydrolysis for the stainless steel can be modeled as a linear combination of the hydrolysis of each cation weighted according to the proportions determined by stoichiometry. The resulting pH from such a combined hydrolysis can then be calculated.
Figure 7 illustrates these calculations for Fe+2, Cr+3, Ni+2, and Mo+3 as well as for 316L. Values for the hydrolysis equilibrium constants for Fe+2, Cr+3, and Ni+ were taken from Baes and Mesmer.64 Hydrolysis data for Mo+3 were provided by the work of Anderko et al.65 At acidic pH, the low availability of hydroxyl ions results in very few of these ions being consumed per cation produced. Conversely, when alkaline pH values are approached, the higher availability of OH− accelerates their consumption in order to maintain equilibrium. The pH that results when a cation is hydrolyzed to the full extent of its valence can also be estimated from the plot. As is seen in the figure, this value is about 6 for Mo+3. The plot also permits the evaluation of the extent of cation hydrolysis at any given pH. For example at pH 7, 2 hydroxyl ions are consumed per Cr+3 ion, implying that the cation is hydrolyzed to 66% of the limit set by its valence. From Figure 7, it is evident that the hydrolysis behavior of the 316L is influenced primarily by Cr(III) and Mo(III) at acidic pH, whereas the effects of Fe(II) and Ni(II) start becoming prominent as the pH becomes more alkaline.
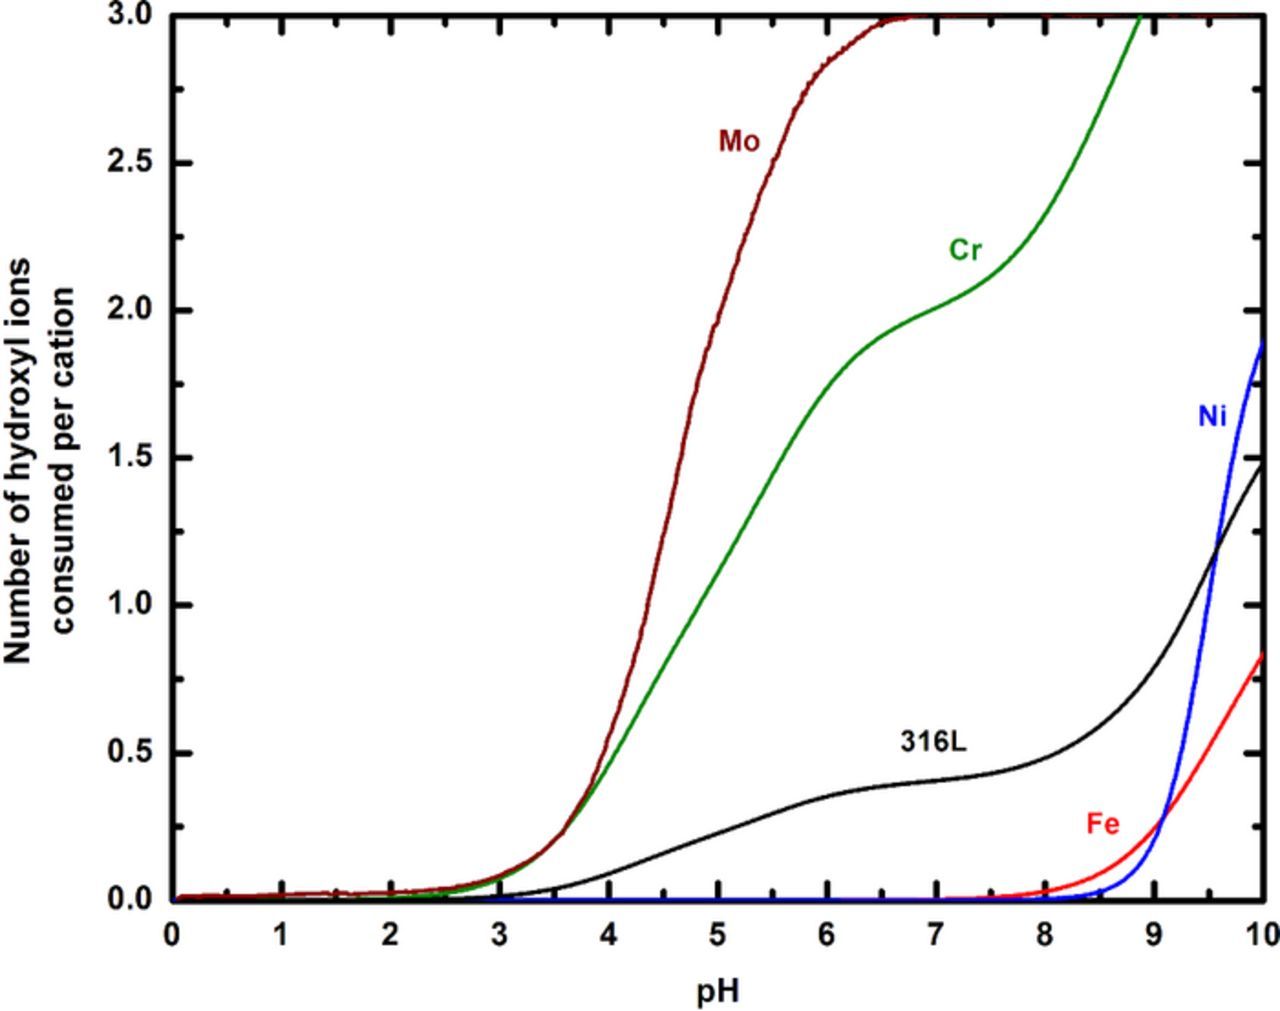
Figure 7. Relationship between increasing availability of hydroxyl ions and the pH, represented by the calculations of the extent of cation hydrolysis. The extent of hydrolysis progresses toward completion (number of OH− per 316L cation = cation valence) as more hydroxyl ions are available, which is equivalent to a higher pH. Note how the presence of Cr and Mo in the alloy biases its hydrolysis behavior toward lower pH values.
These results can be interpreted within the context of localized corrosion in terms of the contribution of the local cathodic reaction in satisfying the anodic current, as has been outlined previously. The local cathodic reaction rate determines the availability of OH− within the pit. Therefore, the extent to which a cation produced by anodic dissolution is hydrolyzed depends on the rate of the local HER. A higher local HER rate would result in greater OH− availability and consequently, the cation would be hydrolyzed closer to completeness as defined by its valence, resulting in a higher pH.
Figure 8 illustrates the relationship between the fraction of anodic current balanced by the local cathodic current and pH. The plot shows that when only a very small fraction of the anodic current is satisfied by the local cathodic reaction, low pH values result. In the case of localized corrosion, the remainder of the anodic current is balanced by the external cathodic reaction, which being galvanically separated from the anode, has no effect on the chemistry of the corroding surface. However, as potentials closer to Erp are approached, the local cathodic reaction rate increases (Figure 6). This increase would result in a greater fraction of the anodic current demand being satisfied by the local HER, leading to a rise in pH according to the plot in Figure 8. In this manner, a quantitative relationship is established between the pH of the corroding surface and the electrochemistry associated with repassivation.
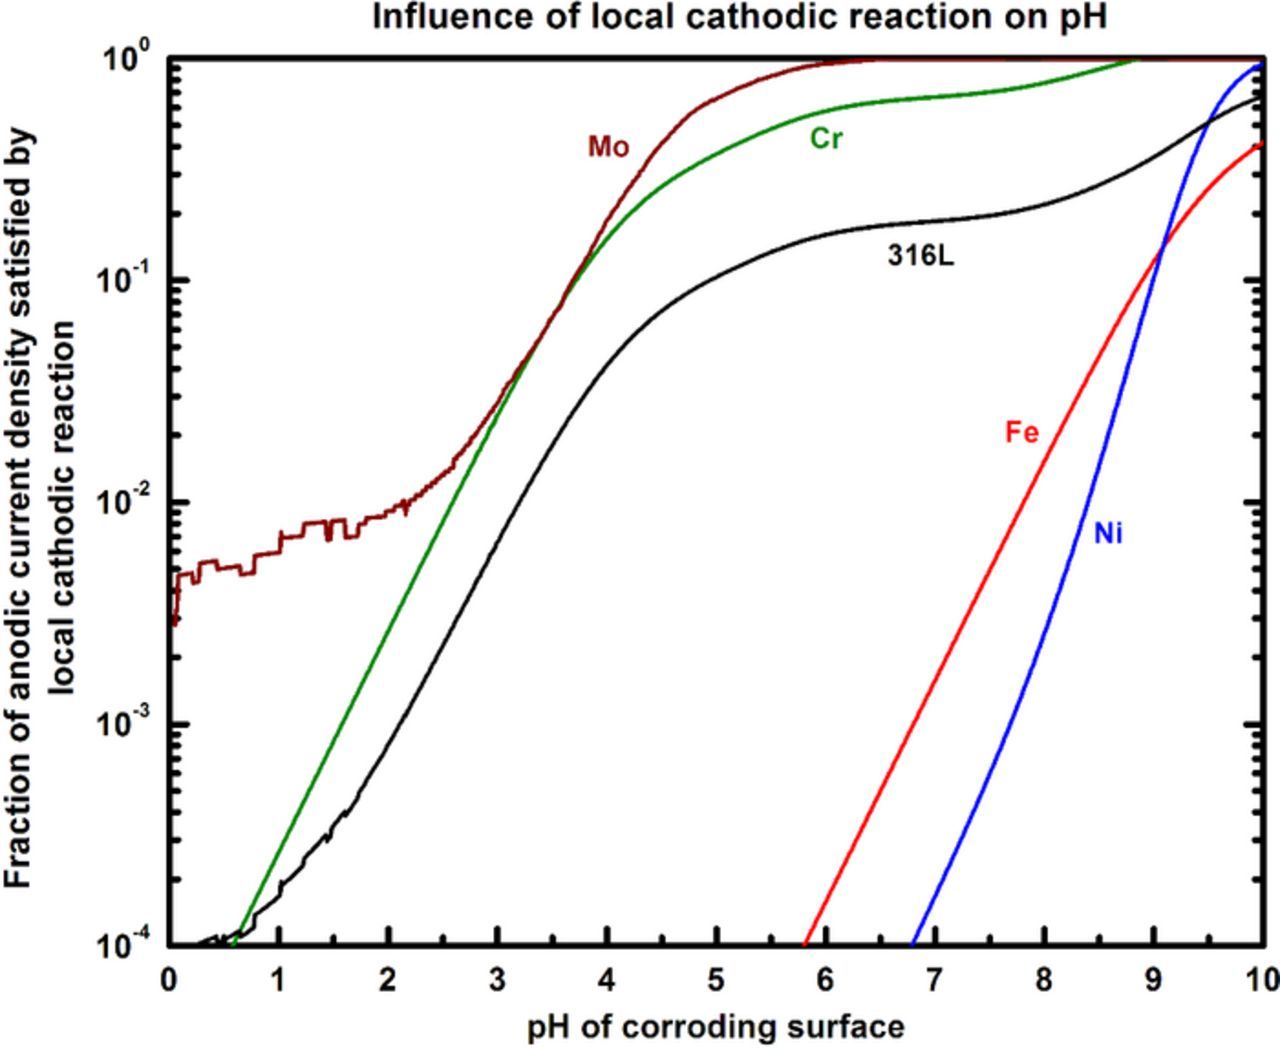
Figure 8. Influence of local cathodic reaction on the pH. The ratio ic,local/ia is calculated by considering the fraction of cations hydrolyzed to cations produced. This fraction increases as the local HER accelerates, resulting in greater OH− availability and a greater extent of cation hydrolysis to the limit as set by its valence, and a rise in pH. Note how that, at acidic pH, local cathodic reaction rates do not have to be very high to effect changes in H+ across orders of magnitude.
Oxide nucleation at critical pH leads to repassivation
As mentioned previously, repassivation of a corroding surface has been reasoned to occur due to the nucleation of a protective oxide being thermodynamically favored at some critical pit solution chemistry.51–53 This theory can be quantitatively examined by chemical modeling of the local surface conditions as the pit approaches repassivation. Such a treatment involves the evaluation of oxide speciation as a function of pH at different surface concentrations. A calculation of this nature for a corroding 316L pit is depicted in Figure 9, for a surface concentration corresponding to 55% of saturation, which represents the critical chemistry as determined from the anodic scans. The chromium(III) oxide species CrO(OH) was calculated to be the oxide that appeared at the lowest pH (2.65). As the pH was increased, the spinel FeCr2O4, and the hydroxides Ni(OH)2 and Fe(OH)2 were calculated to precipitate in that order. The calculations showed that Mo(III) species remained in solution throughout the pH range modeled. Figure 10 indicates the pH values at which the first oxide was calculated to precipitate for various degrees of saturation at the corroding surface. As the figure shows, the calculations determined CrO(OH) to be first oxide to be precipitated across the range of surface concentration considered, precipitating at a pH that varied from 2.5 to 2.8 as dilution increased. The appearance of CrO(OH) as the stable oxide is consistent with the surface analysis studies of passive films on stainless steels in chloride solutions reported in the literature.66–69 This analysis therefore indicated that the critical pH associated with repassivation for the system studied was 2.65.
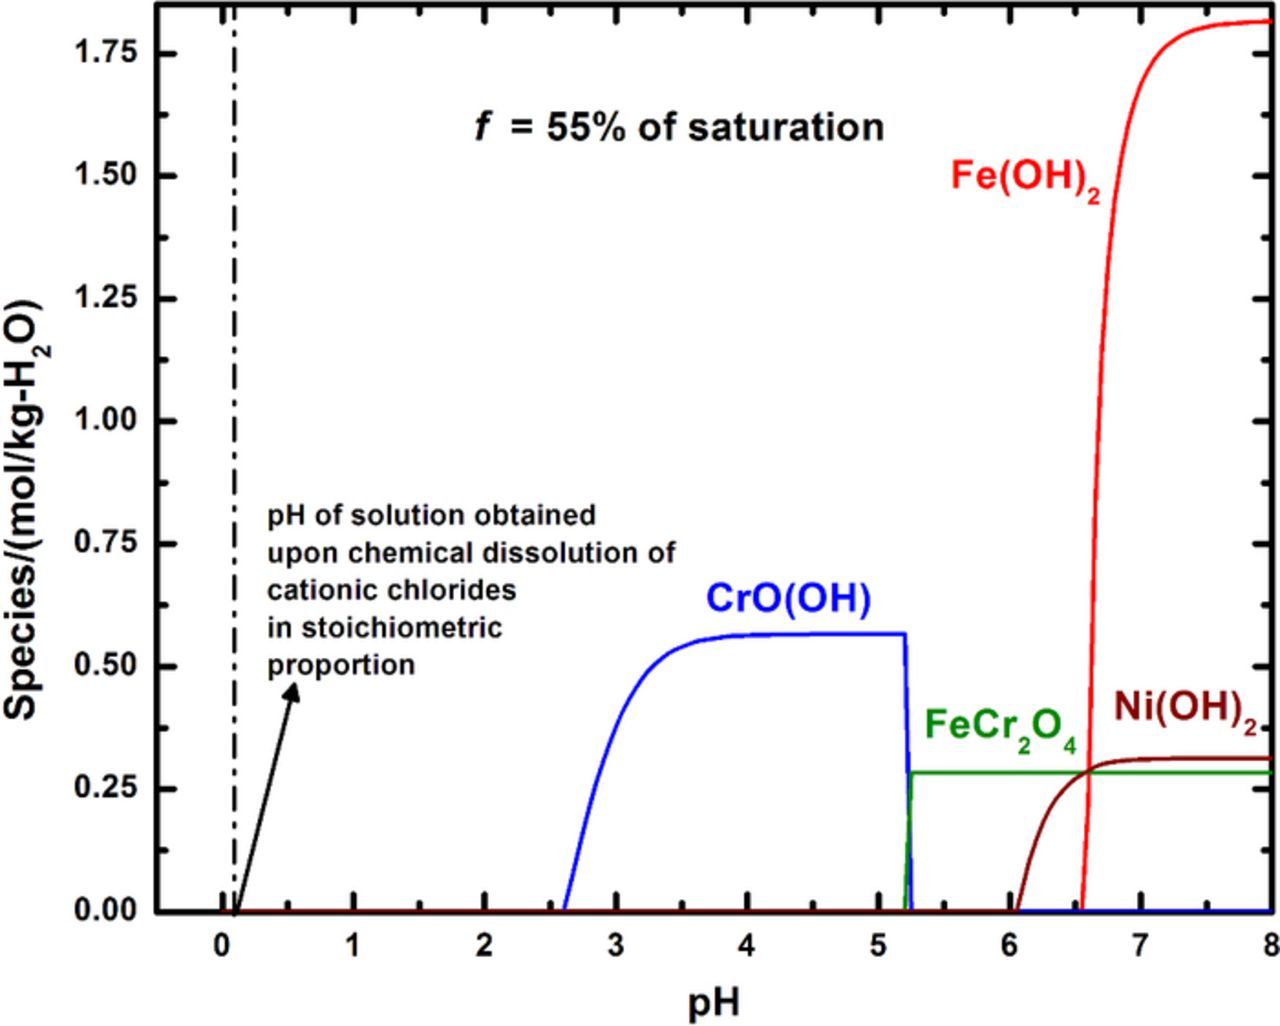
Figure 9. Calculation of oxide speciation as a function of pH for 316L. The surface concentration considered in this calculation is 55% of saturation – the critical value as determined by the concentration-dependent anodic kinetics. The dashed line close to pH 0 indicates the pH value of a solution of the same concentration prepared by the chemical dissolution of cationic chlorides. Note that no oxide would be expected to precipitate in this latter case.
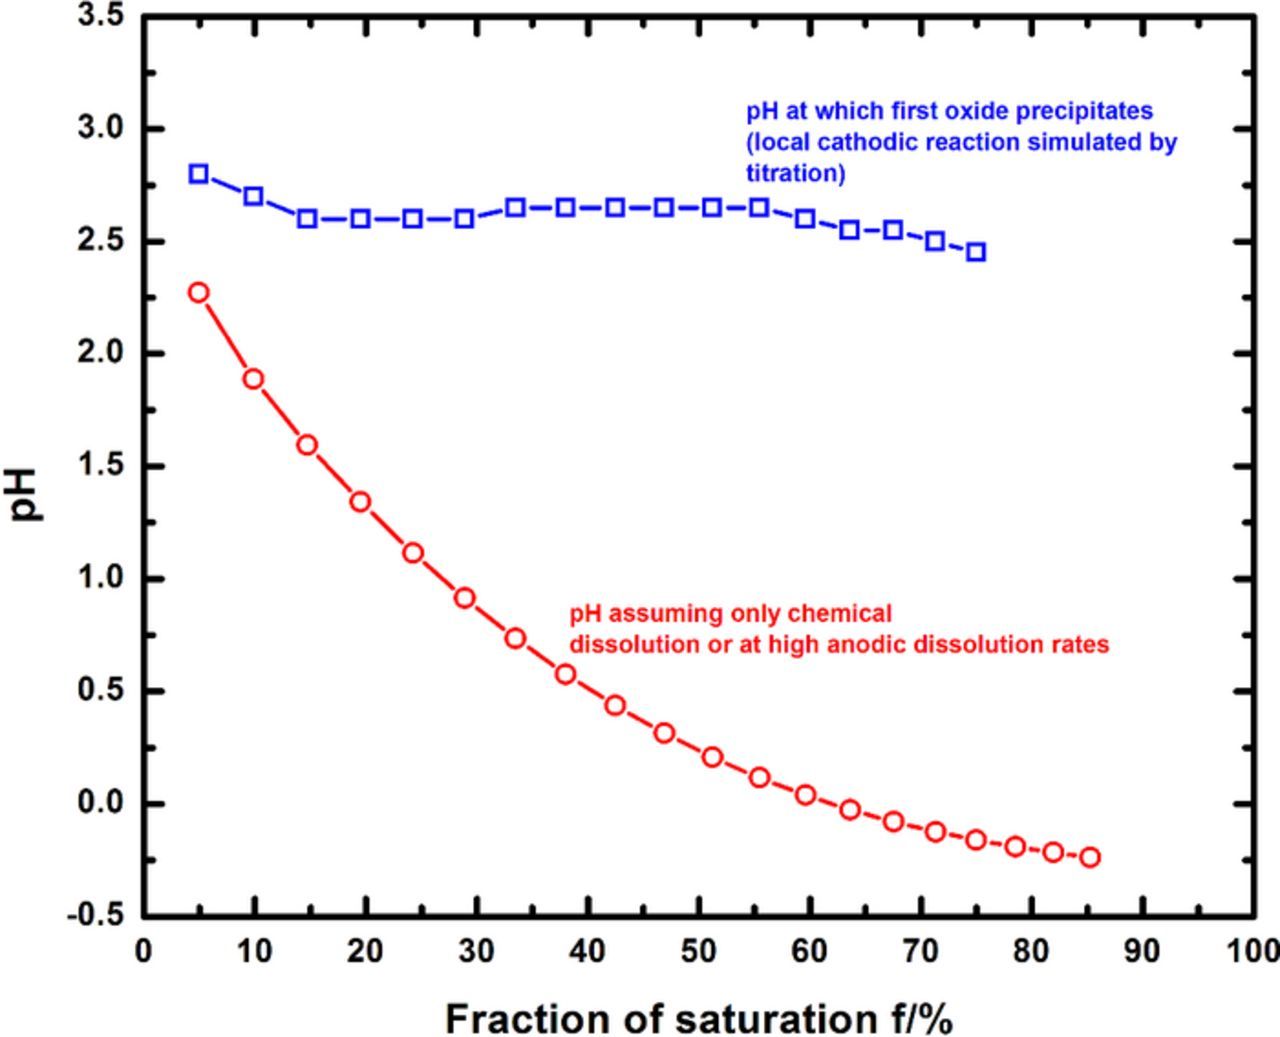
Figure 10. Estimation of the pH at which the first oxide precipitates in the pit solution as a result of the contribution of the local HER (simulated as a titration calculation). Note that the pH values at which the first oxide precipitates are also discernibly higher than those obtained when only chemical dissolution is considered. The latter plot is equivalent to Figure 5 and also represents the pH at high rates of anodic dissolution (where there is essentially zero contribution of the local HER).
Figure 10 also displays the pH values that result from modeling the surface chemistry when the local cathodic reaction is not considered. This latter plot is equivalent to Figure 5; it indicates the pH that would result from solely considering chemical dissolution, as would be expected when the respective cation chloride salts are dissolved in stoichiometric proportion or when anodic dissolution rates are very high. The absence of a local hydroxyl source implies that the pH of the solution considering only chemical dissolution is lower than the value obtained with the local cathodic reaction taken in to account. Additionally, as depicted by the data in Figures 9 and 10, oxide nucleation and subsequent repassivation are unlikely to occur if the pH at the corroding surface is not within the range of 2.5 to 2.8, thus reinforcing the argument against an extremely low value for the critical pH as has been measured in simulated pit solutions prepared from the chemical dissolution of metal chlorides.4,5,7,9,70 The results from this study also indicate that the pH values around 0 to 1 which were reported for stainless steels in the literature5,6,12 modeled conditions of very high anodic dissolution and therefore are consistent with pits growing at high potential, but may not be representative of the conditions inside a repassivating pit.
This work suggests that the pH of the corroding surface is a key critical parameter in determining the tendency toward repassivation by creating local conditions favorable for oxide nucleation. The pH necessary to nucleate an oxide can be attained either by sufficient dilution of the metal cation or the presence of local HER. However, the fact that corrosion is an electrochemical process requires consideration of the local HER because of the requirement for charge conservation. The results from this study reinforce this assertion due to the fact that the anodic kinetics display evidence of repassivation at higher surface concentrations than would be expected from solely diluting the chemistry of the corroding surface.
Cathodic kinetics required for repassivation can be estimated from conditions for oxide nucleation
Having established the pH required for repassivation via oxide nucleation at the critical surface concentration, the local cathodic kinetics necessary to facilitate these conditions can be evaluated via Mixed Potential Theory analysis. Anodic kinetics data were extracted via Tafel extrapolation of the polarization scans corresponding to the lowest surface concentration where active dissolution was observed to occur. The repassivation potential Erp, as measured in previous work,26,27,36,37 is used in combination with these data to estimate the anodic Tafel slope at the critical surface concentration. From Figure 10, the pH at which the oxide nucleates in a pit solution at the critical surface concentration of f = 55% of saturation is calculated to be 2.65. Figure 8 indicates that this pH for 316L is attained when the local cathodic reaction rate is 0.3% of the anodic dissolution rate. Figure 11 depicts the Tafel extrapolation of the experimental 316L anodic kinetics data from which the theoretical local HER line to satisfy these repassivation conditions is then generated.
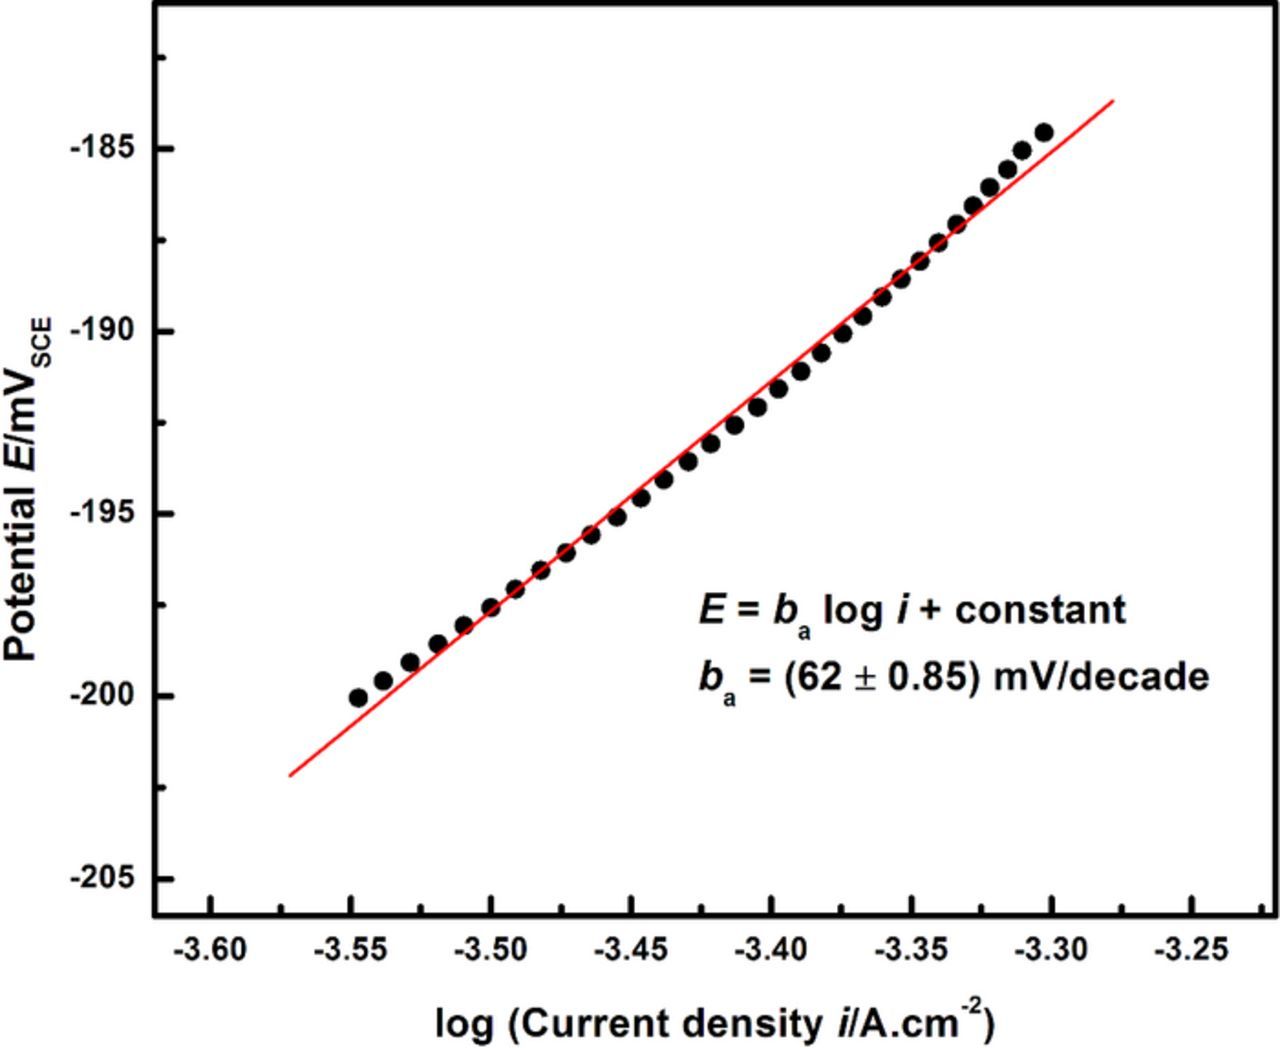
Figure 11. Tafel extrapolation of anodic scan at the critical surface concentration (55%) to determine the anodic slope ba.
The Tafel slope for the anodic dissolution kinetics from the experimental data at 55% of saturation is estimated to be 62 mV/decade. This value is in good agreement with Tafel slopes of about 60–70 mV/decade reported in the literature for the dissolution of 302 and 304 stainless steel16,22,71 and Fe-Cr-Mo model alloys72 in chloride media. From these results, the anodic current density at the Erp (= −210 mVSCE)26–28,37 is calculated to be ia = 201 μA/cm2. The EOCP measured at 55% of saturation is −228 mVSCE (from Figure 4). Using these values, the Tafel slope for the local HER under these conditions is calculated to be 8 mV/decade. These calculations are depicted in Figure 12. The net current density when Erp is measured (inet = ia − ic,local) is denoted as irp and is nearly equal to ia at Erp due to the critical condition that ic,local/ia = 0.3%.
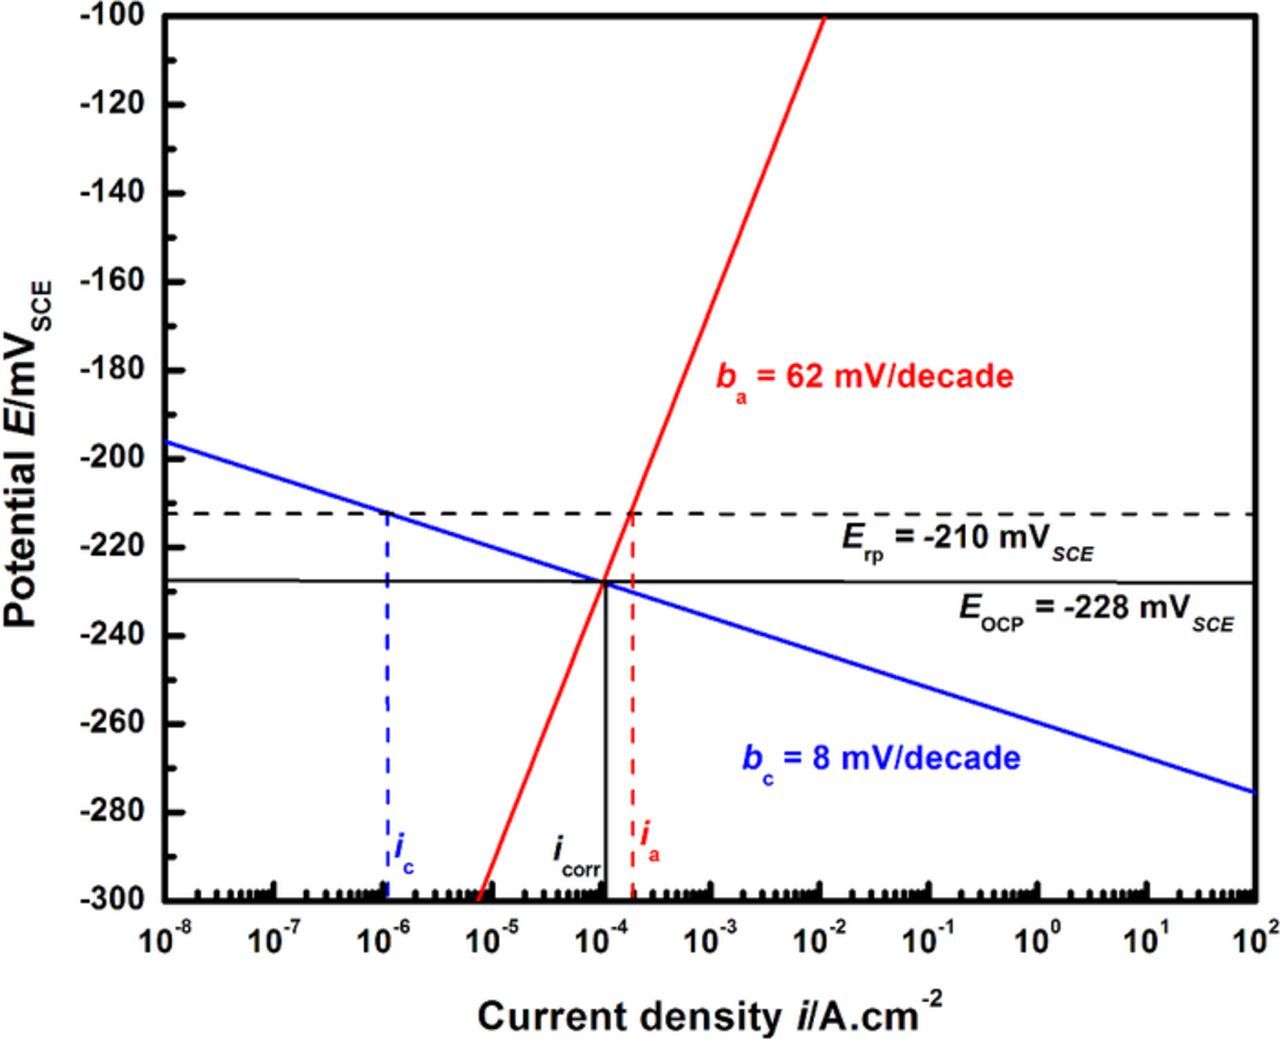
Figure 12. Calculation of the cathodic Tafel slope (bc) using the experimental anodic kinetics at 55% of saturation, and the measured values of Erp and EOCP. The notation icorr denotes value of the corrosion current density used in this calculation (= 104 μA/cm2) whereas ia and ic denote the anodic and cathodic current densities respectively.
The value of irp calculated by this analysis is 200 μA/cm2, nearly an order of magnitude greater than 30 μA/cm2, the current density at which the Erp measurement was recorded in the experiments reported in the literature.26–28,37 Additionally, the calculated cathodic slope does not correspond to reported values for established HER mechanisms which are generally considered to follow one of either the Volmer-Tafel (bc = 30 mV/decade) or the Volmer-Heyrovsky (bc = 118 mV/decade) pathways.73,74,a The apparent discrepancy observed between the experiments and calculations is likely due to the user-specified choice of the experimental irp value at which the Erp measurement was made. As mentioned in the introduction, although Erp is defined as the potential below which no pitting proceeded, the actual measurement of the value depends on a user-specified current density – a value that has ranged from 1 μA/cm2 to 100 μA/cm2.19,57,59,60,75–77 The value used in the studies by Srinivasan et al.26–28,37 (and referred to in this work) was 30 μA/cm2, based on current densities similar to those employed by Tsujikawa et al.57,75,76 and Sridhar and coworkers,19,78 as well as the ASTM G-192 standard.79 The validity of this specification and its sensitivity to the individual anodic and cathodic kinetics can be examined using Mixed Potential Theory under the constraints of the critical pH condition as shown in the next section.
Critical pH provides mechanistic basis for measurement of Erp based on HER kinetics
The establishment of the minimum pH for oxide nucleation in this study as a critical factor for repassivation permitted its utilization to assess the selection of an appropriate current density at which the measurement of Erp is recorded. Mixed potential theory was employed to examine the anodic kinetics data with respect to specific HER mechanisms. This treatment permitted the formulation of a physical basis for the selection of experimental parameters in determining critical factors and allowed for the examination of the self-consistency of the quantitative framework for pit stability and repassivation proposed by Srinivasan et al.26–29,37
As denoted in Figure 8, the ratio ic,local/ia corresponding to the critical pH for repassivation is 0.3%. Based on this critical condition, Mixed Potential Theory analysis was performed in order to estimate the Erp required to attain this ratio, under the conditions of the individual anodic and cathodic kinetics relevant to the reactions at the corroding surface. This estimate was then compared to the experimentally observed Erp and the current density at which it was measured. Agreement of the calculated estimates with the experimental values would indicate whether the quantitative framework proposed is self-consistent with the critical surface condition for repassivation.
Calculations were performed considering the cathodic Tafel slopes corresponding to the Volmer-Tafel and the Volmer-Heyrovsky mechanisms as bounding values, i.e. 30 mV/decade and 118 mV/decade respectively, and the EOCP from the experimental data in Figure 4 for 55% of saturation, −228 mVSCE. The corrosion current density assumed in these calculations is the one obtained from Figure 12, i.e. 104 μA/cm2. The anodic Tafel slope used is 62 mV/decade, as obtained from the experimental data in this study. Figure 13 illustrates these calculations. The Erp values obtained were −175 mVSCE (Volmer-Tafel) and −122 mVSCE (Volmer-Heyrovsky). The value of (ia − ic,local) at these values provides the appropriate net current density (irp) at which the Erp may be experimentally recorded, which correspond to nearly 0.75 mA/cm2 for the Volmer-Tafel case and 5 mA/cm2 for the Volmer-Heyrovsky case. The Erp value measured by Srinivasan and Kelly37 (−210 mVSCE ±12.8 mV) has an upper bound of −197 mVSCE, which is 22 mV lower than the calculations for the Volmer-Tafel case, suggesting that these HER kinetics likely approximate actual conditions. The Erp estimate obtained assuming the Volmer-Tafel HER mechanism is also close to the upper bound of the experimental scatter of the Erp data measured from high-throughput artificial pit studies by Srinivasan et al.28 The irp values obtained for both cathodic slopes are one to two orders of magnitude greater than the value employed in the experimental method used in the quantitative framework. These results suggest that a similar sensitivity analysis of the repassivation conditions in terms of the anodic Tafel slope bounds needs to be performed in order to fully rationalize the observed data.
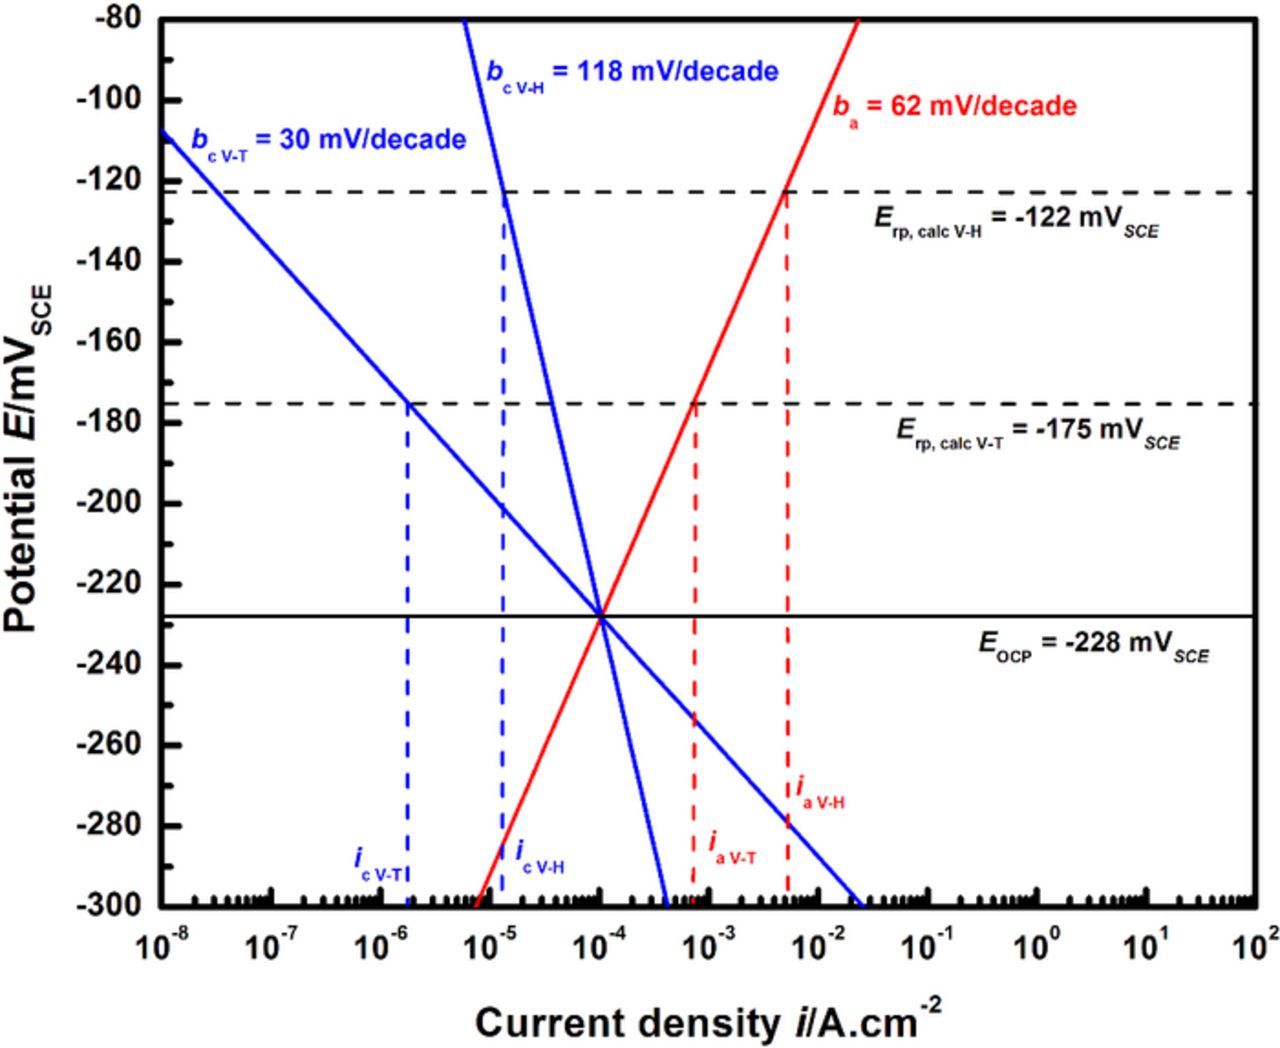
Figure 13. Sensitivity analysis of cathodic kinetics. Calculations were performed using the anodic Tafel slope from this study (ba = 62 mV/decade) and cathodic HER Tafel kinetics corresponding to the Volmer-Tafel (bc = 30 mV/decade) and Volmer-Heyrovsky (bc = 118 mV/decade) mechanisms. The notations ia and ic represent anodic and cathodic current densities respectively. The subscripts V-T and V-H refer to the results corresponding to the Volmer-Tafel and the Volmer-Heyrovsky mechanisms respectively.
Figure 14 displays the results for an anodic sensitivity analysis. In addition to the reported value of 70 mV/decade for stainless steels in chloride media71,72 which serves as an upper bound, a Tafel slope of 40 mV/decade is introduced as the lower bound. This value has been reported for iron dissolution kinetics in acidic chloride and sulfate media.80,81 Figure 14a depicts the results utilizing cathodic kinetics corresponding to the Volmer-Tafel mechanism. The calculated Erp values differ from each other by only 10 mV, at −183 mVSCE (ba = 40 mV/decade) and −173 mVSCE (ba = 70 mV/decade). The corresponding values of calculated irp are 1.5 mA/cm2 and 0.73 mA/cm2, which are approximately an order of magnitude larger than the values specified for Erp measurement in experiments. A similar set of calculations is performed using these anodic bounds and HER kinetics corresponding to the Volmer-Heyrovsky mechanism, as shown in Figure 14b. The Erp values obtained are −151 mVSCE and −115 mVSCE for the lower and upper anodic bounds, respectively. The corresponding irp values this analysis yields are 10 mA/cm2 and 5 mA/cm2, which exceed the experimentally selected current density by two orders of magnitude. As mentioned previously, the values of irp in all the cases considered in Figures 12 through 14, are very close to the respective values of ia due to the critical condition that ic,local/ia = 0.3%.
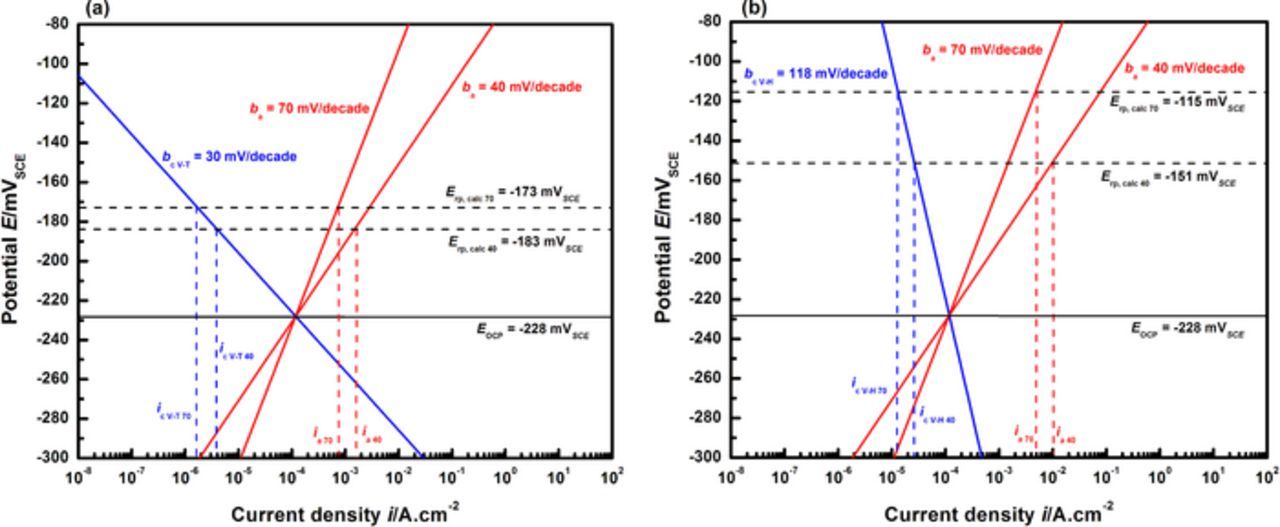
Figure 14. Sensitivity analysis of anodic kinetics with the Tafel slope lower bound at ba = 40 mV/decade and the upper bound at ba = 70 mV/decade. Calculations were performed using (a) bc = 30 mV/decade (Volmer-Tafel HER kinetics) and (b) bc = 118 mV/decade (Volmer-Heyrovsky HER kinetics). Notations for anodic and cathodic current densities and the cathodic reaction mechanisms considered are similar to those mentioned for Figure 13. The subscripts 40 and 70 refer to the anodic Tafel slopes used in the respective calculations.
Calculations based on the lower bound of the anodic Tafel slope are thus seen to be in closer agreement with measured repassivation values. However, results obtained using the two anodic bounds are not markedly different, particularly when Volmer-Tafel HER kinetics are chosen for the cathodic reaction. The Mixed Potential Theory analysis also appears to suggest that the appropriate current density to be selected for Erp ought to be an order of magnitude greater than presently used in practice, so as to correspond to the critical condition for repassivation based on the pH for oxide nucleation. However, it must be noted here that the critical pH condition obtained in this study is based on thermodynamic modeling. Fluctuations in pit solution during the experiment may result in creating kinetically favorable conditions for repassivation at lower net current densities which can then be experimentally observed. In any case, the Erp value measured at the current density selected in the experimental methodology of the proposed framework serves as a conservative lower bound. The fact that the Erp estimates using the Volmer-Tafel HER kinetics from this study are approached by the upper bound of experimental scatter from high-throughput data28 also allays the concern raised by Anderko et al.52,55 that the Erp measured in this manner at high scan rates may be an overly conservative estimate. The framework described in this study is still mechanistically validated by these results and improved estimates of the Tafel slopes would assist in closer agreement of the Erp estimates from Mixed Potential Theory analysis with experimental values.
As a final point, the kinetics of repassivation as described by the Mixed Potential Theory analysis are observed to be much more sensitive to variation in cathodic behavior than anodic dissolution, thus underscoring the importance of the local HER. The HER kinetics themselves appear to follow the Volmer-Tafel mechanism more closely than the Volmer-Heyrovsky mechanism. The rationale that the local HER favors the Volmer-Tafel pathway finds thermodynamic support in the literature. Trasatti82 has analyzed the HER on various metal surfaces in acidic media based on their values of the standard free energy of hydrogen adsorption, which indicates that the metal-hydrogen bonds formed by Fe, Cr, Ni, and Mo are highly stable (large negative ΔG). These metals are the primary constituents of 316L as indicated in Table I. The removal of the H-atom to form molecular H2 would consequently be encumbered by a large energy barrier when it is bonded to these metal ions. Surface desorption can therefore be considered to be the rate-determining step for hydrogen evolution under these circumstances, implying that the reaction is then likely to follow the Volmer-Tafel mechanism.
These results therefore demonstrate a methodology to evaluate the self-consistency of the quantitative framework employed to understand pit stability and repassivation by utilizing the pH for oxide nucleation in the pit solution as a critical condition. Analysis of the experimental kinetic data at repassivation indicated that the Erp as measured by the framework serves as a conservative bound for the critical chemical conditions at the corroding surface, based on mixed potential calculations using established anodic and cathodic kinetics. Mechanistic support for the framework was also provided by this treatment, which rationalized the observed transition from stability to repassivation to be primarily controlled by the local cathodic reaction.
Limitations of the results of the proposed framework
The approach described in this study provides a quantitative framework that can be utilized to evaluate critical conditions for pit stability, as well as quantify the mechanistic underpinnings of repassivation. However, it is prudent to state the limitations of the results that emerge from the assumptions employed as well as the quality of the input data. An improved thermodynamic database for Mo(III) species would assist in elucidating the relative stability of oxide species at the lower end of the pH range. Furthermore, this study considered repassivation to be induced by the precipitation of essentially bulk oxide species in the critical pit solution chemistry. The inclusion of the thermodynamics and kinetics of surface oxide precipitation83,84 to inform the framework would provide more accurate estimates of the repassivation process. Such estimates would also facilitate the mechanistic validation of competitive adsorption models to describe repassivation.51,52,55
Conclusions
This work employed calculations obtained from mass transport modeling to design artificial pit experiments for probing the critical pit chemistry at the transition from active dissolution to repassivation. Rapid polarization scans at various levels of dilution from saturation indicated the appearance of a well-defined change in anodic behavior, as the chemistry inside the pit grew less aggressive. The critical value of surface concentration obtained in this manner was observed to agree well with independently determined estimates from studies on pit stability at the onset of repassivation. In addition, the pH associated with the onset of repassivation was investigated using Tafel extrapolation of the polarization scans in combination with cation hydrolysis calculations. Examination of oxide speciation with respect to increasing pH at varying surface concentrations confirmed that this critical pH marked the chemistry at which oxide nucleation commenced, indicating the physical cause for the pit repassivation. This criterion was then utilized in designing arguments based on mixed potential theory that supplied a mechanistic foundation describing the critical chemistry for a pit to remain stable, which underscored the importance of the local cathodic reaction to the onset of repassivation.
Acknowledgments
Financial assistance from the Office of the Undersecretary of Defense Technical Corrosion Collaboration via the United States Air Force Academy Contract FA7000-10-2-001 is gratefully acknowledged. Discussion on Mo(III) hydrolysis and pH dependence of oxide speciation with Dr. Andrzej Anderko, OLI Systems Inc., Morris Plains, NJ, is greatly appreciated.
Footnotes
- a
These reaction mechanisms are based on the relative velocities of the two steps in the series for the HER to occur: a) electron discharge and b) surface desorption. The Volmer-Tafel mechanism describes a fast discharge-slow desorption process whereas the Volmer-Heyrovsky reaction path characterizes a slow discharge-fast desorption course.