Private equity funds are set up to invest in private companies for a predefined multiyear period. Private equity companies, i.e. the companies that run private equity funds, come in several types, with different goals and methods. Private equity performs an important role in funding and fostering companies that are as yet too small for the stock market and/or too risky for bank loans.
By nature, private equity is very well suited to sustainable investing since it is a fundamental form of investing with active ownership, multiyear investment horizons, and close consideration of the company’s business model and circumstances. However, in the application of sustainability considerations, private equity falls behind the public equity space. The main difficulty lies in getting the right information for the investors in private equity funds, as many of these funds are still reluctant to systematically report on environmental and social factors—although this is improving. The integrated view on private equity is again similar to the one on public equity, but with the added challenge of data and comparability.
Overview
Private equity funds are set up to invest in private companies for a predefined multiyear period. They aim to make a return by improving their investee companies’ performance and exiting them at a profit. Private equity companies, i.e. the companies that run private equity funds, come in several types, with different goals and methods. Private equity performs an important role in funding and fostering companies that are as yet too small for the stock market and/or too risky for bank loans. Private equity as an asset class receives a growing allocation of pension fund money.
As in public equity, the relevance of environmental (E) and social (S) factors for financial value is growing in private equity. This is because of investor interest and as a result of E and S driving fundamentals. However, in the application of sustainability considerations, private equity falls behind the public equity space. The main difficulty lies in getting the right information for the investors in private equity funds, as many of these funds are still reluctant to systematically report on E and S—although this is improving. By nature, private equity is very well suited to sustainable investing since it is a fundamental form of investing with active ownership, multiyear investment horizons, and close consideration of the company’s business model and circumstances.
Anzeige
Given the active ownership role that private equity takes, value creation by active investors on E and S is potentially greater in private equity than in public equity. This especially applies to early stage investments, such as venture capital. However, value creation on E and S is more likely if the private equity fund actually steers on impact, which only a small subset of private equity funds seems to do. In addition, private equity tends to shy away from activities that require fundamental research—that is left to governments, foundations, and large corporations.
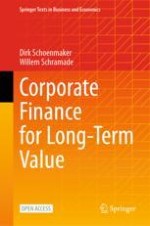
The integrated view on private equity is again similar to the one on public equity, but with the added challenge of data and comparability. Ideally, pension funds can allocate to private equity not just on the basis of financial risk and return, but also on integrated risk and return. See Figure 10.1 for a chapter overview.
A chart depicts the chapter's four subtopics as sustainability unaware, including the basics and valuation of private equity, E S G integrated or inward view, such as the impact of S and E in private equity, and outward view and integrated value, including valuation of S and E and integrated value in private equity.
Fig. 10.1
Chapter overview
×
Learning Objectives
After reading this chapter, you should be able to:
Explain the basics of private equity and how it differs from public equity
Identify the challenges of data and comparability in private equity valuation
Analyse the ways in which private equity may create and destroy value on E, F, and S
10.1 Basics of Private Equity
Private equity (henceforth: PE) funds invest in private companies by means of a non-traded equity stake for a multiyear period, with the aim to make a return by improving the investee companies’ performance and exiting them at a profit.
Anzeige
Private equity comes in several forms. Most are of the formal type, which means that they have a fund structure that raises capital from other investors. Some are informal private equity, such as angel investors and families, who mainly invest their own money. The focus of this chapter is on formal private equity, rather than informal private equity. The formal types of PE are shown in Fig. 10.2.
A classification chart of private equity is categorized into venture capital, growth equity, and buyout equity.
Fig. 10.2
Types of private equity
×
Venture capital (VC) invests in early stage (start-up) companies. These typically have a great but unproven idea, carry high risk, and often have negative cash flows, i.e. high burn rate (which refers to the speed at which they run out of (‘burn’) their cash). Within VC, three substages are discerned: early-stage; mid-stage; and late-stage. VC companies can invest in all three stages or specialise in one or two of them.
VC involves high expected returns and high risks: about two-thirds of investments by VCs lose money, and half of those fail (Zeisberger et al., 2017). The high returns come from a limited number of ‘home runs’ that generate percentage returns in the hundreds or even thousands. To deal with such high levels of risk, VCs tend to demand internal rates of return (IRRs) of at least 20%, and sometimes over 100% in very early stage investments. Demanded IRRs fall as companies mature and their risk levels fall. Funding is done in stages: successful VC-backed companies are funded in several rounds of equity raisings, at typically higher subsequent valuations (and lower cost of capital), in which incumbent shareholders might be diluted.
Growth equity comes in at a more mature stage, sometimes just after the VC phase, where a company’s business model works well, but has not yet succeeded in growing quickly. Growth equity aims to assist such a company in achieving that high growth and to reap the concomitant returns. Although the investment contract makes them influential, a minority stake does imply a lack of full control. That makes it important to maintain strong working relations and high levels of trust between the PE fund, existing owners, and company management.
Both venture capital and growth equity companies tend to take minority interests. That is different in the third type, buyouts. In buyouts, the PE company takes a majority stake, funded with equity and loans, to take control of the company and change its strategy and operations for higher performance. They typically use debt in leveraged buyouts (LBOs). The role of management differs per type of buyout deal. In MBOs (management buyouts) the incumbent management team takes over, helped by the PE company. In MBIs (management buy-ins), the PE company brings in an external management team.
Table 10.1 shows the size of the private equity market. Buyout equity is the largest segment with $2994 billion followed by venture capital with $1829 billion. The overall size of the private equity market of $6.3 trillion is far smaller than that of the public equity market of $105.8 trillion (see Table 8.1 in Chap. 8).
The structure of PE funds is illustrated in Fig. 10.3. A PE company raises and advises a PE fund through two entities: (1) the General Partner (GP) and (2) the investment manager. The General Partner is responsible for managing the PE fund and has a fiduciary duty to act in the sole interest of the fund’s investors. It issues capital and makes investments while respecting the Limited Partnership Agreement (LPA). The LPA sets out the mandate of the fund; and it may delegate some management functions to the investment manager of the PE company’s investment committee. GPs have skin in the game with an equity stake of 1–10% of the fund.
A chart represents the investment manager and G P as part of a private equity company and L Ps provide advisory services, G P interest, and capital, respectively in a private equity fund. This fund is utilized by various investee companies.
Fig. 10.3
Private equity fund structure. Source: Adapted from Zeisberger et al. (2017)
×
The typical PE company is organised as a partnership or limited liability corporation (Kaplan & Strömberg, 2009). The larger PE companies, such as Blackstone, Carlyle and KKR, are mainly active in buyouts.
The investment manager executes the fund’s daily operations: evaluating potential investments; doing the fund’s reporting and auditing; and providing advisory services to investee companies. The limited partners (LPs) only take a financial role: they provide capital and pay fees to the PE company. Fees are typically paid in a ‘2 and 20’ structure: a 1.5–2% management fee and 20% carried interest (‘carry’), which is the percentage of profits paid to the GP, provided that the returns exceed the hurdle rate, which is typically 8%.
PE companies typically invest in 10–15 investee companies (to achieve a minimal degree of diversification) for 10 + 2 years. That is, the goal is to invest in and divest from all companies within 10 years, and pay back all capital, including returns, to the investors. The +2 means that there is allowance for two extra years to ensure exit from all portfolio companies.
From the LPs’ perspective, the cash flows to and from a PE fund look like the J-curve in Fig. 10.4. The cash flow stream starts with cash outflows, and later on—if successful—cash inflows.
A positive-negative bar graph illustrates cash flows over the years. It denotes capital calls, distributions, and cumulative cash flow. Capital calls have a negative trend, distribution has a positive trend, and cumulative cash flow from zero has a decreasing-increasing trend.
Fig. 10.4
Private equity J-curve. Source: Adapted from Zeisberger et al. (2017)
×
Such a cash flow stream is problematic for institutional investors acting as LPs, since they need to commit to capital calls that are hard to estimate in size and timing in advance, and which may result in liquidity problems.
The PE Investment Process
The PE investment process is summarised in Fig. 10.5. In the pre-deal phase, the PE company spends a lot of time and effort in finding and selecting prospective companies to invest in.
A four-stage process of P E investment. The stages are pre-deal, deal, manage investments, and exit.
Fig. 10.5
Stages of the PE investment process
×
The pre-deal funnel is shown in Fig. 10.6. It starts with a large number of companies that are initially considered for investing, and which are filtered on several criteria (such as industrial sector, nature of the business model, competitive position, technology, size, etc.) to arrive at a small number of potential companies for which preliminary due diligence (DD) is done. Due diligence means that deeper research into the company’s books is conducted. The PE company also engages external consultants for certain tasks in the DD process (e.g. Financial and Accounting DD, Tax DD, Commercial DD, ESG DD). The results of the preliminary DD are typically discussed in an investment committee review, in which a further selection is made. This subset is subjected to formal DD, which is an even more rigorous type of DD, after which the investment may or may not be made.
A pre-deal funnel represents, from broader to narrower base, deal sourcing, preliminary D D, investment committee review, formal D D, and investment made.
Fig. 10.6
PE pre-deal funnel
×
In their choice of targets, PE companies are guided by the need to achieve a minimum internal rate of return (IRR; see Chap. 6), unlike strategic buyers such as companies. Fidrmuc et al. (2012) find that in public to private deals, private equity buyers pursue targets that have more tangible assets, lower market-to-book ratios, and lower research and development expenses relative to targets bought by strategic buyers. This is very different for VC though, where targets are selected based on very different criteria: mostly, on the skills of the entrepreneurial team. Practitioners stress that PE is a people’s business: you need to trust the people you work with.
PE and Financial Performance
PE has a reputation for making companies more profitable, but to what extent is that reputation merited? Manigart et al. (2022) give an overview of the evidence and find that, after buyout, PE-backed companies experience higher growth than similar non-PE-backed companies, especially in the twenty-first century. More surprisingly, leveraged buyout (LBO) PE portfolio companies are found to enhance innovation (Amess et al., 2016). And LBO PE investors in the USA are associated with higher-quality patents that become more concentrated in important strategic domains (Lerner et al., 2011). Looking at LBOs, Kaplan and Strömberg (2009) distinguish three sources of value creation:
Financial engineering: LBOs are often debt-financed, which increases leverage and thereby disciplines managers
Governance engineering: PE companies control the boards of their investee companies; management at investee companies gets a larger stake in the company when it goes private, to align their interests with the company (see Chap. 3)
Operational engineering: the ratio of operating income to sales increases, but the ratio of capital expenditures (investments) to sales declines at LBOs
For VC in Europe, Popov and Roosenboom (2012) also find a positive relation between PE activity and innovation. So, contrary to popular opinion, PE-backed companies grow faster and do more R&D.
Exits
There are several exit routes in PE LBOs. Table 10.2 provides an overview. The most common exit is the sale to a strategic (nonfinancial) buyer, which is typically another company. This occurs in 38% of the exits. The second most common exit is a trade sale to another PE fund in a secondary leveraged buyout (24%). IPOs, where the company is listed on the stock market and thus ‘goes public’, count for 14% of exits.
Valuation of PE is similar to valuation of public equity (see Chap. 9). In both cases, the discounted cash flow (DCF) method is theoretically best, while multiples are a useful shortcut. However, valuing PE is harder for two reasons. First, especially in VC, it often concerns small companies that are not even profitable yet, which makes normalised projections harder. Second, there is no market price or beta for the target, and target prices and betas for comparable companies may be lacking as well.
Consider this fictitious example of a cultured meat producer, which develops a procedure for harvesting meat without animals. Initially, the company is focused on getting processes right: to make cultured meat not just as tasty as regular meat but also to get costs down sufficiently to make cultured meat competitive in terms of sales prices. Hence, the first few years see hardly any sales, significant costs, and hence a negative cash flow (see Table 10.3). From year 4 onwards, positive cash flows are projected, but they are much more uncertain than those of the typical public equity company. In such early stage companies, it can be all or nothing: if the producer does not succeed in getting its costs down, then sales won’t take off, cash flows will never turn positive, and the company will shut down.
Table 10.3
VC NPV valuation, part 1
Perspective in year 1
Year
1
2
3
4
5
6
7
8
9
10
TV
Sales
0
2
50
200
400
520
624
749
824
890
890
Costs
–15
–28
–53
–183
–340
–432
–505
–607
–667
–738
–738
Cash flow
–15
–26
–3
17
60
88
119
142
156
151
151
CF margin
–1300%
–6%
9%
15%
17%
19%
19%
19%
17%
17%
WACC
25%
TV
658
Discount factor
0.80
0.64
0.51
0.41
0.33
0.26
0.21
0.17
0.13
0.11
0.11
PV of cash flow
–12
–17
–2
7
20
23
25
24
21
16
71
NPV
176
By now, you should be familiar with calculating the NPV (i.e. DCF) of a company (see Chaps. 4, 6, and 9). In addition to a WACC of 25%, we assume a growth of cash flows g of 2% after year 10. The terminal value TV of cash flows after year 10 can be calculated with Eq. (9.14) from Chap. 9: \( T{V}_N=\frac{FCF_{N+1}}{WACC-g}=\frac{151}{25\%-2\%}=658 \).
Often, in these very early stage fundings, convertible notes (i.e. bonds with a call option on the equity—see Chap. 19 for an explanation of how options work and are valued) are used to avoid having to rigorously value the companies at this stage. VC also tends not to invest in common stock, but in preferred stock with liquidation preference.
After this initial valuation, the numbers are updated as milestones are met (or not) and expectations change. The milestones are important for assessing and managing risk. For the abovementioned cultured meat producer, milestones may include reaching production cost levels; obtaining regulatory approval; and the launch of a production line at scale. The development of a reliable discounted cash flow model requires addressing many difficult questions (i.e. assumptions about if/when milestones can be reached) that have uncertain answers. Some of these questions may include: how much investment must be expended to complete technology development? Are any governmental approvals required? Will the technology be successfully scaled for manufacturing? How many units of the relevant products will be sold? How much revenue and profit will be earned? Will competitors be able to design around the technology, or are non-infringing alternatives available?
These milestones typically have date/time windows and (value driver) consequences attached to them. These too need to be defined. For example, reaching break-even level can trigger a lower cost of capital; and proof of concept can raise sales expectations.
In our example, two years after the initial valuation, expectations have been met exactly (not realistic, but easier to keep the numbers the same), and as a result, the NPV has tripled (from 176 to 456), basically for two reasons: (1) the time value of money; (2) due to the milestones being met, the WACC was lowered from 25 to 20% (see Table 10.4).
Table 10.4
VC NPV valuation, part 2
Perspective in year 3
Year
1
2
3
4
5
6
7
8
9
10
TV
Sales
0
2
50
200
400
520
624
749
824
890
890
Costs
–15
–28
–53
–183
–340
–432
–505
–607
–667
–738
–738
Cash flow
–15
–26
–3
17
60
88
119
142
156
151
151
CF margin
–1300%
–6%
9%
15%
17%
19%
19%
19%
17%
17%
WACC
20%
TV
840
Discount factor
0.83
0.69
0.58
0.48
0.40
0.33
0.28
0.23
0.23
PV of cash flow
–3
12
35
43
48
48
44
35
195
NPV
456
In reality, actual numbers will be lower or higher than the expected numbers for year 2 and 3, and the expectations for the following years will be updated accordingly. There are likely to be funding rounds in the meantime, moreover, which means that the shareholders’ positions are diluted. For example, instead of owning 30% of the company, that might now be 20%, which means that the value of the stake hasn’t tripled, but doubled. PE analysts will typically anticipate this dilution by modelling the dilutive effect of funding rounds in their models. We will not show these here. To get familiar with PE valuation, we provide an exercise in Example 10.1.
Example 10.1: PE Valuation with Changing WACC in DCF
Problem
A start-up app developing company is expecting heavy investments and little revenue in its early years, as well as facing significant uncertainty leading to a high cost of capital. The company’s expected sales and costs are shown in the table below. Assuming a WACC of 30% and cash flow growth rate of 2.5% after year 10, what is the company’s NPV using the DCF method? And assuming the early milestones of the company are met, what is the NPV if the WACC changes to 20% in year 3?
Year
1
2
3
4
5
6
7
8
9
10
Sales
0
25
50
150
240
324
373
410
434
447
Costs
–60
–45
–58
–141
–209
–275
–309
–344
–369
–385
Solution
The calculation of the NPV of the company in year 1 with a 30% WACC is shown in the table below. The terminal value (TV) is calculated using Eq. (9.14): \( T{V}_N=\frac{FCF_{N+1}}{WACC-g}=\frac{62}{30\%-2.5\%}=225 \). The company value is only narrowly positive with an NPV of 5.3.
Perspective in year 1
Year
1
2
3
4
5
6
7
8
9
10
TV
Sales
0
25
50
150
240
324
373
410
434
447
447
Costs
–60
–45
–58
–141
–209
–275
–309
–344
–369
–385
–60
Cash flow
–60
–20
–8
9
31
49
64
66
65
62
62
CF margin
–80%
–16%
6%
13%
15%
17%
16%
15%
14%
14%
WACC
30%
TV
225
Discount factor
0.77
0.59
0.46
0.35
0.27
0.21
0.16
0.12
0.09
0.07
0.07
PV of cash flow
–46
–12
–4
3
8
10
10
8
6
4
16
NPV
5.3
The calculation of the NPV of the company in year 3 with a 20% WACC is shown in the table below. The terminal value (TV) is again calculated using Eq. (9.14), but with the change in WACC: \( TV=\frac{62}{20\%-2.5\%}=354 \). Compared to year 1, the company value increased by nearly 200 in year 3, with an NPV of 203.9.
Perspective in year 3
Year
1
2
3
4
5
6
7
8
9
10
TV
Sales
0
25
50
150
240
324
373
410
434
447
447
Costs
–60
–45
–58
–141
–209
–275
–309
–344
–369
–385
–60
Cash flow
–60
–20
–8
9
31
49
64
66
65
62
62
CF margin
–80%
–16%
6%
13%
15%
17%
16%
15%
14%
14%
WACC
20%
TV
354
Discount factor
0.83
0.69
0.58
0.48
0.40
0.33
0.28
0.23
0.23
PV of cash flow
–7
6
18
24
26
22
18
14
82
NPV
203.9
Valuation Using Multiples
An alternative to DCF is valuation by means of multiples. In the case of a multiples valuation, a company’s value is determined as a multiple of a financial statement metric such as profitability or book value. The multiple is then based on the average multiple of its peer group (i.e. comparable companies in the same industry). In the example below, the enterprise value (EPV) is calculated as a multiple of earnings before interest, taxes, depreciation, and amortisation (EBITDA).
Table 10.5 illustrates how that works for a buyout situation. In this case, the PE company buys the investee company in 2023 for 600 in equity, with a net debt load of 730. It expects a rise in EPV from 1330 to 1980 by means of improvements in both profitability (EBITDA going from 160 to 210) and the valuation of that profitability (i.e. the EPV/EBITDA multiple to rise from 8.3 to 9.4). Meanwhile, 350 of the 730 in Net Debt is paid back, leaving 380 in 2028. As a result, the equity value rises from 600 to 1600. See Table 10.5 for the calculations and the forecasted numbers for 2028—labelled 2028E (E from estimate).
The financial value creation leads to an increase in equity of 1000. We check that in Table 10.6. The changes in EBITDA and in the EPV/EBITDA multiple give an increase of 650, which is equal to the increase in Enterprise Value in Table 10.5. The repayment of debt leads to an extra increase of equity of 350. Example 10.2 provides an exercise on PE valuation with multiples.
Table 10.6
Financial value creation in a buyout using multiples
An app developing company is expecting changes in its capital structure and profitability. Currently, the company’s enterprise value (EPV) is 350, with a net debt load of 100, 250 in equity, and EBITDA of 50. In the coming year, debt is going to be increased by 25, EBITDA is expected to increase by 15, and the EPV/EBITDA multiple is expected to decrease by 0.5. What is the effect of these changes on the company’s enterprise value and equity? What is the impact on this change in terms of EBITDA and multiples?
Solution
The current values, changes, and new values are illustrated in the table below.
Current
Change
New
Calculation
EBITDA
50
+15
65
EPV/EBITDA multiple
7.0
–0.5
6.5
Enterprise Value (EPV)
350
+72.5
422.5
65*6.5 = 422.5
Net debt
100
+25
125
Equity
250
+47.5
297.5
422.5 – 125 = 297.5
The table shows that the changes result in an increase in enterprise value of 72.5 and an increase in equity of 47.5. This is checked in the table below by measuring the impact from EBITDA and the EPV/EBITDA multiple. All of the positive impact on equity is derived from the increase in EBITDA, whereas the increase in debt and decrease in EPV/EBITDA multiple result in a negative impact on equity.
Value drivers
Change
Calculation
Explanation
Net debt impact
–25
Net debt increase
EBITDA impact
105
15*7.0
Change in EBITDA * original multiple
Multiple impact
–32.5
–0.5*65
Multiple expansion * new EBITDA
Value creation
47.5
Check: rise in equity
47.5
PE companies also use other multiples for PE valuations. Examples are revenue multiples (EPV/revenue) and earnings multiples, like the price-earnings (P/E) ratio. PE companies typically employ several valuation methods. They use ‘football field’ graphs, like Fig. 10.7, to visualise the outcome of the different valuation methods.
The football field graph compares 2 types of valuation methods against a baseline value of $57. Public comparables include 2023 P by E, 2022 P by E, 2023 E V by E B I T D A, and 2022 E V by E B I T D A while discounted cash flow is 9 percent and 10 percent discount rate.
Fig. 10.7
Football field graph of valuation methods
×
Cost of Capital
Standard cost of capital practices derive a company’s beta from its past stock performance; and then fill in that beta, along with assumptions on the risk-free rate and the market risk premium, to arrive at a company’s cost of capital (see Chap. 13). However, non-listed companies do not have past stock returns, and hence no observable beta. At best then, betas of comparable companies or industry betas can be used. Moreover, the extra risk of early stage companies is not reflected in betas. Hence, one could take a different approach by taking a high default cost of capital of 20–60% and make adjustments to that rate—typically discounts as risk falls, but sometimes premiums as well. The 20% discount rate is in line with findings by Heaton (1998).
While the cost of capital reflects the required return from an investor perspective before the PE investment is made, realised returns measure the actual performance of PE investments. Phalippou (2020) shows that PE has not been as financially successful for its investors, as often claimed. He finds that PE funds have generated returns that are about the same as those of public equity indexes since at least 2006, while the risk is higher. A major reason is that the high management fees (the earlier explained ‘2 and 20’) have to be deducted from the gross returns; investors only receive net returns. So, the gross returns may be higher for PE than for public equity; the net returns are about the same. Phalippou (2020) concludes that PE is in particular financially attractive for the PE managers.
10.3 Impact of S and E on F in Private Equity
In principle, the financial value of private equity is affected by S and E in the same way that public equity is affected by S and E. Chapter 9 discussed how S and E affect the valuation of F through the value drivers—sales growth, EBIT margin, and cost of capital—and how to model that.
ESG Integration Lagging in Comparison with Public Equity
However, the practice of ESG integration in PE seems to be lagging compared to ESG integration in public equity investing. Zaccone and Pedrini (2020) contend that ‘PE companies’ integration of ESG aspects is still in its infancy and that the literature lacks a clear understanding of their activities relative to ESG factors, what assessment tools they prefer, what criteria they rely on when deciding whether to perform an ESG due diligence, and the dominant barriers they face when considering ESG issues in their investment strategies’. Furthermore, their survey finds that ESG integration in PE is mostly driven by the desire to comply with regulations and standards; that ESG due diligence is typically performed by external advisors; and that most PE companies do not have standardised ESG procedures. The interviewees revealed that they ‘do not do the ESG business assessment for value creation’. Of course, there are more advanced PE companies. For example, Indahl and Jacobsen (2019) describe how their PE company, Summa Equity, ‘has turned its ESG principles and practices into a core competence, a source of competitive advantage that has enabled the company to distinguish itself from its competitors and, in so doing, to bring about significant increases in efficiency and long-run value’. Abraham et al. (2022) find that ESG disclosures by PE companies have been steadily increasing over the past two decades. Moreover, they find that PE companies with high ESG disclosures achieve better financial returns.
ESG Integrated Due Diligence
Ideally, PE companies do not only apply the methods described in Chap. 9 to make E and S related value driver adjustments, but also fully integrate the analysis of E and S in their due diligence (DD). That is, data on E and S issues should be part of the data provided by the company and collected during the DD process. Figure 10.8 gives an overview of the types of data collected during DD.
A chart represents 6 distinct types of data. They are financials, management, business model, impact, competitive position, and operations. It also enlists methods in each category.
Fig. 10.8
Elements of an ESG integrated due diligence process
×
Most of these elements are not very different from the typical PE DD process. However, explicitly taking impact into account, as done in column 4 of Fig. 10.8, is different. Moreover, and more importantly, all of these elements are ideally considered with E and S issues in mind. That requires additional data and methods, such as questionnaires, but most of all the mindset to do this.
In addition to the integration of E and S issues in their analysis of companies, PE companies can also see E and S issues as forces that affect their own company in terms of risk and opportunities, such as in Box 10.1.
Box 10.1: Apollo Launches Platform in Energy Transition and Decarbonisation Investments1
Apollo is a large and stock-listed PE company. In a February 2022 press release, Apollo announced ‘the launch of a comprehensive sustainable investing platform focused on financing and investing in the energy transition and decarbonization of industry. Across asset classes, Apollo targets deploying $50 billion in clean energy and climate capital over the next five years and sees the opportunity to deploy more than $100 billion by 2030. With approximately $4.5 trillion annually in investments needed to achieve global net zero by 2050, Apollo aims to be a leading capital partner to companies and communities globally’.
In addition to the company’s investment targets, Apollo has committed to:
Reduce median carbon intensity by 15% over the projected hold period for new control investments in the company’s flagship strategy;
Align its public reporting with the Task Force on Climate-Related Financial Disclosures (TCFD) recommendations;
Enhance due diligence with a deeper focus on sustainability improvements and targets; and
Continue to identify and invest in innovative companies that accelerate the energy transition and more sustainable business models.
10.4 Valuation of S & E and Integrated Valuation in Private Equity
Just like in public equity, the valuation of S and E in their own right is possible in PE. For calculations and examples, please see Chap. 9. There are also differences. Especially early stage private equity tends to invest in newly emerging companies that are on the bottom left of the x-curve of transition (see Fig. 2.12 in Chap. 2). As a result, their integrated value tends to be better than those of established companies (top left of the x-curve) in public equity and public debt markets.
Here, we will focus on impact PE. This is a type of PE that explicitly aims to create value for society—and how it differs from venture philanthropy. This is still a very small part of the PE market, but it is growing fast, driven by the desire of affluent people to invest their money with the purpose of achieving better societal outcomes.
Impact PE
A small part of the PE universe is aimed at providing not just financial returns, but social and environmental ones as well. This is known as impact PE. Impact PE fits into the wider spectrum of impact investments. In the definition of Global Impact Investing Network: ‘Impact investments are investments made with the intention to generate positive, measurable social and environmental impact alongside a financial return’ (see definitions in Chap. 14). For impact investments, financial returns are not the main objective, but just one of the objectives. And to varying degrees, financial returns are just a budget constraint: a condition to achieving the main objective of impact. That impact can take various forms, and be of a social or environmental nature.
Moreover, the definition of impact investing requires that the impact be measured. In practice, measurement tends to be harder in impact PE than in impact public equities, since the data are often harder to get, or relatively more costly to produce. At the same time, the impact potential (i.e. the impact that can be generated per euro or dollar invested) is likely to be higher in impact PE than in listed equity, for the reasons previously mentioned: it can be more targeted, more local, and it can fund much earlier-stage ventures.
To deal with the data challenge, impact PE companies can develop their own frameworks. For example, global impact investment manager, BlueOrchard, developed an impact framework based on the principles of the former Impact Management Project (IMP):
1.
Intentionality: there need to be clear impact goals; and these goals are set out in a theory of change
2.
Contribution: the portfolio holdings contribute directly to the impact goals of the strategy (investee contribution); and the investor supports and accelerates the impact that the investees have (investor impact)
3.
Measurement: impact is assessed in an impact scorecard along the five dimensions of the IMP: what; how much; who; contribution; and impact risks; and
4.
Governance: the impact is safeguarded through robust governance
Venture Philanthropy
A step further is venture philanthropy, which is in between impact PE and charity: unlike charity, it wants to preserve its capital invested to be able to invest in future projects. And unlike impact PE, it does not require a significantly positive financial return. For example, LGT Venture Philanthropy (part of LGT Asset Management) deploys philanthropic growth capital to organisations and companies with effective, innovative, and scalable solutions to social and environmental challenges: ‘We scale innovative organizations by providing a tailored combination of capital, access to professional skills, management know-how and strategic advice. Our portfolio organizations are active in key impact sectors, including: education, health and environmental protection and restoration. Through our engagements, we directly contribute to the achievement of the Sustainable Development Goals (SDGs)’.2
Integrated Value
The methods for calculating integrated value in PE are the same as the ones for public equity (see Sect. 9.5 in Chap. 9). However, the calculation of integrated value would in many cases be relatively costly and not always necessary. Academic evidence shows that on average the exploitation of E and S (layoffs) by PE does not happen. Hence, calculation of integrated value in PE would make most sense in larger deals in which there are serious doubts about the overall value creation pattern. Examples are buyout deals with a change of ownership of a large company where much cost cutting is expected and/or where serious externalities are already being generated—think of the attempted takeover of Unilever by Kraft Heinz, driven by Brazilian PE company 3G Capital (see Chap. 18).
10.5 Conclusions
Private equity funds are set up to invest in private companies for a predefined multiyear period, aiming to make a return by improving their investee companies’ performance and exiting them at a profit. Private equity companies, i.e. the companies that run private equity funds, come in several types, with different goals and methods. Private equity performs an important role in funding and fostering companies that are too small yet for the stock market and/or too risky for bank loans. Private equity as an asset class receives a growing allocation of pension fund money.
Like in public equity, the relevance of E and S to F is growing in private equity. This is because of investor interest and as a result of E and S driving fundamentals. However, in the application of sustainability considerations, private equity lags the public equity space. The main difficulty lies in getting the right information for the investors in private equity funds, as many private equity funds are still reluctant to systematically report on E and S. Yet by nature, private equity is very well suited to sustainable investing since it is a fundamental form of investing, with active ownership, multiyear investment horizons, and close consideration of the company’s business model and circumstances.
Given the active ownership role that private equity takes, value creation on E and S is potentially greater in private equity than in public equity. This applies especially to early stage investments, such as venture capital. However, value creation on E and S is more likely if the private equity fund actually steers on impact, which only a small subset seems to do.
The integrated view on private equity is again similar to the one on public equity, but with the added challenge of data and comparability. Ideally, pension funds can allocate to private equity not just on the basis of financial risk and return but also on integrated risk and return, as further discussed in Chap. 14.
Key Concepts Used in This Chapter
Buyout is a PE investment, whereby the PE company takes a majority stake in an investee company, funded with equity and loans, to take control of the company and change its strategy and operations for higher performance. There are several types of buyouts: LBOs, MBIs, and MBOs
General partner is responsible for managing the PE fund and has a fiduciary duty to act in the sole interest of the fund’s investors
Growth equity invests at a more mature stage of a company, sometimes just after the VC phase, where a company’s business model works well, but has not yet succeeded in growing fast
Leveraged buyout (LBO) is a buyout using debt to leverage the investee company
Limited partner takes a financial role in the PE company; they provide capital and pay fees to the PE company
Management buy-in (MBI) is a PE investment, where the PE company brings in an external management team
Management buyout (MBO) is a buyout, whereby the incumbent management team takes over, helped by the PE company
Multiples valuation is a type of relative valuation in which an asset’s value is determined as a multiple of a financial statement metric such as profitability or book value.
Private equity (PE) invests in private companies by means of a non-traded equity stake for a multiyear period, with the aim to make a return by improving the investee companies’ performance and exiting them at a profit
PE company raises and advises a PE fund through two entities: (1) the General Partner (GP) and (2) the investment manager
Value Driver Adjustments (VDA) are the adjustments made to value driver assumptions in a valuation model, based on an assessment of the company’s material ESG issues
Venture capital (VC) invests in early stage (start-up) companies
Open Access This chapter is licensed under the terms of the Creative Commons Attribution 4.0 International License (http://creativecommons.org/licenses/by/4.0/), which permits use, sharing, adaptation, distribution and reproduction in any medium or format, as long as you give appropriate credit to the original author(s) and the source, provide a link to the Creative Commons license and indicate if changes were made.
The images or other third party material in this chapter are included in the chapter's Creative Commons license, unless indicated otherwise in a credit line to the material. If material is not included in the chapter's Creative Commons license and your intended use is not permitted by statutory regulation or exceeds the permitted use, you will need to obtain permission directly from the copyright holder.