Chapter 1 gave us a clear starting point: responsible companies create integrated value based on financial value (FV), social value (SV), and environmental value (EV). But what does that mean and imply? This chapter outlines what value creation is, and how the various types of value creation can be prioritised. For the alignment of all types of value, the prospect of internalisation is crucial. Internalisation means that the burdens of (social and environmental) externalities are increasingly shifted back from society to the companies and consumers who cause them. If companies’ FV depends on the exploitation of an external impact (i.e., FV at the expense of SV or EV), that FV will be affected if and when internalisation occurs.
As responsible companies aim to create value based on FV, SV, and EV, they should have a clear picture of their current value creation profile and of their capabilities to create integrated value. Based on their purpose and area(s) of value destruction, companies can accordingly adjust their strategy and business model. In the case of serious value destruction, they should be able to outline a credible transition pathway. Companies can invest in their capabilities to adapt to sustainable business models. In that way, they increase their transition preparedness.
Overview
Chapter 1 gave us a clear starting point: responsible companies create integrated value based on financial value (FV), social value (SV), and environmental value (EV). Therefore, optimising integrated value should be the basic corporate objective. But what does that mean and imply? This chapter outlines what value creation is, and how the various types of value creation can be prioritised. For the alignment of all types of value, the prospect of internalisation is crucial. Internalisation means that the burdens of externalities are increasingly shifted back from society to the companies and consumers who cause them. If companies’ FV depends on the exploitation of an external impact (i.e., FV at the expense of SV or EV), that FV will be affected if and when internalisation occurs. The internalisation of external impacts is part of the transition to a sustainable and inclusive economy.
Unfortunately, current corporate reporting does not facilitate the measurement or even estimation of SV and EV by external stakeholders (although company management has the data to do this). Therefore, to identify value creation on SV and EV, stakeholders can use analytical shortcuts such as the Value Creation Matrix. Measurement methods do exist but are not yet standardised or widely used. As responsible companies aim to create value based on FV, SV, and EV, they should have a clear picture of their current value creation profile and of their capabilities to create integrated value. Based on their purpose and area(s) of value destruction, companies can accordingly adjust their strategy and business model. In the case of serious value destruction, they should be able to outline a credible transition pathway. Companies can invest in their capabilities to adapt to sustainable business models. In that way, they increase their transition preparedness.
Advertisement
Learning Objectives
After you have studied this chapter, you should be able to:
Identify value creation and value destruction across FV, SV, and EV
Make a rough estimate of value creation/destruction on SV and EV, even in the absence of data
Relate value creation to a company’s purpose and strategy
Envisage transition pathways towards value creation on SV and EV
Critically assess a company’s transition preparedness
2.1 Basics of Integrated Value Creation
What Is Value Creation?
In financial terms, value creation is defined as an increase in the net present value (NPV) of a company’s projects (see, for example, Koller et al., 2020). It is also what a company’s stock price is supposed to reflect. A rise in its stock price implies either higher expected cash flows, lower cost of capital, or both. Of course, this is only financial value (FV). As discussed in Chap. 1, integrated value (IV) also encompasses social value (SV) and environmental value (EV). Value creation can be measured for all types of value, but this is typically not done for SV and EV. As a result, FV is often generated at the expense of SV and EV as resources are depleted without sufficient investments in maintaining them.
Responsible companies manage for integrated value creation (profit and impact) rather than merely shareholder value (profit). Managing for integrated value creation involves managing and balancing all types of value at the same time, often involving trade-offs. This can range from enlightened shareholder value to managing for purpose, seeing FV as a mere necessity instead of a goal in itself. As their goals differ, companies will have different decision rules for their investment decisions as well, as we will discuss in Chap. 6. Box 2.1 shows a few company statements on value creation.
Box 2.1: Company Statements on Value Creation
Daikin:
Our aim is to use our world-class technologies to reduce environmental impact while at the same time providing new value in the form of a healthy, comfortable way of living.1
Advertisement
DSM:
Our strategy centres on our continuing evolution towards being a Nutrition, Health and Sustainable Living company. The title, ‘Growth & Value—Purpose-led, Performance-driven’, speaks for itself. We want to continue generating value for all our stakeholders—from customers and shareholders to employees, and society-at-large.2
Unilever:
We believe that sustainable and equitable growth is the only way to create long-term value for our stakeholders. That is why we have placed the Unilever Sustainable Living Plan at the heart of our business model.3
The Alignment of FV, SV, and EV
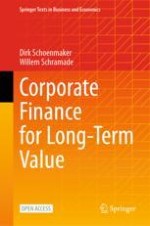
Ideally, FV, SV, and EV are aligned: companies that create more social and environmental value are also financially more successful since they deliver what customers value. While such alignment is possible, it is often absent due to distortions such as scarcity, market power (where companies can extract too much value from consumers, suppliers, etc.) or external impacts. External impacts (also called externalities) are costs or benefits that are created by organisations or persons but whose costs are borne by society as a whole. Examples include pollution, health effects, and child labour. Fossil fuels, tobacco, and the garment industry are classic examples of industries with large negative impacts. A way to improve the alignment between FV, SV, and EV is to ensure that companies charge true or integrated prices, i.e., prices that include all hidden costs. For example, Impact Institute (2019) calculates that the inclusion of such hidden costs in the price of a pair of jeans would result in a price increase of about €30 on average. Having integrated prices in place (through regulation, taxation, and transparency in the value chain) would give tremendous incentives for better behaviour and substantial reductions in social and environmental costs. It would not only raise the price of many products but would also make cleaner products more viable—see Fig. 2.1.
A bar graph of the price versus the true price in euros. The parameters and their values are as follows. The price of the dirty product excusing hidden costs is 50. The price of the clean alternative is 60. The true price of the dirty product is 50. Data are estimated.
Fig. 2.1
Price versus integrated price. Source: Authors’ calculation based on Impact Institute (2019)
×
However, integrated prices would not solve all financial value creation at the expense of SV, EV, and other people’s FV. Mariana Mazzucato (2018) argues that industries such as IT, pharma, and financial services extract much value from the rest of society as they exploit their market power (due to scale, technology, patents, regulation) by means of raising prices, manipulating media, and avoiding taxes.
Currently, many companies are value destructive on SV or EV—see Fig. 2.2 for an illustration. But we don’t yet have the numbers on the extent of the value destruction on SV and EV. For society and the economy to operate within social and planetary boundaries, we need companies to stop being value destructive on SV and EV on aggregate, i.e. to have SV− and EV− largely disappear (the superscript represents negative values). Of course, this is hardest for those companies that are most value destructive—more on this in Sect. 2.5, transition pathways. The need to avoid value destruction on SV and EV also has implications for the corporate objective (as discussed in Chap. 1) and companies’ purpose and strategy (see Sect. 2.4). Let us first consider why companies would want to manage for integrated value.
A positive-negative bar graph depicts the most likely value creation profile. The bars and their values are as follows. F V, 9. S V plus, 7. S V minus, negative 5. E V plus, 0.5. E V minus, negative 0.48. Data are estimated.
Fig. 2.2
The likely value creation profile of a typical company
×
Why Is It in Companies’ Interest to Manage for Integrated Value Creation?
Hard-nosed investors want companies to maximise FV for them. However, if company management neglects SV or EV, that will hurt long-term FV as well—but not necessarily short-term FV, which is what these investors might be after. As said before, FV, SV, and EV are often not aligned. However, such misalignment is not static. In fact, it is quite likely to be unstable. Companies that create FV at the expense of SV or EV are likely to lose their licence to operate at some stage (Kurznack et al., 2021; Mayer, 2018). An example is the tobacco industry in Fig. 2.3.
An X-Y axis graph of the profit versus impact. The plots of healthcare, tobacco, coal, and electric vehicles are plotted in 4 quadrants respectively. The coal and health care plots are plotted in a diagonal corridor.
Fig. 2.3
Long-term alignment of profit and impact
×
Conversely, companies that create value on SV and EV are more likely to create value on FV in the long run as well: as external impacts (both positive and negative) are being internalised, they affect FV. That is, the heavy polluter will see its FV diminished or even go negative, whereas the companies that provide solutions for solving negative SV and EV are rewarded with stronger FV. An example of the latter are manufacturers of electric vehicles that are becoming profitable (Fig. 2.3). Box 2.2 provides another example of a company that creates value on EV with a product that reduces emissions. The diagonal in Fig. 2.3 provides the long-term corridor, where FV and SV and EV become aligned through internalisation of external impacts. The alignment can be on the positive side (the viable part of the corridor) or on the negative side (the nonviable part of the corridor).
Box 2.2: Value Creation with a Product That Reduces Emissions
DSM, a Dutch multinational active in health, nutrition, and materials, has a product that reduces methane emissions by cows. According to DSM, ‘just a quarter teaspoon of Bovaer per cow per day suppresses the enzyme that triggers methane production in a cow’s rumen and consistently reduces enteric methane emission by approximately 30%. It takes effect immediately, and it is safely broken down in the cow’s normal digestive system’.4 If used widely, the product would help achieve a phenomenal reduction in methane emissions. However, in the absence of methane prices, the product is difficult to sell, since the product is costly for dairy farmers and does not provide them a direct benefit. That will all change as soon as methane emissions are internalised, i.e. charged to the dairy farms emitting them. Then, to avoid methane taxes, those dairy farmers will happily buy the DSM product since it helps them reduce their methane emissions and (crucially) the taxes associated with those emissions.
Some argue that companies cannot afford to be less value destructive on SV and EV, since that will price them out of the market (Kaplan, 2020). However, the product competition argument is less strong in practice. It assumes implicitly that the impact is static, which is not the case. Impact can be internalised, as shown below. Furthermore, those companies with high margins can give up part of that margin by incurring higher costs without changing the pricing of their products. More generally, companies can adjust their business model and design transition pathways to reduce negative SV and EV over time (see Sect. 2.5). In terms of double materiality (see Fig. 2.6), this makes sense from a societal (outward) perspective. In the long run, it might also be better from a financial (inward) perspective.
Forced Internalisation
One could argue that quite a lot of companies are better off if they can continue to externalise their large costs on SV and EV. That sounds rational if (1) companies are not interested in double materiality, and (2) there is no threat of internalisation; and indeed that threat needs to be credible enough to make companies start to act. We distinguish four driving forces behind the internalisation of SV and EV into FV:
1.
Licence to operate
2.
Regulation and taxation
3.
Technological advancement and
4.
Customer preferences
The broader social trend of corporate responsibility creates expectations for companies; society looks to leading companies to contribute to the major transitions (energy, circularity, biodiversity, and labour practices). Next, carbon taxes are accelerating the adoption of low-carbon production technologies and the phasing out of carbon-intensive ones. Technological advances in combination with economies of scale make wind and solar energy competitive with fossil energy for electricity generation.
In addition, authorities are currently preparing regulations for working conditions throughout the value chain. Customer preferences are also relevant. The campaign of chocolate manufacturer Tony’s Chocolonely, for example, has ensured that consumers buy mainly Fairtrade chocolate, even when they buy other brands. These driving forces of internalisation of social and environmental externalities raise the question of the appropriate division of labour between the various players: government, investors, companies, consumers, and civil society. Box 2.3 provides an overview of the key players in internalisation. The role of these players is complementary. Each can make its own contribution. A major challenge is avoiding the waiting game, where one player (for example, a company considering the adoption of a low-carbon technology) waits for another player (for example, the government contemplating raising the carbon tax) to act.
Box 2.3: Key Players in Internalising Externalities
We identify five main players, who can apply various internalisation mechanisms:
1.
Government: A first best solution to internalise externalities is taxation or regulation by the government. Carbon taxes are, for example, an efficient way to get the public good of a low-carbon economy. In the case of severe externalities, the government may apply an outright ban through regulation. But the political economy of taxation and regulation highlights that governments face political constraints at the national level (voters) and the international level (international coordination) to achieve the first best solution. Mazzucato (2021) argues for government taking an active role (e.g. as initial investor in innovative technologies) to accelerate the sustainability transition in the economy and society.
2.
Investors: Financial institutions can incorporate environmental, social, and governance (ESG) factors into their investment and lending strategy and engage with the corporates in which they invest. In particular, large institutional investors, such as pension funds, insurance companies, and investment funds, can put pressure on companies to speed up the transition to sustainable business models.
3.
Companies: Companies can incorporate the costs of externalities into business practices across the value chain of production. This chapter examines how corporates can embrace sustainability in their strategy and change their business models. Chapter 5 shows how companies can measure and price externalities.
4.
Consumers: Consumers may buy sustainable products and services. An emerging trend is the sharing or peer-to-peer economy, whereby participants mutualise access to products or services, rather than having individual ownership. This reduces consumption, since consumers do not need to buy the products or services individually. Examples are the sharing (for free or renting out) of cars, bicycles, equipment, houses (Airbnb), and taxis (Uber). Nevertheless, consumers are not (yet) the driving force of internalisation.
5.
Civil society: Non-governmental organisations (NGOs) can raise awareness of social and environmental externalities through public voice in the media. The aim of public debate is to stimulate other players (government, investors, companies, and consumers) to behave responsibly and address externalities. Chapter 14 discusses the role of civil society.
If and when internalisation does happen, its impact can be quite counterintuitive, since it’s not necessarily the worst polluters that are hit hardest: the impact depends on the company’s preparedness and the relative size of its external impacts versus alternatives. For example, aluminium is an energy- and carbon-intensive industry that would be strongly affected by a high carbon price, but some aluminium companies would likely benefit from it.
The relationship between integrated prices and integrated profits is not linear. An integrated price can lead to higher costs for a producer and still increase profits. The following example shows that. Table 2.1 shows the profitability of an aluminium producer without (left) and with (right) a high carbon price. The carbon price increases both the costs and the turnover of the aluminium producer, because the demand for aluminium is likely to increase at the expense of steel (which weighs more and thus produces more fuel consumption and emissions in cars). But because this aluminium producer’s production is cleaner than its competitors (for whom costs rise much faster), its costs rise less than its turnover, and its operating margin (profitability) increases.
Table 2.1
The non-linear relationship between integrated prices and profitability for a transition-prepared aluminium company
No carbon price
High carbon price
Change
Sales
50
55
10%
Costs
44
47
7%
Operating result
6
8
33%
Operating margin
12.0%
14.5%
21%
Another way to illustrate this is by means of cost curves. Figure 2.4 shows the costs of six mining companies that compete directly on a specific product, such as copper or cobalt. The left panel of Fig. 2.4 shows the situation without a carbon price; the right panel the situation with a carbon price. All companies see their costs rise, but not to the same extent.
2 bar graphs depict the cost price and cost price with carbon dioxide tax of 6 carbon mining sites. Carbon mining 6 has the highest bar of 1900 and 2200 respectively. Data are estimated.
Fig. 2.4
Cost curves with and without carbon prices
×
Since the marginal producer (the company with the highest cost price) becomes more expensive, the sales price (dotted line in Fig. 2.4) also rises. This, of course, also depends on demand. If the product becomes more attractive due to the tax (as the product is needed more as input for sustainable products or alternative products are more heavily taxed, for example), the price will rise more; if demand declines, the marginal producer goes out of business and the price rises less, or even falls. As costs and sales prices change, so do profits, which is shown in Fig. 2.5.
A positive-negative bar graph depicts the change in profit margins in dollars. The values of mining carbons 1 to 6 are as follows. 50, 50, 200, 50, minus 100, and 0. Data are estimated.
Fig. 2.5
Change in profits due to carbon prices
×
Mining Company 3 is the clear beneficiary in terms of profits, whereas Mining Company 5 is the loser. The reason is simple: for the cleanest producer (MiningCo3), the costs rise by $50, which is less than the industry average of $208; for the dirtiest producer (MiningCo5), costs rise by $350.
Internalisation is not a straightforward process. To assess a company’s FV, it is important to do scenario analysis on the likelihood, speed, and nature of the internalisation of the company’s SV and EV, both positive and negative. Scenario analysis is a process of analysing possible future events by considering alternative possible outcomes (sometimes called ‘alternative worlds’). Thus, scenario analysis, which is one of the main forms of projection, does not try to show one exact picture of the future, but alternative scenarios. De Ruijter (2014) proposes a strategic approach in making scenarios for a company with the following steps:
1.
Determine the most important uncertainties for the future and put them in a framework. This can be two axes representing two key uncertainties, but also a decision tree containing the most important questions for the future.
2.
Elaborate the scenarios: fill them in with the developments, trends, uncertainties, and possible actions of actors from the transactional environment until each scenario forms a plausible and relevant whole leading to new insights.
3.
Represent the scenarios to make them appealing stories about possible future situations and the path leading there.
A STEEP-type analysis can be used to identify the societal trends that shape product and service markets in the long term. STEEP is a tool to analyse driving forces or trends focusing on social (including demographic), technological, economic, environmental, and political factors. These trends cover sustainability transitions (social and environmental) and digital transitions (technology). While these trends are operating society wide, their impact is different across various sectors. In scenario analysis, a company can identify the most important societal trends for the industry in which it operates (including the likely internalisation of the main externalities) and assess its relative position (for example, degree of pollution or payment of living wages) within the industry. Importantly, a company can use scenario analysis as part of its strategy-setting (see Sect. 2.4) to take action to anticipate important trends and reduce the impact of negative scenarios.
There are societal forces that put pressure on companies to internalise social and environmental impacts. Companies are dependent on a vibrant and healthy society for their long-term functioning. This is the social licence to operate (see Chap. 1). The challenge of sustainable development is to what degree companies are able (or forced) to internalise the social and environmental impacts, as illustrated in Fig. 2.6. The concept of double materiality means that one is mindful of the company’s relation with society and nature in two directions:
1.
Inward: the company’s dependencies on society and nature and
2.
Outward: the company’s impact on society and nature
An illustration of two components business and financial value and society and nature, with inward dependencies and outside impacts.
Fig. 2.6
Double materiality and the internalisation of social and environmental impacts
×
Investors are often only interested in the first, but it is a costly error to ignore the second. They are, after all, related, and the company’s impacts tend to affect its dependencies as well.
2.2 Identifying Value Creation and Value Destruction
Let us take a step back. In practice, information flows on SV and EV are typically missing or incomplete. That’s no reason not to try, though. In an intuitive way, one can often make an educated guess about a company’s SV and EV. For example, airlines’ carbon emissions are so large that they result in highly negative EV, even if one uses low-carbon prices and/or ignores their effects on biodiversity—for which the size is a question mark, but the sign is not. In that way, one can fill out the value creation matrix in Table 2.2 for most companies, projects, and activities.
Table 2.2
Value creation matrix
A value creation matrix of 2 columns and 2 rows. The column headers are S plus E value-destroying and creating. The row headers are F value-creating and destroying. Quadrants 1 is overexploitation, 2 is win-win, 3 is collapse, and 4 is charity.
The best projects/activities/companies are situated in Quadrant 2 (win–win) of Table 2.2: they create value on both F and S&E. Thanks to the positive F, they will also be implemented by the market. The latter also applies to projects in Quadrant 1 (exploitation): they create value on F but destroy value on S&E. Given that destruction of value, they should not take place; but the market is not aware because SV & EV are not measured and not priced. The market is effectively blind to the difference between Quadrants 1 and 2. That is where the market fails and people can intervene: changes in transparency, behaviour, technology, regulation, etc. can make Quadrant 1 very small, and in theory even empty. This means that what is still in Quadrant 1 is effectively pushed to Quadrant 3 (collapse) or ideally to Quadrant 2—and if not, then at least it is moved to the right within Quadrant 1. Consider, for example, the transport sector: if it switches massively from fossil fuels to renewable energy sources, its EV goes from very negative to somewhat negative (because many materials such as metals are still needed), and its SV improves due to health effects. On balance, SV&EV is then probably located at the boundary of Quadrants 1 and 2. In the automotive industry, that movement has already been initiated under Tesla’s leadership (though the lithium batteries have a negative environmental impact).
Of course, the value creation matrix also raises new questions. For example, how can it be created and populated with data for entire sectors and economies? How can we measure it and account for it? How can we change and move to Quadrant 2? As explained earlier, there are societal forces at work to measure and price social and environmental externalities and thus stimulate companies to move to Quadrant 2. The foundations of monetising SV and EV are not only forced internalisation through regulation and taxes but are also ethically based—companies should operate within social and planetary boundaries (see Chap. 1). Ethical standards recognise the existence of universal rights of current and future generations and the corresponding responsibility of economic actors, including companies, to respect these rights (Impact Economy Foundation, 2022). These rights include the following:
1.
Human rights, such as the rights to life, freedom from degrading treatment or punishment, access to health care and education
2.
Labour rights, such as the rights to fair wages, to a safe and healthy work environment, to unionise, and to freedom from discrimination and
3.
Environmental rights, such as the rights to a healthy environment and natural resources
2.3 Quantifying Integrated Value Creation
Measuring SV and EV is often dismissed as too difficult, and while this was long true, it is no longer a valid excuse. Although not yet standardised, the methods are now available to measure current and historical SV and EV, both at a product level and at a company level (De Adelhart Toorop et al., 2019; Serafeim et al., 2019).
Measuring Historical Value Creation
Measuring SV or EV takes a three-step process:
1.
Determine material S and E issues
2.
Quantify the S and E issues in their own units (Q)
3.
Put a monetary value on those S and E units through shadow prices (SP)
Let us illustrate the three steps, using an airline as an example. In the first step, material S and E issues are determined, for example, by means of academic research, the SDGs, stakeholder interviews, or using checklists such as those of Impact Institute. For an airline, material E issues include carbon emissions, aerosol loadings, nitrogen emissions, and loss of biodiversity. The airline’s material S issues likely include the employment benefits of employees, passenger well-being, health, and subsidies and taxation.
In the second step, the S and E issues are quantified. For some issues that is relatively straightforward to do, for example for carbon emissions where measurement standards are well-developed. The carbon emissions of many listed airlines can now be found in their annual report. Air France-KLM reports 34.2 million tons of carbon emissions over the 2019 fiscal year. It’s harder to quantify for aerosol loadings and certainly harder for biodiversity, since the latter lacks a standard indicator. In such cases, estimates can be made, based, for example, on academic models or anecdotal evidence. On the social side, the value of passenger well-being related to family, holiday, or work-related visits can be estimated, and the value of work can be expressed in living wages.
In the third step, a monetary value is put on the units of S and E to arrive at values, i.e., SV and EV. For example, a company’s carbon emissions can be multiplied by a shadow carbon price. Using a shadow carbon price of €100 and multiplying that by Air France-KLM’s 2019 emissions of 34.2 million, we arrive at a negative value of €3.4 billion per year (i.e. a flow, not a stock), for one component of Air France-KLM’s EV. This is highly material, as this component on its own is three times the size of the company’s annual EBIT of that same year (€1.1 billion). Similar to EV, components of SV can be calculated by multiplying the well-being of visits by the monetary value of well-being and the worked hours by relevant wages. Passenger or consumer well-being is calculated as the consumer surplus, which is the difference between the price of a product and what consumers want to pay for it (we show in Chap. 5 how consumer surplus can be calculated). Note that these calculations give yearly amounts, i.e. flows for an integrated profit and loss (P&L) account, not the stocks to be used on a balance sheet. We will return to these issues in Chaps. 5 and 15. Box 2.4 calculates the integrated profit of Ambuja Cements.
Box 2.4: The Integrated Profit of Ambuja Cements
In 2014, True Price, together with EY, Deloitte, and PwC, published the report The Business Case for True Pricing. It includes, among other things, a calculation of the integrated price of roses from Kenya. The report also features a case study that calculates the integrated profits of Ambuja Cements, the Indian subsidiary of construction materials giant LafargeHolcim.
The study estimated Ambuja’s E and S income at approximately €760 million, thanks to waste solutions for other industries, strategic social investment, and contributions to the local economy (see Fig. 2.7). This was compared to E and S costs of approximately €690 million, mainly due to emissions of CO2, SOx (sulphur oxide), NOx (nitrogen oxide), and dust. Ambuja’s total value, including the net social and environmental benefits of approximately €70 million, was 60% higher than its financial value. On balance, Ambuja’s activities might be in Quadrant 2 (win–win), but—especially on E—there is also a lot in Quadrant 1 (exploitation). Moreover, the substantial amounts involved imply that the company is at risk if certain social costs are internalised—i.e. are no longer borne by society but paid for by Ambuja in the form of taxes or additional costs.
A bar graph of the dollars versus the environmental and social impacts of value management. The bars represent the positive and negative impacts. The negative environmental impacts and positive social impacts have high bar values.
Fig. 2.7
Environmental and social impacts at Ambuja Cements. Source: Adapted from True Price (2014)
×
For Ambuja’s management, the analysis showed that carbon emissions, water consumption, and social investment offer the best potential to improve the company’s net social value at low operating costs.
Measurement can be done, but it is still the exception rather than the rule. Over time, companies will most likely be required to report on this, and standardised accounts will emerge. In the absence of sufficient reporting, we will need to estimate companies’ value creation profiles, as we did for Air France-KLM.
Estimating Future Value Creation
Note that the above calculations refer to historical value creation and value destruction, while finance is about the future. It therefore requires a view on and an assessment of value creation in the future. Therefore, when considering Air France-KLM, we need to ask how much value the company will be creating or destroying. We estimated the company’s value destruction on carbon to be €3.4 billion per year for 2019. However, what will it be in 2025, 2026, etc.? We could estimate it by extrapolating its emissions and the shadow carbon price, which would likely result in gradually-rising value destruction (Table 2.3).
Table 2.3
Projecting expected value creation/destruction
2025
2026
…
2030
Expected carbon emissions (1)
Shadow carbon price (2)
Expected value destruction on carbon (3) = (1) × (2)
However, there is an interaction with the real carbon price. Air France-KLM’s value destruction is so large exactly because it effectively does not have a carbon price: the European carbon pricing regime does not apply to the airline industry, there is no taxation of kerosene, and there is no VAT on ticket prices. That can all change though, through the process of internalisation. Internalisation means that the burdens of externalities are increasingly shifted back from society to the companies and consumers who cause them. In the case of Air France-KLM, internalisation can, for example, happen by means of taxation on ticket prices. If that happens, ticket prices will rise, and volumes (number of tickets sold, and hence the number of flights made) will fall. That means that both the company’s profits and its emissions will fall, i.e., more value destruction on FV, less value destruction on EV. However, the second-order effects could be different. If Air France-KLM succeeds in emitting less per passenger than its competitors, then it will enjoy a cost advantage that might offset its rise in costs. Therefore, the company might actually improve on both FV and EV—see Table 2.1 as an illustration. Overall, internalisation means that the entire airline industry will have incentives to improve on EV since that helps them on FV as well (by avoiding future taxation).
The example highlights that it is not only important to understand whether companies are value creative or value destructive on SV, EV, and FV. It is also important to understand how to create or destroy such value, and how companies perform against their peers. In addition, how can we assess their ability to do so? Value management concerns efforts to improve a company’s value. In the traditional financial view, it works as illustrated in Fig. 2.8.
A cyclic diagram of value management. The steps are 1. company-level value creation, 2. strong business fundamentals, and 3. strong projects.
Fig. 2.8
Value management (FV only)
×
It starts with strong business fundamentals (most notably a strong competitive position), which allow companies to undertake investment projects that create value, as measured by their positive net present value (NPV, see for more explanation Chaps. 4–6). Those projects have a return on invested capital (ROIC) that is higher than their cost of capital (WACC, or weighted average cost of capital). If all projects have ROIC>WACC, then the same applies to the company, which is then value creative as well.
The picture changes slightly in Fig. 2.9 when taking an integrated view of value. We now need to look at all types of value, as well as their interactions. This implies that we take externalities and internalisation into account. Competitive positions based on negative externalities are not tenable and should be viewed accordingly.
A cyclic diagram of integrated value management. The steps are 1. company-level value creation, 2. strong business fundamentals, and 3. strong projects.
Fig. 2.9
Integrated value management (SV, EV, and FV)
×
The strong business fundamentals are now modified to include minimal negative externalities and a resilient balance sheet. The judgement of the strength of investment projects is no longer limited to a positive NPV but requires positive value creation on SV and EV as well. At the company level, this should result in value creation on all capitals and better preparedness for internalisation processes.
To better assess from the outside the extent to which companies succeed in managing for integrated value, they should report on this management of integrated value. Unfortunately, current corporate reporting practices give limited visibility to SV, EV, and even FV. Significant parts of FV do not appear on corporate balance sheets. The financial value of companies has shifted from tangible assets, such as land, buildings, and machinery, and financial assets, to intangibles such as human capital, processes, data, and innovation. This is particularly true in R&D-intense sectors such as healthcare and information technology and/or in service sectors such as consultancy. The intangibles of the S&P 500 companies have increased from 17% of market value in 1975 to 90% in 2020. For Europe, this trend holds as well, albeit to a lesser extent: intangibles of the S&P Europe 350 companies are valued at 75% in 2020 (Ocean Tomo, 2020). While intangibles account for the vast majority of company value, only a minority of them end up on the balance sheet, namely those that qualify for the strict definition of an asset (i.e. having control over it).
SV and EV tend to be almost completely off-balance sheet (see Fig. 2.10). That is a problem that is only partly mitigated by sustainability reporting, such as on emissions; or descriptions of value creation, such as those propagated by integrated reporting (see Chap. 17). Accountability needs to improve, at least to such a degree that investors and other stakeholders can make reasonable estimates of companies’ value creation profiles. That is, they need to have sufficient information to determine the type of value creation profile in Fig. 2.11.
A block diagram lists the tangible assets, intangible assets, and intangible resources. The tangible asset includes cash and property, plant, and equipment. Intangible assets include brands, licenses, and goodwill. Intangible resources are innovation power, human capital, and non-capitalized brands.
Fig. 2.10
Intangible resources are often off-balance sheet
A positive-negative bar graph of the value creation profile 2020. The bars and their values are as follows. F V, 10. S V, minus 4. E V, minus 15. Data are estimated.
Fig. 2.11
Corporate value creation profile
×
×
Accountability has several implications for companies. First, it means that companies have visibility of their value creation on FV, SV, and EV and provide a reasonable level of transparency on it. Second, they can explain and show how they trade off between creating and/or destroying FV, SV, and EV. Third, companies (and their managers) that are value creative on FV, SV, and EV are rewarded and incentivised accordingly. Fourth, companies that are value destructive on FV, SV, and EV will need to develop a path towards value creation across all value dimensions. Companies do not need to be sanctioned immediately if the value destruction is temporary. But they will have to show a clear and credible commitment to a transition pathway that brings them to zero or net positive value creation on their problematic value dimension.
2.4 Where Does Value Come from? Purpose, Strategy, and Business Models
Since integrated value means that FV, SV, and EV need to be positive, this raises the question of what to prioritise and how to balance these types of value. How do you know what to focus on? We will explore that question more deeply in Chap. 6, but for now we can say that focus and balancing should depend on the company’s:
1.
Purpose
2.
Area(s) of value destruction
Purpose
A company finds focus in its mission or purpose (Mayer, 2018). Why and for what does the company exist? What societal need does it serve? What value does it provide for its customers? How does it do that in the best way? What type of value should it focus on, without losing sight of the other types? For example, Novo Nordisk exists to fight diabetes, which makes SV the most important type of value for this company. Box 2.5 shows a few company statements on purpose.
Box 2.5: Company Statements on Purpose
PepsiCo
Performance with Purpose is about managing PepsiCo with an eye towards not only short-term priorities, but also long-term goals:
Products: PepsiCo continued to reduce added sugars and sodium in its beverage and food portfolios and move its business towards more nutritious products;
Planet: Nearly 80% of PepsiCo’s directly sourced crops globally came from farmers engaged through the company’s Sustainable Farming Program;
People: PepsiCo has now reached 6.4 million women and girls through increased investments in local communities around the world.5
Of course, one could argue that PepsiCo’s negative impact is still large and inherent to its business model.
Philips:
At Philips, we are striving to make the world healthier and more sustainable through innovation, with the goal of improving the lives of 2.5 billion people a year by 2030.6
This purpose looks credible given Philips’ track record and efforts.
Ørsted:
We are a renewable energy company that takes tangible action to create a world that runs entirely on green energy.7
This purpose appears credible, as Ørsted has transformed itself from a fossil fuel-based energy company to a renewable energy company.
It’s different, however, for companies with significant areas of value destruction. Air France-KLM exists to transport people quickly, safely, and comfortably over long distances, which suggests a focus on SV. However, given its large value destruction on EV (and often FV as well), its main challenge should be to operate with minimal environmental damage while taking financial viability into account. To get there, the company will have to take a serious look at its strategy and business model.
Strategy
Based on its mission, focus, and competitive landscape, a company can build its strategy. A strategy can be described as the plan chosen to achieve a desired future state. Hambrick and Fredrickson (2001) argue that many companies think they have a strategy while in fact they do not. For a so-called strategy to be truly a strategy, they claim it needs to have five parts:
1.
Arenas: in which markets is the company going to be active?
2.
Vehicles: how is it going to get there?
3.
Differentiators: how can the company win in the marketplace?
4.
Staging: what will be the speed and sequence of moves?
5.
Economic logic: how can returns be obtained?
Achieving the strategic objectives requires building the right capabilities (key resources & processes) to succeed. This is especially challenging for companies that are stuck in an outdated business model that is highly value destructive on SV, EV, or FV or a combination thereof. The company then needs to adapt its strategy and business model in the transition to a sustainable and inclusive economy. Box 2.7 in Sect. 2.5 provides an example from the car industry.
Business Model
A business model is the representation of how a company creates and delivers value. Johnson et al. (2008) argue that a successful business model has three components:
1.
Customer value proposition: helps customers perform a specific ‘job’ that alternative offerings do not address
2.
Profit formula: generates value for the company through factors such as the revenue model, cost structure, margins, and/or inventory turnover
3.
Key resources and processes: the company has the people, technology, products, facilities, equipment, and brand required to deliver the value proposition to targeted customers. The company also has processes (training, manufacturing, services, etc.) to leverage those resources
For a company to seriously change its value creation profile on FV, SV, and EV, it typically involves strategic changes to the above components of its business model. These strategic changes depend on its competitive position in the markets where it operates. A company should make use of its comparative advantage to create value (Edmans, 2020).
Stakeholder Impact Maps
Companies often deal with SV and EV factors in isolation rather than taking a holistic approach. Additionally, they are not always aware which issues are material to their business. Many issues are potentially material for a company, but only a few are actually material in a specific case. To investigate what their most material issues are, companies can do both internal research and engage in stakeholder dialogues. To structure the investigation, one could devise a stakeholder impact map that outlines the company’s main stakeholders, their main goals, and the way the company helps them (positive impact) or hurts them (negative impact). Table 2.4 provides a template for a stakeholder impact map.
Table 2.4
Stakeholder impact map
Stakeholder group 1
Stakeholder group 2
Stakeholder group 3
Stakeholder group 4
Goals
How the company helps those goals
How the company hurts those goals
Tables 2.5 and 2.6 provide examples for a pharmaceutical company and a social media company—as filled out by the authors and their students. A pharmaceutical company operates in a very different (business) environment than a social media company, and it also has different stakeholders, with different goals and impacts. Only the shareholders and the employees are similar in both examples. Governments show up in both stakeholder impact maps but with very different impacts and goals. When analysing such stakeholder impact maps, one should pay special attention to the frictions between the various goals and impacts, both within the same stakeholder and across stakeholders. Those frictions can be a good indication of the problems (or opportunities) ahead. Stakeholder maps are thus a good starting point for integrating sustainability into valuation (see Sect. 2.5).
Table 2.5
Stakeholder impact map for a pharmaceutical company
Patients
Governments
Shareholders
Employees
Doctors and hospitals
Insurers
Short-term goals
Survival, affordability, and accessibility
Reduce healthcare costs
Maximise financial return
Good work–life balance and pay
Doctors get sweeteners; hospitals minimise costs
Minimise costs
Long-term goals
Better health outcomes at decent price
Better health outcomes at decent price
Maximise financial return
Personal development and financial security
Better health outcomes at decent price
Better health outcomes at decent price
Positive impact
Treatment and possibly cured
Population health
High prices and high growth, new drugs drive share price
Remuneration and job fulfilment
Good treatment outcomes
Fewer additional costly treatments
Negative impact
High cost
Fees (prices) paid
High R&D costs, high risk
Potential company reputation
High prices
High prices
Table 2.6
Stakeholder impact map for a social media company
Users
Advertisers
Shareholders
Employees
Governments
Short-term goals
Connect and share
Get more customers
Maximise financial return
Good work–life balance and pay
Control of information, data security; battle distorted news
Long-term goals
A good life
Better understanding of customer needs
Maximise financial return
Personal development and financial security
Protect the state and the people
Positive impact
Connect people, widen their opportunity to express themselves
Reach users in a targeted way, save costs elsewhere
High growth drives share price
Remuneration and job fulfilment
Reach people
Negative impact
Privacy, addiction
Unease at high value (valuation)
Potential company reputation
Might affect public opinion in a way that undermines government
2.5 Transition
The move from a negative social and/or environmental value (Quadrant 1 in Table 2.2) to a positive value profile across all three value dimensions—financial, social, and environmental (Quadrant 2 in Table 2.2)—is often part of a wider transition in the economy. Transition is about transformational change rather than incremental change. It is seen as an iterative process of building up a new regime and breaking down an old regime over a period of time, with disruptions along the way. Figure 2.12 shows the x-curve of transition dynamics.
An illustration of an X-curve with transition dynamics. Optimization, destabilization, and disruption are transitioned to breakdown and phase-out. Experimentation, acceleration, and emergence are transitioned to institutionalization and stabilization.
Fig. 2.12
The x-curve of transition dynamics. Source: Adapted from Loorbach et al. (2017)
×
The SDG agenda in Chap. 1 sets the stage for the transition to a sustainable and inclusive economy. Several transitions can be identified:
1.
Climate—energy transition: Moving from the use of fossil fuels to renewable energy. This does not only have an impact on energy companies—oil and gas companies and electricity utilities—but also on other carbon-intensive sectors, such as manufacturing and mobility.
2.
Raw materials—circular economy: Redesign and recycle products leading to less use of raw materials and fewer carbon emissions (e.g., recycling aluminium saves on carbon emissions in the production of aluminium).
3.
Biodiversity—healthy food and regenerative agri- and aqua-culture: Trend towards healthy food production with respect for land and water. This implies moving from intensive to organic (and regenerative) farming to preserve the quality of the land without the use of fertiliser and pesticides. In addition to preserving biodiversity, land restoration and reforestation provide watershed function and carbon absorption. Protecting biodiversity also implies no overfishing and preserving ocean health.
4.
Labour practices—social transition: Trend towards decent labour practices across the value chain of production. Decent labour implies paying a living wage, ensuring safe working conditions and respecting human rights.
Transitions are, of course, not only constrained to moving to a sustainable economy. Other examples of major transitions in society are digitalisation and ageing population.
Transition and Value
Transitions can have major implications for company value. A company that adapts to the new world in a timely manner can realise its integrated value potential. In contrast, a company that follows a business-as-usual path and fails to adapt can lose its value and go bankrupt. An example is Kodak, which failed to see the digital transition in the photography industry (see Box 2.6 below).
Following Schoenmaker and Schramade (2022), we can formalise the expected transition losses ETLij for company i in sector j as follows:
where EATij represents the exposure at transition. It measures which part bj of company i’s value Vi is exposed to transition: EATij = bj ∙ Vi. Figure 2.13 shows the extreme case of bj = 1, where the full sector j is in transition from conventional to sustainable products. Transition exposure ranges from no transition to full transition: bj ∈ [0, 1]. The assumption is that the sectoral transition bj is representative of all companies i in that sector. Sectors that are characterised by large negative effects and the availability of substitutes (that address these negative effects) tend to have a high bj.
The second variable PTj represents the probability of transition for sector j. The size and timing of transition are uncertain. Scenario analysis (see Sect. 2.2) can be used to determine the probability of transition of a sector. This analysis contains different scenarios for the degree of transition and the timing of transition. Figure 2.12 shows that transitions do not happen smoothly, but shock-wise along a dynamic time-path. In the case of fundamental uncertainty about the timing and direction of transition, real option analysis can be used (see Chap. 19).
The final variable LGTi is the loss given transition. This loss depends on company i’s adaptability ai to transition, whereby LGTi = (1 − ai). A company can recover or retain its value by adapting to transition. In that way, it can limit its expected transition loss. A company can anticipate societal trends by building capabilities to learn about and serve these new societal needs as part of its strategy. ai is non-negative with the following range: ai ∈ [0, 1]. ai = 1 denotes the case where a company can fully adapt to the new world, allowing it to reach its long-term value potential. As seen from Eq. (2.1), the expected transaction losses are then zero: ETLij = bj ∙ Vi ∙ PTj ∙ (1 − 1) = 0.
ai depends on management quality. Doda et al. (2016) assess a company’s management quality with regard to sustainability through the following five levels:
1.
Unaware of (or not acknowledging) sustainability as a business issue
2.
Acknowledging sustainability as a business issue: the company adopts a sustainability policy
3.
Building capacity: the company develops its basic capacity, its management systems and processes, and starts to report on sustainability performance
4.
Integrating into operational decision-making: the company improves its operational practices, assigns board responsibility, and provides comprehensive disclosures on its sustainability performance
5.
Strategic assessment: the company develops a more strategic and holistic understanding of risks and opportunities related to the sustainability transition and integrates this into its business strategy and capital expenditure decisions
Those companies that are the first in the industry to incorporate sustainability into their strategy are the early adopters, who can capture first-mover advantages (e.g., higher margins with a price skimming strategy and a strong brand name capturing consumer surplus) or at a minimum avoid missing out on the new market standard. These early adopters thus minimise expected transition losses. Although early adopters face technological uncertainty (and related R&D investments), they can execute a successful price differentiation strategy that allows them to generate higher profit margins. The transition model of Eq. (2.1) shows that companies should be early in building the capabilities that give them the option to enter the market with new technologies and business models. The focus of the model is on companies’ competitive position in navigating transitions.
We illustrate the working of transition valuation with company cases from the photography industry in Box 2.6 and the car industry in Box 2.7.
Box 2.6: Transition to Digital Photography: Kodak
The Eastman Kodak Company was established by George Eastman in 1881. It was a leading company in photography in the twentieth century. However, Kodak kept its print-based photos (business-as-usual) and failed to see the transition to digital photography ai = 0. Kodak lost its full value and filed for bankruptcy in 2012.
In terms of Eq. (2.1): ETLij = bj ∙ Vi ∙ PTj ∙ (1 − ai) = 1 ∙ VKodak ∙ 1 ∙ (1 − 0) = 1 ∙ VKodak.
Box 2.7: Transition Towards Electric Driving
The car industry is currently undergoing a transition to electric driving. Tesla, the US electric carmaker, is ahead in its capabilities and can quickly scale up its production capacity to serve increased demand. Traditional German carmakers are behind and are losing market share. Some traditional carmakers, such as Volkswagen, are catching up at high cost.
The difference in capabilities is summarised in the Bloomberg article titled VW’s Boss Warns the Troops: We Don’t Want to End Up Like Nokia: ‘Volkswagen is at a critical juncture. It has electric cars rolling out but is well behind Tesla. And it has massive manufacturing scale but desperately needs to rethink its vehicles as rolling software devices. It is this last issue that CEO Herbert drives home with VW’s more than 635,000 employees. The transition in competencies from industrial might to software prowess will be an immense challenge for automakers that are vast, deliberate and some say ripe for disruption. Car companies that get it wrong risk ending up like Nokia—failed hardware makers doomed by more nimble and technologically adept upstarts’. (Rauwald et al., 2020).
Figure 2.13 depicts the transition curve from 2010 to 2030. Over this 20-year period, the car industry is transitioning fully from traditional combustion engine cars to electric cars. In terms of Eq. (2.1), bj = 1 and PTj = 1. Tesla is fully prepared for the electric vehicle market with aTesla = 1, while VW is only partly prepared with aVW = 0.4 (Kurznack et al., 2021). Therefore, transition losses may amount to 60% of VW’s value: ETLij = bj ∙ Vi ∙ PTj ∙ (1 − ai) = 1 ∙ VVW ∙ 1 ∙ (1 − 0.4) = 0.6 ∙ VVW.
A dual-line graph illustrates the demand for electric cars from 2010 to 2030. Tesla and Volkswagen follow an increasing trend and reach 100% and 40% in 2030 respectively. Data are estimated.
Fig. 2.13
Transition to electric driving
×
These examples show the importance of adaptability or transition preparedness. A shortfall in adaptability has large value implications. Companies can invest in their capabilities to adapt. The Volkswagen case in Box 2.7 shows that catching up not only comes at a high cost but also faces huge implementation challenges (i.e. hiring large numbers of software engineers). When deciding on investment in adaptability capabilities, a company can then compare the cost of the investment with the benefit of a reduction in expected transition losses. Example 2.1 shows the calculation for a major food company, such as Unilever, Danone, or Nestlé.
Example 2.1: Investing in Healthy Food
Problem
Consider a food company with a value of €10 billion. Half of the company’s current product portfolio does not adhere to emerging standards of healthy food. The probability of transition to healthy food is 80%. It has a low adaptability for the fresh food transition of 0.3. The company can invest €1.5 billion to improve its adaptability to 0.8. Should the food company invest in this transition?
Solution
Step 1: calculate the expected transition losses with the current product portfolio using Eq. (2.1):
The reduction in expected transition losses is €2 billion (= €2.8 billion – €0.8 billion). This is the benefit. The cost of the investment is €1.5 billion. The food company should do the investment, which has a net present value of €0.5 billion.
Transition Pathways
The transition model can be applied to companies. When a company is value destructive on any type of value—FV, SV, or EV—it needs to find a credible transition pathway in line with social and planetary boundaries towards positive value. Therefore, if a company has a value creation profile similar to that in Fig. 2.11, it should have a path towards net positive, as shown in Fig. 2.14.
2 positive-negative bar graphs compare the value creation profiles in 2020 and 2040. The bars and their values in Graph 1 are F V 10, S V minus 3, and E V minus 15, and in Graph 2 are F V 10, S V 4, and E V 2. Data are estimated.
Fig. 2.14
Shifts in value creation profiles
×
It is great if a company can achieve such a shift, turning both SV and EV from negative to positive while maintaining positive FV. Having the vision is a start. However, 20 years is a long time and might imply making little to no changes for a long time—at the cost of significant value destruction. To be credible, the company will have to be more specific on how it’s going to get to its goals. What concrete and quantifiable targets does the company have for reducing its value destruction in the near future? What indicators can investors and other stakeholders monitor to see if the company is on track? Are capital expenditures geared towards new capabilities instead of old business lines? Are those targets in line with a 1.5 degree global warming scenario? What will its value creation profile look like in 2025? It is quite plausible that some FV has to be given up to achieve the 2040 goals (see the left profile in Fig. 2.15). Not changing at all might force the company to give up FV to an even larger extent (right profile in Fig. 2.15). Business as usual is often an illusion. If an oil company claims to be serious about becoming carbon neutral, then why does it direct the majority of its capital expenditures towards finding new oil?
2 bar graphs compare the changing value creation profile in 2025 and business as usual value creation profile in 2025. The bars and their values in Graph 1 are F V 5, S V 0.5, and E V minus 7, and in Graph 2 are F V 2, S V minus 3, and E V minus 15. Data are estimated.
Fig. 2.15
Alternative shifts in value creation profiles
×
2.6 Steering Your Company on Integrated Value
This chapter shows how companies can survive in the market by adapting their business model to changing circumstances in a timely manner. Failing to do so would put company survival at risk, as witnessed by the case of Eastman Kodak. Chapter 1 highlights the need for companies to respect social foundations and planetary boundaries in order to keep their licence to operate. Figure 2.16 summarises steering on integrated value, subject to these constraints.
A block flow diagram of integrated value to goal and constraints. The goals include the financial, social, and environmental values followed by constraints like accounting for transition, social foundations, and planetary boundaries respectively.
Fig. 2.16
Optimising integrated value subject to constraints
×
Figure 2.16 indicates that the company should steer according to financial value, social value, and environmental value in an integrated way. This is the process of optimising the company’s integrated value. In this process, the company faces important constraints:
Transitions
Social foundations
Planetary boundaries
The constraints work as follows. First, companies need to survive the transitions in the market. This chapter discusses how to do that. With a future-proof business model, companies can attract funding and avoid bankruptcy. Chapters 3–19 show how companies can do that.
Modern companies recognise that they also need to operate within social and planetary boundaries. The ‘why’ and ‘what’ of these social and planetary boundaries have already been discussed in Chap. 1. Again, Chaps. 3–19 show how companies can operate within these boundaries.
There we introduce the pillars of financial value, social value, and environmental value in subsequent sections. The final section integrates these three dimensions into integrated value, as there are interactions between the pillars.
2.7 Conclusions
This chapter discussed what it means for companies to create value on FV, SV, and EV. It requires a clear view of all types of value creation, and of how they are to be prioritised. For the alignment of all types of value, the prospect of internalisation is crucial. Internalisation means that the burdens of externalities are shifted back from society to the companies and consumers who cause them. If companies’ FV depends on the exploitation of an external impact (i.e., FV at the expense of SV or EV), that FV will be affected if and when internalisation occurs. Moreover, there are ethical standards that companies are expected to meet to retain their social licence to operate.
Unfortunately, current corporate reporting does not facilitate the measurement or even estimation of SV and EV. Therefore, to identify value creation on SV and EV, stakeholders can use analytical shortcuts such as the Value Creation Matrix. Measurement methods do exist but are not yet standardised or widely used. Ultimately, reporting on value creation should be:
Historical and forward-looking
About all types of value that are material
In their own units (e.g. tonnes of carbon emissions; life years saved) and
In monetary terms (in $ or €) by applying shadow prices
As companies aim to create value on FV, SV, and EV, they should have a picture of their current value creation profile. Based on their purpose and area(s) of value destruction, they can then adjust their strategy and business model accordingly. In the case of serious value destruction, they should be able to outline a credible transition pathway. As the next chapter will discuss, governance and ownership structures play an important role in ensuring that companies are managed for integrated value. Good management is crucial to build a company’s competitive position and navigate it through the upcoming sustainability transitions.
Key Concepts Used in This Chapter
Business model is the representation of how a company creates and delivers value
External impacts (also called externalities) refer to the consequences of activities that affect other (or third) parties without this being reflected in market prices
Environmental value (EV) refers to the natural capital embedded in a company’s projects and activities
Financial value (FV) refers to the financial and manufactured capital embedded in a company’s projects and activities
Intangibles are assets or resources that are not physical in nature; examples are human capital, goodwill, brand recognition, and intellectual property, such as patents, trademarks, and copyrights
Integrated value is obtained by combining the financial, social, and environmental value in an integrated way (with regard for the interconnections)
Integrated prices (also called true prices) refer to prices that include the hidden costs of social and environmental externalities
Internalisation means that the burdens of externalities are increasingly shifted back from society to the companies and consumers who cause them
Integrated value creation refers to the ability of responsible companies to create both financial and societal value over the long term
Materiality indicates relevant and significant
Purpose (or mission) refers to a company’s desire to serve a societal need
Responsible company manages and balances profit (financial value) and impact (social and environmental value)
Scenario analysis is a process of analysing possible future events by considering alternative possible outcomes (sometimes called ‘alternative worlds’); it can be used to analyse the effects of possible future events on the value of a company
Social value (SV) refers to the human and social capital embedded in a company’s projects and activities
Stakeholder impact map outlines the company’s main stakeholders, their main goals, and the way the company helps them (positive impact) or hurts them (negative impact)
Strategy is the plan chosen to achieve a desired future state
Transition is about transformational change rather than incremental change; it is an iterative process of building up a new regime and breaking down an old regime over a period of time, with disruptions along the way
Transition pathways refer to the strategic blueprint that a company applies to transform today’s business and operating model to capture business opportunities and mitigate the risks posed by tomorrow’s societal trends
Value creation refers to the increase in the integrated value of a company’s projects and activities
Value destruction refers to the decrease in the integrated value of a company’s projects and activities
Open Access This chapter is licensed under the terms of the Creative Commons Attribution 4.0 International License (http://creativecommons.org/licenses/by/4.0/), which permits use, sharing, adaptation, distribution and reproduction in any medium or format, as long as you give appropriate credit to the original author(s) and the source, provide a link to the Creative Commons license and indicate if changes were made.
The images or other third party material in this chapter are included in the chapter's Creative Commons license, unless indicated otherwise in a credit line to the material. If material is not included in the chapter's Creative Commons license and your intended use is not permitted by statutory regulation or exceeds the permitted use, you will need to obtain permission directly from the copyright holder.