6. Lessons Learned from Application of the “Indicators of Resilience in Socio-ecological Production Landscapes and Seascapes (SEPLS)” Under the Satoyama Initiative
Authors
:
William Dunbar, Suneetha M Subramanian, Ikuko Matsumoto, Yoji Natori, Devon Dublin, Nadia Bergamini, Dunja Mijatovic, Alejandro González Álvarez, Evonne Yiu, Kaoru Ichikawa, Yasuyuki Morimoto, Michael Halewood, Patrick Maundu, Diana Salvemini, Tamara Tschenscher, Gregory Mock
Socio-ecological resilience is vital for the long-term sustainability of communities in production landscapes and seascapes, but community members often find it difficult to understand and assess their own resilience in the face of changes that affect them over time due to economic and natural drivers, demographic changes, and market forces among others, due to the complexity of the concept of resilience and the many factors influencing the landscape or seascape. This chapter provides an overview of a project and its resilience assessment process using an indicator-based approach, which has been implemented under the International Partnership for the Satoyama Initiative (IPSI). In this project, a set of 20 indicators were identified to capture different aspects of resilience in SEPLS, and examples are included from various contexts around the world, with the purpose of identifying lessons learned and good practices for resilience assessment. These indicators have now been used by communities in many countries, often with the guidance of project implementers, with the goal of assessing, considering, and monitoring their landscape or seascape’s circumstances, identifying important issues, and ultimately improving their resilience. While this particular approach is limited in that it cannot be used for comparison of different landscapes and seascapes, as it relies on community members’ individual perceptions, it is found useful to understand multiple aspects of resilience and changes over time within a landscape or seascape.
6.1 Introduction and Background
The “Indicators of Resilience in Socio-ecological Production Landscapes and Seascapes (SEPLS)” are a set of 20 indicators for communities to assess the socio-ecological resilience of the production landscapes and seascapes on which they rely for their livelihoods and well-being. While socio-ecological resilience is a complex concept, for the purposes of this project, it is considered that resilience refers to “the capacity of a system to deal with change and continue to develop; withstanding shocks and disturbances and using such events to catalyze renewal and innovation” (Stockholm Resilience Center 2014). The set of indicators has been piloted, field-tested and applied over nearly 10 years through a number of programs, some of which are introduced in this chapter, with the result that communities in the landscapes and seascapes covered by these programs have better understood their own resilience and developed strategies for improvement. The indicators also have an added benefit as a capacity-building tool, as the process of using them for resilience assessment helps local community members to understand how they can be actively involved in resilience improvement through actions on the ground and to learn about concepts that are important for planning activities and project design, but are often unfamiliar to farmers, fishers, and other ground-level practitioners. Resilience assessment stimulates active dialogue among actors with diverse attributes and backgrounds.
The background of the indicators dates back to the beginnings of the Satoyama Initiative, a global initiative to realize its vision of “societies in harmony with nature” through the revitalization and sustainable management of SEPLS. The Satoyama Initiative was established based heavily on research results from the “Japan Satoyama Satoumi Assessment” (JSSA), a multi-year assessment carried out in Japan of satoyama and satoumi, which are Japanese landscapes and seascapes dominated by human production activities, i.e., Japanese SEPLS. Among the JSSA’s findings were that: (1) these landscapes and seascapes are composed of an interlinked mosaic of ecosystem types that are managed to provide for human well-being; (2) they have undergone significant changes in recent years that have caused a drop in their resilience; (3) this trend has important consequences for human well-being and biodiversity; and (4) integrated approaches to address this trend have the potential to reduce biodiversity loss and maintain sustainable flows of ecosystem services (UNU-IAS 2010).
Advertisement
For these integrated approaches to be developed and implemented, a need was identified to first assess resilience in order to be able to maintain and strengthen it. Resilience in production landscapes and seascapes is a function of their dynamic and evolving ecological, social, cultural and economic systems, not of any static set of natural resource uses or species, making it impossible to measure precisely with any simple yardstick. With this complexity in mind, an initial set of indicators was developed jointly by Bioversity International and the United Nations University Institute for the Advanced Study of Sustainability (UNU-IAS). Much of the background and reasoning behind this process was compiled in the policy brief “Indicators of Resilience in Socio-ecological Production Landscapes (SEPLs)” produced by UNU-IAS in 2013 (Bergamini et al. 2013). Findings of the report showed that the indicators approach can help identify gaps in knowledge and areas of intervention to improve resilience in target communities. This report also identified several principles that informed the selection of the indicators, including that they should be easy to understand by local land users; that they should reflect the views of various stakeholders; and that people’s perceptions and needs change over time. In addition to the findings of the JSSA and other research, the indicators were based on case studies collected under the Satoyama Initiative that demonstrated communities’ abilities to build their resilience.
As cited above, the JSSA found that the interlinked nature of SEPLS—meaning interlinkages between people and nature, between different ecosystem processes, between ecosystem services and human well-being, and others—gives resilience to their socio-ecological production systems. This is what makes resilience difficult to measure, and also what previous research found pointed to the need for an indicators approach that considers the social and cultural dimensions of ecosystem functioning including temporal changes (van Oudenhoven et al. 2011). Related research has found that community-level resilience encompasses a diversity of ecological, socioeconomic, and other variables, suggesting that an integrated model could be used for assessment of resilience based on a matrix of these variables (Antwi et al. 2014). The indicators were therefore designed to allow local communities to monitor social dimensions in addition to ecological factors, and also to help implement and evaluate conservation approaches, as informed by the Satoyama Initiative case studies (Bergamini et al. 2013). Because this indicator approach is based on community members’ perceptions, it is limited in that it cannot be used for comparison of different SEPLS, rather collecting subjective information for the use of the community itself.
After the initial set of indicators was field-tested and applied in projects in over 20 countries, the indicators were further refined and updated, and a “Toolkit” publication was published to facilitate their use in 2014 (UNU-IAS et al. 2014). The toolkit provides a revised set of the 20 indicators, practical guidance on how to use them for resilience assessment, and examples of their use from the field. The current set of indicators and methodology are now being used by projects working to improve resilience in communities around the world. This chapter provides an overview of the indicators, some examples of how they are used in projects, and findings from these processes and projects.
6.2 The Indicators and Resilience Assessment
As mentioned above, the 20 indicators have been selected to help communities assess the resilience of the socio-ecological systems in the landscapes and seascapes on which they rely for their well-being. The indicators are grouped into five areas, outlining practices and institutions that contribute to resilience in SEPLS and account for the specific social and ecological functions and components that make up the SEPLS system as follows:
Advertisement
Landscape or seascape diversity and ecosystem protection
1.
Landscape/seascape diversity
2.
Ecosystem protection
3.
Ecological interactions between different components of the landscape/seascape
4.
Recovery and regeneration of the landscape/seascape
Maintenance and use of local crop varieties and animal breeds
7.
Sustainable management of common resources
Knowledge and innovation
8.
Innovation in agriculture and conservation practices
9.
Traditional knowledge related to biodiversity
10.
Documentation of biodiversity-associated knowledge
11.
Women’s knowledge
Governance and social equity
12.
Rights in relation to land/water and other natural resource management
13.
Community-based landscape/seascape governance
14.
Social capital in the form of cooperation across the landscape/seascape
15.
Social equity (including gender equity)
Livelihoods and well-being
16.
Socioeconomic infrastructure
17.
Human health and environmental conditions
18.
Income diversity
19.
Biodiversity-based livelihoods
20.
Socio-ecological mobility
Each of the 20 indicators listed above is provided in the toolkit publication (UNU-IAS et al. 2014) with a description, examples where appropriate, a question to be asked in assessing the indicator, explanations of high and low scores, and additional discussion questions where appropriate. The indicators are intended to be scored by individual participants first, then collectively among all participants, on a scale from 1 to 5, with 1 meaning the situation is least likely to be conducive to resilience, and 5 meaning the most favorable situation. For example, for the first indicator, “landscape/seascape diversity,” a score of 1 would mean an extremely low level of diversity of natural ecosystems and land uses in the landscape or seascape, while a score of 5 would indicate high diversity, considered likely to contribute to resilience. In many cases, the temporal trend of the indicator may also be assessed, indicating whether the situation is perceived to be improving, deteriorating, or unchanging.
While anyone can use these indicators in whatever way and for whatever purpose they like, the process presented in the toolkit publication is a community-based resilience assessment workshop, which allows for an interactive and participatory process for community members to understand and discuss resilience. In these workshops, a representative group of landscape or seascape residents along with any other relevant stakeholders, with as broad as possible representation in order to ensure equity and diversity of voices, is invited to take part. The procedure of the workshop may vary depending on the purpose and intended outcomes of using the indicators. Generally, the agenda should include: an introduction to key concepts; explanation of the purpose of the workshop; exercises such as community mapping and/or creating historical timelines; scoring of the indicators themselves; and discussion of the results of the scoring. This process not only collects community members’ opinions, but gives them a chance to consider the shape and conditions of their own landscapes and seascapes, and understand concepts and topics such as “biodiversity” and “resilience.” These concepts may be more commonly used in academic or policymaking circles than among community members on the ground, but are important for all participants to understand in order to have an assessment that is accurate and based on common understanding. The dialogue that takes place during the assessment can reveal rich information on how stakeholders view their landscapes or seascapes similarly or differently, and stimulates discussion among actors who may not have regular interactions (e.g., elders and youth, different ethnicities, socioeconomic statuses).
Information and opinions on landscape and seascape resilience collected through this process have been used for a variety of purposes. Some examples are given in the next section of this chapter and include: to identify a baseline for producing a sustainable development strategy at the landscape/seascape level and design projects to implement the strategy, as seen in the cases in Sects. 6.3.1 and 6.3.2; for monitoring and evaluating the effectiveness of ongoing resilience-strengthening programs, as in Sects. 6.3.3 and 6.3.4; and as data for academic research projects, as in Sect. 6.3.5.
6.3 Experiences Using the Indicators of Resilience
6.3.1 Use of the Indicators to Facilitate Participatory Governance and Decision-Making: The COMDEKS Program
The “Community Development and Knowledge Management for the Satoyama Initiative” (COMDEKS) program has, since 2011, piloted a community-based model of landscape management in 20 landscapes and seascapes around the world, with the core objective to restore resilience in the face of a changing climate and socioeconomic challenges, protect biodiversity, and sustain SEPLS. The indicators are one of the principal tools employed by COMDEKS to gather information on current conditions and trends in different dimensions of resilience, link them to management practices past and present, and deepen community understanding of what these observations mean in relation to resilience. Repeated use of the indicators allows for adaptive management, where assessment results are used to continuously update activities in line with community needs. COMDEKS is implemented by the United Nations Development Programme (UNDP) in partnership with the Ministry of the Environment of Japan, the Secretariat of the Convention on Biological Diversity, and UNU-IAS, and is funded by the Japan Biodiversity Fund. The Global Environment Facility Small Grants Programme (GEF SGP) functions as its delivery mechanism and provides co-financing as well as technical and human resources to oversee its implementation.
The COMDEKS methodology relies on community consultation to drive a process of participatory landscape planning, and the indicators are central to the community consultation process. As part of this process, community members and other stakeholders come together to conduct a baseline assessment using the indicators, which is then used to define a “landscape strategy.” Based on community perspectives and priorities delineated in the landscape strategy, projects in the community are identified and provided funding to implement the strategy. The indicators are integral to discussion, analysis, and negotiation in the processes of generating baseline information, reaching consensus on major challenges to local resilience, and developing a plan of action to address these challenges. Because of their effectiveness in promoting group discussion and interaction, they are also critical in generating the social capital necessary to undertake community-driven projects.
Under COMDEKS, target communities come together to discuss and score each indicator during a workshop organized as part of the baseline assessment of the landscape or seascape. This process is just as important for its educational purposes as for its role in generating data. Experience has shown that discussing and scoring the indicators acts as an effective introduction to the principles of landscape and seascape resilience. First, group discussion before scoring provides an opportunity to talk about resilience with local examples. The scoring exercise itself grounds this more general discussion in local experience, acting as a means to consider landscape conditions and trends and what they mean for resilience. Gaining an appreciation for the concept of resilience and how it manifests locally is one of the most important factors for the community in the early stages of the COMDEKS process.
The scores given for each indicator by stakeholders during the baseline assessment workshop provide essential input for the community to develop its landscape strategy. This is the most critical part of the planning process, where the community comes up with a vision of what a more resilient landscape would look like and determines what actions would be required to realize this vision. Although the scores are not quantitative measures of resilience, they do help identify potential problems that the strategy can address through COMDEKS projects.
An ex-post baseline assessment carried out at the completion of COMDEKS projects also uses the indicators to identify changes in resilience. A workshop similar to that carried out for the baseline assessment is held, at which the indicators are again scored by the community, and these scores are compared with the earlier ones. Although comparing the scores from the baseline assessment with those from the ex-post assessment cannot be used as a quantitative measure of landscape resilience change, it can be used to highlight local perceptions of changes due to the completed projects, and other factors affecting landscape resilience, and to indicate progress toward the goals identified in the landscape strategy and recommend adaptive measures. Thus, the indicators are an integral feature of COMDEKS implementation from beginning to end. They are also key to the adaptive management cycle that COMDEKS is based on, in which project results are used as a source of learning and innovation for future community efforts. The indicator scores, in addition to other progress metrics, are essential elements in monitoring and evaluation (M&E) processes.
The COMDEKS program has shown that besides facilitating a common understanding and vision for participatory landscape and seascape management among local stakeholders, the indicators can play an important part in giving community-level interventions legitimacy in the eyes of policy makers. By involving policy makers in the process and helping them to understand the elements that benefit resilience, and further by demonstrating that these elements can be considered and evaluated systematically, experience using the indicators has in some cases made it easier for policy makers to consent management actions designed to rebuild and sustain resilience.
Similarly, the indicators contribute greatly to resilience-focused SEPLS governance. They offer a method for assessing landscape changes as perceived by local landscape users, and evaluating landscape interventions as part of an adaptive management process. As such, they represent a potentially powerful tool for governance and sustainability planning. Community-based management actions based on their use have already proven effective in protecting local biodiversity while enhancing rural livelihoods and revitalizing local cultures in landscapes and seascapes covered under the COMDEKS program (UNDP 2018).
6.3.2 Using the Indicators for Community Benefits Under the “GEF-Satoyama Project”
The project “Mainstreaming Biodiversity Conservation and Sustainable Management in Priority Socio-ecological Production Landscapes and Seascapes” (or the “GEF-Satoyama Project”) was developed with the aim of achieving societies in harmony with nature with a sustainable primary production sector based on traditional and modern wisdom, to make significant contributions to global targets for conservation of biological diversity. The project consists of three mutually interacting components: on-the-ground demonstration, with investments in ten subgrant projects in ten countries from the Indo-Burma, Tropical Andes, and Madagascar and Indian Ocean Islands Biodiversity Hotspots; knowledge generation through case studies and mapping; and capacity-building and awareness raising. The GEF-Satoyama Project is funded by the Global Environment Facility (GEF), implemented by Conservation International and executed by Conservation International Japan in cooperation with UNU-IAS and the Institute for Global Environmental Strategies (IGES).
The indicators were applied for baseline and progress monitoring under the GEF-Satoyama Project. All ten proponents of the site-based projects1 conducted assessments using the indicators of resilience at the beginning and end of the implementation of their projects’ interventions to document the status of landscape or seascape resilience. The assessment is designed as a participatory process that engages a variety of stakeholders including community members, civil society organizations, government agencies, and others. The use of the indicators enables the identification of priority actions for local innovation and implementation of adaptive management through community-led activities.
Toward these ends, training in the use of the indicators was provided to the project proponents, their partners, and other stakeholders, to enable them to contribute to building environmental and social resilience on the ground. Some of the key benefits gained from the application of the indicators in the GEF-Satoyama Project are discussed below.
Recognizing the value of nature
According to the results of the use of the indicators under the GEF-Satoyama Project, resilience assessment helped community members to re-evaluate nature in their communities through discussion of the diversity of flora, fauna, and food sources; the exercise of mapping their landscapes and seascapes; scoring of the indicators; and sharing and understanding their reasons for scoring them as they did. The discussion also helped local communities to revisit their history and socio-ecological and political conditions related to how they have engaged with their landscapes and seascapes, share their perceptions related to nature and their management, and recognize the evolution of their SEPLS. In turn, this encouraged more active participation of local communities in the development of participatory management plans, conservation practices, natural resource management, and enforcement. In the project in Zunheboto District of Nagaland in northeast India, conducted by The Energy and Resources Institute (TERI), the villagers of Sukhai, Ghukhuyi, and Kivikhu had become concerned that they were consuming too much wildlife, which led them to establish a community conserved area (CCA) in their territory. CCAs are areas voluntarily put into protection by communities for the purpose of conservation through consensus under self-imposed management rules. Although the ban on hunting has an economic impact on all community members due to loss of income from wildlife sales, after carrying out the resilience assessment they agreed that they could benefit more from conservation through activities such as ecotourism involving bird and butterfly watching. Activities also include making use of available natural resources by revitalizing their traditional weaving of handicrafts or shawls, a skill that only a few women currently possess. During the resilience assessment, members of the communities recognized that they still have extraordinarily rich biodiversity in their ecosystems. However, many of them found that unique ecosystems and the associated natural resources they were benefiting from were declining in size and quality, and understood the need to take more rigorous management measures to keep receiving these benefits. Thus, the resilience assessment helped them to identify challenges in their SEPLS, and encouraged active engagement of local communities to develop and implement natural resource management plans.
Revitalizing indigenous and local knowledge
The resilience assessments also evaluated local knowledge systems, including indigenous, local, and women’s knowledge. This exercise helped local communities to recognize and take stock of their indigenous and local knowledge and how they utilize, maintain, and transfer the knowledge to the next generation. They also considered how they can innovatively use new knowledge integrated with traditional knowledge within their SEPLS. For instance, in a rainforest community in Makira Natural Park in northeastern Madagascar under the project conducted by Wildlife Conservation Society-Madagascar, people found that they are active in innovation in agriculture and conservation practices such as changes in intensive and improved rice cultivation systems using a “system of rice intensification” and “improved rice system”; establishment of permaculture and agroforestry; and reactivation of clove and cacao plantations to help against erosion. At the same time, they found that transmission of local knowledge still exists verbally, with elders having the impression that younger generations do not show much interest in learning about medicinal plants but rather prefer modern medicines. As a result of the resilience assessment workshop, local communities agreed to collect documents that provide knowledge about biodiversity, and to build a database to be used by school programs and for distribution of information.
Similarly, most of the communities under the GEF-Satoyama Project were reminded of their indigenous, local, and women’s knowledge through the assessment workshop and recognized that this knowledge was not being appropriately transferred to the next generation. Thus, many of them came up with some means for local documentation or improvement of communication among community members.
Strengthening local governance and social equity
The micro-watershed of the Las Cruces stream in the central Santander District in northwest Colombia is an area that was “opened” for use after the military conflict between the Revolutionary Armed Forces of Colombia (FARC) and the National Liberation Army (ELN) ended. The management of natural resources occurs mainly at the agroforestry farm level, and there are no formal efforts to manage natural resources. The project proponent, Universidad Industrial de Santander, used three indicators related to regulation and local protection practices: “ecosystem protection”; “maintenance and use of local crop varieties and animal breeds”; and “sustainable management of common resources.” The use of these indicators helped community members to evaluate and begin to improve local management systems and issues related to equity, which is of importance to re-inhabited post-conflict areas. Since the state entity in charge of environmental issues in the region (the Regional Autonomous Corporation) restricts the extraction of native timber species from farms where people take care of them, resilience assessment workshop participants felt that they should have greater autonomy in this regard. They showed a growing interest in environmental issues for conservation and to influence communal well-being. The participants also identified serious weaknesses related to cooperation between farmers as well as with other organizations. As a result, they agreed that trust and social capital within the community needed to be strengthened to make real transformation in the landscape.
Under the GEF-Satoyama Project overall, the assessments using the indicators provided a platform for community members, key stakeholders, and project proponents to come together and evaluate the current status of their landscapes and seascapes and share their perceptions with others. They came up with ideas for strengthening governance including official and community regulations, communication, and organizational mechanisms to realize natural resource management in the community. In many cases, assessment participants tried to strengthen collaboration with policy makers to seek better management options. Besides establishing a baseline against which the achievements of the project are measured, resilience assessments provided opportunities to:
Explore traditional and local knowledge, history, and social and political conditions in the area
Share strengths and weaknesses of the SEPLS among community members and other stakeholders
Stimulate dialogue among different community groups and stakeholders that normally do not interact to a significant extent and thus deepen the understanding of differing perceptions toward the landscapes and seascapes
Understand the needs of local communities
Strengthen trust between project proponents and the stakeholders
The documentation of the discussion stimulated by the process of attempting to reach consensus scores for the indicators is an asset that endorses participants’ thinking, and which will remain as a valuable reference for the future.
6.3.3 A Case Study in Agrobiodiversity from Sierra del Rosario Biosphere Reserve, Cuba
Bioversity International is a global research-for-development organization that puts plant and tree genetic diversity, which nourishes people and sustains the planet, at the heart of its work. Most plant genetic diversity is found in small-scale, traditional agricultural systems largely concentrated in developing countries of the global south, while the productivity and resilience of the world’s agriculture depends on a diverse mix of crop varieties, agricultural techniques, farming systems, and traditional and local knowledge. All these attributes can be found in SEPLS, where humans are described as a “keystone species,” as they are central to the health of the agroecosystems they have created, and many other species could not survive without their continuous intervention. Bioversity International works with partners on the ground, and through different research projects has tested and used the indicators of resilience in 11 different countries across different agroecosystems, from the highland potato and quinoa plots of Bolivia to the tropical agroforestry systems of Cuba and the rice paddies of China and the Philippines.
The experience with the resilience indicators described here is from Sierra del Rosario Biosphere Reserve in the western part of Cuba. The landscape is home to high levels of agricultural and wild biodiversity and comprises a mosaic of secondary forest patches, home gardens, coffee agroforestry systems, and traditional conucos—large gardens or small fields where agriculture is practiced in a traditional way. Cultivated plants in conucos came from nearly all regions of the world. Crops from the Central American and Mexican region are most important. The great diversity of different crops as well as the marked variation within most of the cultivated plants demonstrates the importance of the conuco as a reservoir for plant genetic resources. Sierra del Rosario is recognized for its rich crop genetic resources of coffee (Coffea arabica), maize (Zea mays), lima bean (Phaseolus lunatus), common bean (Phaseolus vulgaris), chili (Capsicum species), mango (Mangifera indica), plantains and bananas (Musa species), and tropical fruits like mamey (Pouteria sapota), cherimoya (Annona reticulata) and guanabana (Annona muricata). Most of the varieties found are traditional.
The application of the resilience indicators in Sierra del Rosario, together with agrobiodiversity and socioeconomic data and information deriving from long-term studies in the same area, highlighted that farmers perceived devastating hurricanes, changes in rainfall patterns, and droughts as the main natural threats to their resilience. However, the landscape’s regenerative capacity appears to be relatively high. Thanks in part to interventions based on resilience assessment findings, vegetation patches that were ripped out by two consecutive hurricanes in 2008 showed signs of recovery after only 1 year. Likewise, farmers are adapting to increasingly unpredictable weather and drought by planting more perennial crop species and trees, and by adjusting and changing the timing of agricultural activities. Diversity in land use, crops and crop varieties, as well as smallholder innovation, alternative biodiversity-based livelihoods, and government support are all contributing to resilience to environmental and social changes. The study also highlighted that more work and greater collaboration with the local government, the agricultural cooperatives, and the farmers’ association is envisaged to improve small-scale farmers’ benefits, and recognition of their contribution to the conservation and production of diverse food items with agroecological methods. Farmers would like to receive more training, by the farmers’ association, on new crop varieties and agricultural technologies to improve production, and they see the need for the state agricultural cooperatives to provide better access to specialized markets to add value to biosphere reserve products and agro-ecotourism development.
The assessments carried out by Bioversity International in different countries share some common lessons with the results from Cuba. Community members have come to recognize the usefulness of having, through use of the indicators, a holistic and multidisciplinary approach to their landscapes. Some workshop participants said that they were accustomed to research activities with a narrow focus, and that the resilience assessment was the first time they were involved in such a comprehensive activity. Communities said they felt empowered by expressing their views and aspirations in developing plans for the future of their socio-ecological systems. The sense of ownership, responsibility, and motivation in implementing a plan for their well-being and for their landscape protection was always high among the community members. Communities also felt the need to deepen collaboration among themselves and with extension workers to share and exchange knowledge and experiences. Many of the case studies demonstrated that bringing disparate types of knowledge into conversation can lead to new ways of knowing. In these ways, Bioversity International’s experience shows that the indicators have contributed to the understanding and management of complex systems through the lens of worldviews and values of the local communities managing them.
6.3.4 Using the Indicators for Community Self-Diagnosis, Monitoring, and Evaluation in Japan
The indicators were used in surveys conducted as part of a UNU-IAS project to develop a framework and method of monitoring and evaluation for agricultural biodiversity conservation and use in rural villages in Japan, funded by the Ministry of Agriculture, Forestry and Fisheries of Japan. The purpose of the surveys was to capture factors for monitoring including drivers of change and perceived outcomes of conservation activities, whether included in the indicators or not, relevant to the development of monitoring and evaluation methods in Japan. For this purpose, resilience assessment using the indicators was tested as a self-monitoring process for local people that would lead to the creation and revision of action plans. While the indicators had been used mostly in developing countries to date, these surveys were an opportunity to evaluate whether the indicators were also useful in the context of a developed country.
Two assessment workshops were conducted, in the Hiki community of Suzu City, Ishikawa Prefecture in February 2016, and in the Kiyokawa community of Minabe Town, Wakayama Prefecture in August 2016. Both case study sites were chosen as they are located within the Food and Agriculture Organization of the United Nations (FAO) designated Globally Important Agricultural Heritage Systems (GIAHS) sites of “Noto’s Satoyama and Satoumi” and “Minabe-Tanabe Ume System,” where communities are still utilizing local and traditional knowledge in managing SEPLS for their rural livelihoods today. Agriculture is an important industry for both communities. In the landscapes and seascapes adjacent to Hiki, people are engaged in different kinds of production activities including growing rice and vegetables, charcoal-making, and fisheries; while in the mountainous landscape of Kiyokawa, most are farmers engaged in production of plums (Prunus mume), citrus fruits, vegetables, and charcoal.
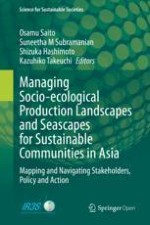
For each community, a pre-survey was first conducted by questionnaire with 100 local residents prior to a half-day workshop with 15–20 selected participants held to discuss the questionnaire findings (see Table 6.1). This was done to shorten the indicator toolkit’s recommended duration of one to two full days for the workshop, as both communities felt that this would be too time-consuming for local residents. For the pre-survey questionnaires, questions for each indicator were customized to fit the local context, so that respondents would understand what they were actually being asked. Factors and indicators relevant to the actual circumstances of Japan were then extracted from the questionnaire results and workshop discussions for development of the monitoring and evaluation method. Figure 6.1 summarizes results from the pre-survey questionnaires.
Dissemination: Hand delivery by (sub)community chiefs
Collection: Hand delivery to (sub)community chiefs and postal delivery
Response rate: 100 sent, 77% response
Date: August 2016
Dissemination: Hand delivery by (sub)community chiefs
Collection: Hand delivery to (sub)community chiefs
Response rate: 100 sent, 97% response
Workshop
Date: February 2016
Participants: 15 local residents (questionnaire respondents)
Date: October 2016
Participants: 19 local residents (questionnaire respondents)
Fig. 6.1
Results from pre-survey questionnaires
×
The results of both surveys show that the indicators are useful in providing a broad overview of biodiversity use and conservation status. They were also found to be useful in self-diagnosis to give an overall picture of strengths and weaknesses of the community. Evaluation of biodiversity related to natural resources and agriculture (indicators 1, 2, 3, and 4) tended to be relatively high in both districts, while their evaluation of infrastructure and livelihood (indicators 16, 18, and 19) was lower. Participants understood the importance of evaluating not only ecological and environmental aspects related to conservation and use of biodiversity, but also socioeconomic impacts and how their lives and livelihoods were affected. The assessment captured a wide variety of problems existing in the region and local residents’ perceptions of them. Periodic self-diagnosis and self-assessment of this type can be an important monitoring process for local residents to understand changes in their environment and impacts of their activities.
It was also found that the assessment process stimulates conservation in local communities. The workshops turned out to be valuable opportunities for people of different ages, genders, occupations, etc. to gather and discuss. Residents based their assessments on their own daily lives and work experiences, and exchanged views on these during the workshop. This kind of bottom-up, self-assessment method was found useful in: promoting conversation among different age groups and genders, where otherwise in daily life they would not speak directly or share their views; increasing awareness among residents and promoting participation in concrete activities; and helping to clarify roles that each person can and does play in community activities. Thus, the indicators and discussion of results from their implementation were found to be an effective initiating process to promote awareness, establish common understanding, and facilitate planning of activities for resource management.
Besides the 20 indicators, factors and indicators relevant to circumstances in Japan were identified from the pre-survey questionnaires and workshop discussions (see Table 6.2). It was found that not only demographic issues in the population (for example, depopulation) and economic aspects related to biodiversity, but also spiritual and cultural connections were regarded as important factors to motivate interest in conservation of nature. In particular, challenges to the resilience of the communities were mainly due to the lack of workforce, under-use and under-management of resources, and weakening affinity with nature.
Table 6.2
Factors and indicators relevant to circumstances in Japan
Factors
Indicators
Usage of resources
Abandoned cultivation areas on privately owned land, forest management, etc.
Depopulation and aging
Population dynamics including population loss, number of migrants, new farmers, etc.
Absentee landowners
Number of joint management groups, damage from wildlife, extermination, etc.
Spiritual affinity with biodiversity
Nature learning (experience, observation, therapy), arts and culture related to nature, etc.
For the purposes of the research to develop a monitoring and evaluation method for agricultural biodiversity conservation and utilization activities in rural villages in Japan, the surveys using the indicators proved to be useful for self-diagnosis of current status, strengths and weaknesses, and to capture other factors and challenges that need to be included for a more comprehensive assessment. In particular, this exercise was useful as a first step for conversation within the community and to inspire them to initiate their own activities. Adjustments made to the assessment process, such as conducting pre-survey questionnaires customized to the local context, captured not only more responses in general but also some from those who were not available to commit to long hours of workshop participation. The results also showed that customization of questions was necessary and that additional indicators specific to Japan could be added. With this adjustment, the indicators can be considered to be useful for other rural communities in Japan as well as for wider contexts and purposes.
6.3.5 Supporting Communities in Decision-Making Related to Restoration of Ecosystem Services in Tanzania
Comparative assessment workshops using the indicators were carried out to evaluate community perceptions of diversity in their landscapes and the resources therein, and how these influence local perceptions of risks and resilience, in two villages, Yamba and Kwang’wenda, in Lushoto District, West Usambara, Tanzania in October 2015. These sites were selected because they were among the benchmark sites of CGIAR’s Research Program on Climate Change, Agriculture and Food Security (CCAFS). A combination of different participatory tools was used, including the indicators, as shown in Table 6.3. In each community, 20–25 participants gathered at a central location in the village for the workshop. Each workshop concluded with an in-depth discussion of main problems, root causes and threats identified during the assessment, areas of higher vulnerability and land degradation, and potential solutions, interventions and development organizations.
Table 6.3
Overview of the assessment workshops
Day
Description
Tool
Estimated time
References
1
Obtain broad overview of the research area. Researchers familiarize with the people, environment, food markets, etc. Identification of focus group participants and recording of personal details such as name, gender, age, village, education, and main occupation.
Identification of plant specimens brought by participants
Participatory landscape and resource mapping. Understanding of natural and physical resources and distribution. Defining the landscape using local terms. Listing diversity of landscape components
Participatory landscape and resource mapping
2–3 h
IFAD (2009), NOAA (2009), van Oudenhoven et al. (2010)
The following priority actions were proposed in the two villages, aimed at improving the communities’ resilience and that of their landscape in the face of socio-ecological and climate changes:
Restore the ecosystem
Discourage encroachment on forests, springs, and wetlands through the enforcement of relevant government regulations and policies
Educate and create awareness on the advantages of diverse foods and landscapes
Document and preserve community knowledge
Build capacity of local leaders to lead and groups to network/cooperate
Support communities to acquire new technologies and innovate
Diversify sources of income
Six broader themes were identified to categorize the indicators for the scoring exercise (see Table 6.4). Among these, one of the most outstanding differences between Yamba and Kwang’wenda villages is in the first theme, “Landscape/ecosystem diversity and health components.” Kwang’wenda village scored 2.7 (average score) in this section against 4.0 (high score) for Yamba village. This was explained by the fact that most forest patches in Kwang’wenda village have been cleared, reducing the tree cover and also the once-numerous springs to only one, causing a general scarcity of water. According to participants, temperatures have risen and rain patterns have been affected, partly attributable to general land degradation and climate change. Crops such as coffee and bananas no longer do well in Kwang’wenda village as it is now too dry and warm for these crops. Yamba village, on the other hand, has suffered much less land degradation. The village has a forest next to it and much of the land still has good tree cover. However, there are reports of forest and spring encroachment by cultivators and illegal timber harvesting, which residents see as a real threat to the ecosystem. The expected future trend follows a similar pattern. Kwang’wenda participants felt that the situation would only improve slightly (average score 2.7) as the state of the ecosystem is bad and the rate of recovery is bound to be slow. In Yamba village, the future looks optimistic (average of 4.2).
Table 6.4
Mean values of current status and trend scores
Theme
Yamba (mean value of current status/trend)
Kwang’wenda (mean value of current status/trend)
1. Landscape/ecosystem diversity and health (Indicator 1–4)
4.0/4.2
2.7/2.7
2. Biodiversity including agricultural biodiversity (Indicator 5–8)
3.6/4.1
3.2/4.0
3. Documentation of biodiversity and related local knowledge (Indicator 9, 10)
2.3/2.2
2.6/2.2
4. Landscape resource governance and cooperation (Indicator 13, 14)
1.7/3.9
1.9/4.0
5. Gender knowledge recognition and social equity (Indicator 11, 12 and 15, 16)
4.1/4.2
4.1/4.6
6. Socioeconomic infrastructure, health, and opportunities for income generation (Indicator 17–20)
4.0/3.9
3.3/3.7
The participatory tools used in this study, including landscape mapping, listing of landscape and agrobiodiversity components and main food sources, seasonal calendars, and use of the indicators, also showed a similar association between landscape and species diversity on the one hand and people’s perceptions of resilience and risks on the other hand, meaning that people’s higher perceptions of landscape and species diversity associate with higher resilience and reduced risks.
Negative perceptions in both score and trend were observed for the themes “Documentation of biodiversity and related local knowledge” (indicators 9 and 10) and “Landscape resource governance and cooperation” (indicators 13 and 14) in both villages. Interventions by institutions, awareness, and institutional collaboration (indicators 13 and 14) were observed to have a great influence on perceived trends and optimism that there will be better resource management in the future. Knowledge documentation, gender, and social equity have the least influence currently and also in the future, as shown by “Documentation of biodiversity and related local knowledge.” Knowledge documentation was considered by the community as inconsequential for their livelihoods and resilience, but some participants pointed out that local knowledge was still being passed from parents to their children by traditional means such as storytelling and physical interactions. Gender issues and social equity were generally ranked high, with the future remaining bright. Most men felt there was equitable sharing and equal rights with respect to resource access and sharing, and that women’s knowledge was respected, but women saw room for improvement.
Differences between Yamba and Kwang’wenda villages in their perceptions of landscape resilience and levels of optimism were clear. Yamba has a greater landscape diversity, higher level of food diversity, and higher perceived resilience and optimism than Kwang’wenda, as it is close to forests, rivers, and springs; and hence more agroecological zones, habitats, and niches that support species diversity. Yamba also has a greater choice of resources, better infrastructure, and more income opportunities. Community members, however, highlighted encroachment on forests and springs, poor leadership, lack of enforcement of environmental protection laws, and lack of locally coordinated collective actions to manage these resources. Kwang’wenda, on the other hand, is located on a hilly landscape with many steep-sided hills. Farming is done on the hilltops, on the slopes, and in the valleys. There is a perception of serious risks related to soil erosion and poor productivity, and a need for conservation agriculture due to generalized deforestation depleting their natural resources. Needs for good leadership, collective action, networking, and institutions working together toward common goals were strongly indicated.
The combination of participatory assessment tools and processes used for this study highlighted people’s perceptions of resilience, its major determinants, and available options for improvement. Establishing an innovative and community-based multi-level coordinating body or committee is a key element for adoption of solutions proposed by participants. The collective information identified through a combination of different participatory tools in Table 6.3 can be used as an extension guide to: facilitate the community to network with different stakeholders to discuss and share knowledge; facilitate training on how to raise funds and write proposals to support their initiatives; facilitate training workshops and seminars for government officials; and mobilize support for improvement of social infrastructure including roads, health facilities, irrigation systems, wells, or boreholes. It can also contribute to building a multi-lateral strategy for restoration of degraded ecosystems, as well as to monitor effectiveness of interventions.
6.4 Discussion
The diversity—in terms of type, approach, purpose, geography, and others—among the examples presented here is an indication of the difficulties involved in assessing resilience, as resilience itself is expressed in widely varying ways by communities in different socio-ecological contexts. There are a multitude of factors—ecological, economic, well-being, or governance-related—and challenges in knowledge transfer and management of resources and ecosystems that can affect resilience positively or negatively in different production landscapes and seascapes. Due to the sector-based approach taken in most project and intervention planning, people have tended to consider these factors separately, although on the ground they are part of a system with complex, interconnected cause–effect relationships. The value of an indicators approach like the one described in this chapter is its ability to simultaneously unravel components of SEPLS into factors that can be realistically assessed, while not losing sight of the fact that they make up an interconnected system. This thereby encourages just and sustainable use and management of resources, better planning of livelihood activities, and cooperative partnership building among various stakeholders.
Nearly 10 years of experience with developing, testing, and implementing the indicators of resilience in SEPLS has produced a great deal of knowledge on this kind of indicators approach. Among the major benefits found in using the indicators in all of these cases is their value in organizing local peoples’ perceptions by helping stakeholders to understand and identify elements of socio-ecological resilience, challenges to resilience, and potential strategies to reach and sustain ecological integrity and human well-being. With this base of improved understanding, the indicators can then serve as a tool for monitoring achievements and progress toward improved resilience, as seen in the experience of the COMDEKS program. At the same time, use of the indicators can help communities identify gaps in their understanding of system complexity and dynamics, and thereby identify opportunities to leverage synergies, as seen in the Cuban case and others.
A unique aspect of this particular indicators approach is that its inclusion of temporal trends and timelines has helped communities’ understanding of historical resource-use and management practices and consumption effects. Likewise, the inclusion of community-based mapping exercises into resilience assessment workshops has identified resource-use patterns and drivers of change that affect the current situation as well as positive or negative effects of potential interventions. The resulting more comprehensive understanding of socio-ecological interactions in the landscape or seascape over time has promoted greater appreciation for and commitment to revitalization of traditional and local knowledge and practices, and consequently empowerment of local communities, for example in the cases from the “GEF-Satoyama Project.” This empowerment extended to groups within the landscape or seascape by incorporating perspectives, knowledge systems, and worldviews of vulnerable and under-served segments of the community, encouraging planning by internal stakeholders with high transformational potential, as in the case from Japan and those from Bioversity International.
Possibly the most prominent benefit found in these experiences using the indicators is their value as a convening tool, bringing together multiple stakeholders in a landscape or seascape. Using the toolkit has helped with stakeholder engagement by bringing together groups that did not previously communicate much in the landscapes and seascapes presented here, allowing them to work together toward building shared understanding and goals between local communities, governments, and other stakeholders to promote participatory management. This includes a more comprehensive understanding of trade-offs between different priorities of different actors and actions, and the types of conflicts that can arise, allowing more informed efforts to overcome undesirable outcomes from governance and management actions, as in the case from Colombia.
Overall, this indicators approach has been found to be a good tool for the purposes above, and others including its value in contributing to scientific research, as seen in the case from Tanzania, and to encourage conservation, as in the Japan case, by helping local people to understand the links between ecosystem services and their own livelihoods. That said, some points for further consideration when using the indicators were identified in these cases. For example, some found that the indicators may be more effective if they are adapted for local contexts by adding or modifying some indicators as appropriate, or combined with other tools as in the Tanzanian case. This is one result of the indicators’ use of a community-based approach, which, as indicated above, allows for and also requires a variety of ecological, socioeconomic, and other factors to be considered in an integrated approach to assess resilience at the community level (Antwi et al. 2014).
Most importantly, users stressed that, due to their subjective nature and widely varying socio-ecological circumstances, these indicators cannot be used for comparison of different landscapes and seascapes, as they rely on community members’ individual perceptions rather than third-party evaluation. This locally specific nature of the assessment process was seen as a strength as well as a disadvantage by users, due to the fact that the factors contributing to resilience themselves have been found to be highly context-specific (Saito et al. 2018) and therefore are difficult to assess using common indicators that may not be relevant to local circumstances. In other words, a locally specific integrated assessment model can help understand resilience better, but only at the expense of generalizability across different communities. While the indicators cannot provide comparison between geographical areas, they can be used to capture changes within a community over time through repeated assessment, particularly if the same group of participants can do the assessments. This can be valuable for adaptive management of the landscape or seascape, as highlighted in Sect. 6.3.1 above.
Work already done with the indicators as described above has indicated some directions for future work. For one, this approach’s potential role in monitoring and evaluation of project results was identified as an area that has not yet been sufficiently explored, and where there seems to be some future potential. Another is further investigation of the use of the indicators in developing- versus developed-country contexts. To date, the assessments included in this chapter from Japan are the only ones that were done in countries classified as developed countries. Finally, users stress that there is further work to do in scaling-up the indicators and assessment activities to capture the implications of local-level resilience for larger governance and ecological scales. If this avenue is pursued, “Indicators of Resilience in Socio-ecological Production Landscapes and Seascapes” could have further potential relevance for national and international conservation and development targets, such as the Aichi Biodiversity Targets of the Convention on Biological Diversity’s Strategic Plan for Biodiversity 2011–2020, and the United Nations’ Sustainable Development Goals.
Open Access This chapter is licensed under the terms of the Creative Commons Attribution 4.0 International License (http://creativecommons.org/licenses/by/4.0/), which permits use, sharing, adaptation, distribution and reproduction in any medium or format, as long as you give appropriate credit to the original author(s) and the source, provide a link to the Creative Commons license and indicate if changes were made.
The images or other third party material in this chapter are included in the chapter's Creative Commons license, unless indicated otherwise in a credit line to the material. If material is not included in the chapter's Creative Commons license and your intended use is not permitted by statutory regulation or exceeds the permitted use, you will need to obtain permission directly from the copyright holder.
The subgrant proponents are: Asociación Amazónicos por la Amazonia (AMPA), Peru; Dahari, Comoros; Environmental Protection and Conservation Organization (EPCO), Mauritius; Fauna and Flora International (FFI), Myanmar; Fundación para la Investigación y Desarrollo Social (FIDES), Ecuador; Green Islands Foundation (GIF), Seychelles; Inter Mountain Peoples’ Education and Culture in Thailand (IMPECT), Thailand; The Energy and Resources Institute (TERI), India; Universidad Industrial de Santander (UIS), Colombia; and Wildlife Conservation Society (WCS), Madagascar.
Lessons Learned from Application of the “Indicators of Resilience in Socio-ecological Production Landscapes and Seascapes (SEPLS)” Under the Satoyama Initiative
Authors
William Dunbar Suneetha M Subramanian Ikuko Matsumoto Yoji Natori Devon Dublin Nadia Bergamini Dunja Mijatovic Alejandro González Álvarez Evonne Yiu Kaoru Ichikawa Yasuyuki Morimoto Michael Halewood Patrick Maundu Diana Salvemini Tamara Tschenscher Gregory Mock