The structural properties of cast aluminum parts are strongly affected by the solidification in the production process. The solidification dynamics determines the Secondary Dendrite Arm Spacing (SDAS), directly affecting the structural strength of the alloy. Simulation techniques enable the integrated design of chassis parts and their production equipment. However, in order to effectively predict the SDAS formation, the simulation models need to be investigated and calibrated. The present research investigates the SDAS formation models and identifies a robust relation to be used in Design by Simulation phases for AlSi7Mg0.3 parts.
1 Introduction
Structural parts for car chassis must achieve high structural strength. For cast aluminum parts, the relation between the mechanical properties and the grains size is reported in literature [1]. The grain size is measured on micrographs as Secondary Dendrite Arm Spacing (SDAS). The SDAS is strongly influenced by the solidification dynamics [2], hence the integrated design and simulation of a casting and its manufacturing equipment is critical. Design by Simulation techniques aid designers [3, 4]. However, the heat transfer and SDAS models are not easy to compute, since they must be carefully calibrated [5].
The present research investigates the SDAS formation models and identifies a robust relation to be used in the integrated design of casting and foundry equipment. The paper is organized as follows. Section 2 presents the method for SDAS analysis with simulation and experiment techniques. A case study is discussed in Sect. 3, while the concluding remarks are drawn in Sect. 4.
Advertisement
2 Secondary Dendrite Arm Spacing Analysis
Four steps enable the complete analysis of a casting, as described hereafter.
2.1 Low Pressure Die Casting Simulation
The casting simulations are modeled in Magmasoft [4]. Four characteristic times are considered for describing the casting solidification. The FStime 60% is the time required for the solidifying alloy to reach a 60% solid fraction. This time is significant since no macroscopic feeding is possible over 60% solid fraction for the model of this alloy. FStime 90% is investigated to search for possible grain modifications in the last 10% solidification phase. The Solidification time is the time from the start of pouring to the time when the temperature locally falls below the Solidus temperature. The Liquidus to Solidus time is the elapsed time in the local transition from the Liquidus and Solidus temperatures [6, 7].
2.2 Spectrochemical Analysis with Optical Emission Spectroscopy
In Optical Emission Spectrometry (OES), a portion of the sample is vaporized through electric discharge and the optical radiation from the excited ions is transferred to the spectrometer optics. The optical beam is here broken down into individual spectral components. Each component is characteristic of an element while its intensity is proportional to its concentration. Finally, the percentage concentration of all the elements in the alloy is displayed.
The OES analysis ensures that the casting samples under investigation complies with the chemical composition in the UNI EN 1076 standard for the AlSi7Mg0.3 alloy. For these safety critical parts, further 0.012%–0.024% strontium is added in order to modify the microstructure.
Advertisement
2.3 SDAS Mapping Through Micrographs
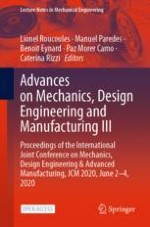
From the image on an optical microscope, the SDAS is evaluated by averaging at least five arm spacings, as SDAS = L/n, n ≥ 5, in Fig. 1. Furthermore, the SDAS is averaged over ten measurements for each different area on the casting.
Fig. 1.
Evaluation of secondary dendrite arm spacing.
×
2.4 Correlation Between Measured and Simulated SDAS
A correlation analysis is performed on Excel, in order to extrapolate a formula correlating the SDAS to the simulated characteristic times. From literature [6], the formula to be parameterized is:
$$ {\text{SDAS}} = k \cdot t_{S}^{n} . $$
(1)
where tS is the solidification time, k and n are constants characteristic for the alloy.
3 Experiments and Simulation Analysis on Case Studies
Three different castings are analyzed on six sampling areas, for a total of 18 measurements. The experiments are averaged over ten quality-compliant samples for each one of the castings, for a total of 180 specimens. The present section reports the evaluations on a wheel hub support, while the final reported results refer to the complete evaluation on all three case studies.
The six sampling areas on the casting for the wheel hub support are shown in Fig. 2. Table 1 reports the four characteristic times for the casting solidification as simulated for the six areas. Since the simulation results depend on the model discretization with a fine mesh, sized smaller than the area investigated in the experiments, each reported value is averaged over five picked measurements close to the sampling area.
Fig. 2.
Sampling areas on the casting for the wheel hub support in a) bottom and b) top views.
Table 1.
Characteristic times as simulated for the six sampling areas.
Area
Motivation
FStime 60% [s]
FStime 90% [s]
Solidification [s]
Liquidus to Solidus [s]
1
High FStime
150.01
174.07
186.75
122.96
2
Thick wall
78.51
85.18
98.69
49.54
3
Thin wall
65.91
76.81
84.38
39.18
4
Short FStime
61.14
73.61
82.40
37.43
5
Zone for hardness specimens
71.61
83.71
92.67
47.03
6
Intermediate Fstime
89.26
103.83
123.33
74.49
×
For each casting sample, a specimen is extracted from each one of the six sampling areas. The specimens are machined as approximately 15 × 15 × 8 mm size. They are incorporated in resin, polished with abrasive paper in order to remove any contamination from the surface and finally shortly etched in Keller’s reagent. With a ARL4460 Metals Analyzer quantometer, three OES measurements are carried out on each specimen in different positions and then averaged. As example, the chemical mass compositions of the three analyzed specimens is reported in Table 2, while Fig. 3 shows the microscope image with SDAS measurements on a single specimen. The results of SDAS analysis for the six areas on the ten samples are reported in Table 3.
Table 2.
Mass percentage composition of AlSi7MG0.3 alloy as prepared in the foundry.
NR
Si
Fe
Cu
Mn
Mg
Zn
Ti
Sr
Others
Al
UNI EN 1076
6.50–7.50
<0.15
<0.03
<0.10
0.25–0.45
<0.07
<0.18
–
<0.10
Balance
Casting1
7.18
0.103
0.002
0.002
0.399
0.001
0.118
0.028
< 0.01
92.3
Casting2
7.16
0.104
0.003
0.003
0.376
0.002
0.110
0.029
<0.01
92.2
Casting3
6.98
0.103
0.002
0.002
0.400
0.001
0.112
0.028
<0.01
92.4
Fig. 3.
Grain structure magnification and SDAS measurements.
Table 3.
SDAS results on the six specimens on the wheel hub support casting.
Nr
mean [µm]
max [µm]
min [µm]
dev [µm]
1
41
47
33
14
2
25
31
19
11
3
23
27
20
7
4
24
29
21
8
5
27
32
20
12
6
28
38
24
14
×
Finally, the interpolation functions of the SDAS depending on FStime 60%, FStime 90%, Solidification time and Liquidus to Solidus time are reported in Fig. 4 over all the six sampling areas on the three analyzed castings.
Fig. 4.
SDAS interpolation functions (solid) depending on simulation results (dots) for a) FStime 60%, b) FStime 90%, c) Solidification time and d) Liquidus to Solidus time.
×
The interpolation with the Solidification time as variable achieves the best correlation coefficient R2, in agreement with literature works. For the AlSi7Mg0.3 alloy with 0.012%–0.024% strontium addition and for the specific casting technology, the most accurate prediction of SDAS from simulations is found to be:
In the present research, (2) is considered with a reliability about ±5 μm.
4 Conclusions
The present research investigates the calibration of a model for the SDAS simulation in LPDC. The SDAS mapping from micrographs is studied against the maps of different characteristic solidification times from simulations. The formula for the SDAS simulation gives reliable results for the three castings, for a total of 30 analysed samples. So, the simulations are capable of investigating this parameter directly linked with the mechanical properties of the alloy. These simulations are a very important tool for designing both the product and the manufacturing equipment. In order to improve the reliability of the SDAS model, further experiments will be executed, investigating also other casting technologies.
Open Access This chapter is licensed under the terms of the Creative Commons Attribution 4.0 International License (http://creativecommons.org/licenses/by/4.0/), which permits use, sharing, adaptation, distribution and reproduction in any medium or format, as long as you give appropriate credit to the original author(s) and the source, provide a link to the Creative Commons license and indicate if changes were made.
The images or other third party material in this chapter are included in the chapter's Creative Commons license, unless indicated otherwise in a credit line to the material. If material is not included in the chapter's Creative Commons license and your intended use is not permitted by statutory regulation or exceeds the permitted use, you will need to obtain permission directly from the copyright holder.