Mergers and acquisitions (M&A) are very large investments in which a company absorbs another company, which can dramatically change the profile of a company’s assets. This chapter discuss various types of M&A and the motives behind them, along with calculation examples. Just as in any other investment decision, the financial sanity of M&A activity can be assessed with the NPV method. However, the numbers tend to be much bigger than in ordinary capex decisions, hence the stakes are bigger as well. This makes behavioural issues even more problematic, as they can result in very large overvaluation, overinvestment, and value destruction. Likewise, if not properly understood and considered, environmental (E) and social (S) issues can have similar effects as the abovementioned behavioural issues and reduce the company’s financial value. While the effects of E and S issues on M&A valuation are increasingly understood, scarce academic attention is given to the valuation of E and S in their own right in M&A deals. An M&A deal can be massively value destructive on E or S, which may justify blocking the deal.
Overview
While Chaps. 6 and 7 discussed corporate investments in general, this chapter focuses on a special type of investment: mergers and acquisitions (M&A). M&A are very large investments in which a company absorbs another company, which can dramatically change the profile of a company’s assets.
M&A deals can be done for several reasons, some are more rational and valid than others. Less valid motives include diversification and deals done for the sake of boosting earnings per share (EPS). Value creation is often more likely if there are synergies between the companies involved. M&A deals tend to come in waves, with clustering in industries and driven partly by market valuations.
Advertisement
Just as in any other investment decision, the financial sanity of M&A activity can be assessed with the NPV method. However, the numbers tend to be much bigger than in ordinary capex decisions, hence the stakes are bigger as well. This makes behavioural issues even more problematic, as they can result in very large overvaluation, overinvestment, and value destruction. And indeed, massive value destruction in a small number of very large M&A deals is well documented.
E and S issues can also affect the risk and valuation of M&A deals. If not properly understood and considered, E and S issues can have similar effects as the abovementioned behavioural issues and reduce the company’s financial value. A notorious example is Bayer’s acquisition of Monsanto, which resulted in over $10 billion in litigation costs on health issues due to Monsanto’s glyphosate product Roundup. Ideally, such skeletons in the closet are uncovered in the due diligence of the target company ahead of the M&A transaction, which should focus not only on F issues but also on S and E issues.
While the effects of E and S issues on M&A valuation are increasingly understood, scarce academic attention is given to the valuation of E and S in their own right in M&A deals. An M&A deal can be massively value destructive on E or S, which might justify blocking the deal. For example, the source of a takeover’s financial success can lie in business practices that involve increased pollution, negative health effects, and exploitation of workers and consumers.
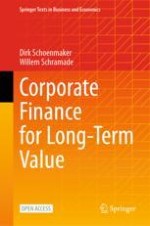
An integrated perspective on M&A valuation is therefore needed. In particular for large M&A deals, an integrated value test should be required. This implies that a takeover or merger would only go ahead if and when the integrated value of the combined companies is higher than the integrated value of the stand-alone companies. The aborted takeover attempt of Unilever by Kraft Heinz would not have passed the integrated value test. While the merged combination might have improved short-term financial value (passing the financial test), the integrated value would have declined as Kraft Heinz planned to reduce the sustainability (E and S) efforts of Unilever (failing the integrated value test). See Fig. 18.1 for a chapter overview.
An illustration of chapter overview. The first and second chapters have sustainability unaware. The third chapter has E S G integrated or inward view. The fourth chapter has impact or outward view. The fifth chapter has integrated value.
Fig. 18.1
Chapter overview
×
Advertisement
Learning Objectives
After you have studied this chapter, you should be able to:
analyse the typical motives for M&A transactions—and to what extent they make sense,
do a simplified calculation of M&A value in terms of F, S, and E,
judge an M&A deal on its merits in a wide sense, i.e. considering its value creation on F, S, and E,
analyse the interactions between F, S, and E in M&A, as well as behavioural influences.
18.1 M&A Basics, Motives, and Trends
In this chapter, we use the term M&A (mergers and acquisitions) as a general term for all kinds of deals in which companies or parts of companies are bought and sold. In a takeover or acquisition, one company buys another company and it is typically quite clear who is the buyer and who is the seller. But in a merger, it is supposed that companies of roughly equal size together decide to continue as one company, without a clear buyer or seller. But note that sometimes a deal may be called a merger for political reasons, whereas it is quite clear who is the senior party and who is the junior; and/or who is the buyer and who is the seller. The buyer is called the bidder during the bidding process and called the acquirer if the deal happens. The company that is sold is called the target during bidding and becomes the acquired company once the deal is done.
Companies are not bought and sold overnight. Rather, a bidding process takes months and is preceded by screening activities aimed at identifying the most suitable targets and doing initial valuations. During the bidding process, a due diligence is carried out in which the bidder (or its deal consultant) scrutinises the target’s accounts under strict non-disclosure agreements. Bids can be friendly, i.e. with the consent of the target’s management, or hostile, where such consent is lacking. In the latter case, a bid becomes more difficult, but it can still succeed. If all tests are passed, the actual bid is made, and the target company’s shareholders decide on the outcome. But even with their approval, the deal can still be stopped by regulators if it is deemed to be anti-competitive or contrary to national interests. For example, in August 2020 the UK government blocked the takeover of electronic design company Pulsic by a Hong Kong rival over national security concerns.1 Companies themselves can also apply takeover defences, such as poison pills, differential voting rights, multiple layers of shareholdings, or golden parachutes. This chapter will not dive further into the topics of M&A regulation and M&A tactics.
The seller can be the acquired company itself (i.e. its shareholders), but it can also be a parent company that sells a business unit. In that case, the business unit being sold is called a divestiture. In the case of a spin-off, the business unit is not sold to another company, but set up as an independent company. Typically, the parent company gives up control over the business unit by distributing the business unit’s shares to the parent’s shareholders. But in some cases, a parent company partly sells a subsidiary, but retains control of it. This is called an equity carve-out, split-off IPO, or partial spin-off. Box 18.1 provides an example of an equity carve-out.
Box 18.1 Equity Carve-Out Example: The IPO of Porsche AG
A recent example of an equity carve-out is Porsche AG, the luxury car maker, which did an IPO in September 2022. With a valuation of €75 billion it was the largest European IPO in two decades. However, its frame as an IPO leaves out part of the picture, namely that Porsche AG is floated by and remains under control of parent company Volkswagen AG and by Porsche SE, the holding company of the Piëch and Porsche families. In the IPO, only preferred Porsche AG shares, carrying no voting rights, were sold. The point of this partial IPO is to make the value of Porsche AG more visible within Volkswagen AG, which is not that much more valuable, at just over €80 billion. An investor was quoted saying: ‘Porsche was and is the pearl in the Volkswagen Group. The IPO has now made it very, very transparent what value the market brings to Porsche’.2
18.1.1 Market Reactions to M&A
The market’s assessment of a potential M&A transaction is expressed in the stock price reactions of the target and the bidder (provided that they are both listed), which reflects a mix of (1) the value creation for shareholders and (2) the likelihood that the transaction will happen. Hence, the stock price reaction is seen as the criterion for success and researchers have studied stock price reactions to proposed M&A transaction to learn about M&A. There is also evidence (Kau et al., 2008) that managers to some extent listen to the market in M&A. For example, they are more likely to cancel takeovers when the market reacts unfavourably to the related announcement and they listen more if more of their shares are held by large blockholders (i.e. owners of a large block of a company’s shares), and when their CEOs have higher pay-performance sensitivities.
18.1.2 Types of M&A by Business Activity
An often-used way to classify M&A is by how the bidder and the target relate to each other in terms of their business activity:
horizontal (same line of business),
vertical (different parts of the same value chain),
conglomerate (unrelated business).
Let us take the perspective of a pharmaceutical company as the acquirer. If it acquires another pharma company with a similar product portfolio, i.e. a direct competitor, this is a horizontal takeover. If it acquires a supplier, such as an ingredients company, or a client, such as a managed care organisation, this constitutes a vertical takeover. Finally, if it acquires an unrelated business, such as an advertising agency or a bank, this is a conglomerate takeover. However, the distinctions are not always that neat. What if the company takes over a pharmaceutical company that is not a direct competitor, or only a competitor in certain markets, then what is the boundary between a horizontal and a conglomerate takeover? The right criterion is then probably the amount of synergies (see below): high in case of a horizontal takeover, and insignificant in case of a conglomerate takeover.
Empirical research results suggest that the success or failure of M&A depends very much on the circumstances. For example, Mulherin and Boone (2000) find that announcement effects of both acquisitions and divestitures in the 1990s are positive on average, i.e. they tend to increase shareholder wealth. Moreover, the wealth effects for both acquisitions and divestitures are directly related to the relative size of the event. ‘The symmetric, positive wealth effects for acquisitions and divestitures are consistent with a synergistic explanation for both forms of restructuring and are inconsistent with non-synergistic models based on entrenchment, empire building and hubris’.
18.1.3 Motives
M&A deals can be done for several reasons, some of which are deemed more valid than others. The search for synergies is typically deemed a valid reason, whereas cheap funding and increased EPS (earnings per share) are seen as poor reasons. Protection of the existing business model by diversification is another invalid reason, as the investor can achieve this by themselves through a portfolio strategy. In addition, irrational managers can rationalise poor M&A decisions.
Synergies mean that the cooperation of two organisations provides better results (higher sales, lower costs, lower risk) than the mere sum of their parts. There are several potential sources of synergies:
economies of scale: as production volumes go up, unit costs tend to fall due to learning effects and the recovery of fixed costs;
economies of scope: combining similar products tends to give positive spill-over effects;
vertical integration: acquiring other parts of the value chain (i.e., upstream from suppliers or downstream from clients) can allow for streamlining of production and lower costs or higher sales;
industry consolidation: by reducing competition, a larger part of the consumer surplus is taken. But of course, this is to the detriment of consumers and society at large (see Philippon, 2019); and,
transition: acquiring companies with advanced sustainability (E and/or S) capabilities can accelerate the transition (see Sects. 18.3, 18.4, 18.5).
An example of economies of scope is the $63 billion takeover of the agri-chemical company Monsanto by the chemical company Bayer in 2018. However, this deal ended up with large losses instead of the projected synergies (see Box 18.3). An example of industry consolidation is the $68.7 billion takeover of Activision Blizzard, a video game company, by Microsoft in 2022. Finally, the DSM–Firmenich merger in 2022 provides an example of transition (see Box 18.4).
M&A deals involve estimating synergies before actually executing them. So, their potential is not always achieved. Moreover, they can be achieved at the cost of others. This applies in particular to industry consolidation, which may result in higher prices because of reduced competition. We will return to this in Sect. 18.4.
M&A deals can also be done for poor reasons, such as diversification; increasing earnings per share (see the case of Kraft Heinz-Unilever in the Appendix); or lowering financing costs. In research on serial acquirers, Renneboog and Vansteenkiste (2019) find that related or focused acquisitions outperform unrelated or diversifying acquisitions.
In addition, such poor reasons for M&A deals can also be behaviourally driven (see Sect. 18.2). Examples are:
escalation of commitment: if there is already much time and efforts invested, it often becomes mentally hard to stop a process;
when operating in the domain of losses: Shefrin (2018) provides the example of Hewlett-Packard in 2001. The company had missed its Q4 2001 earnings target; had provided guidance for lower future earnings; and had unsuccessfully sought to buy accounting firm PwC. As a result, Hewlett-Packard’s management was psychologically operating in the domain of losses. This likely contributed to its overvaluation of takeover target Compaq.
overoptimistic managers: overconfident CEOs overestimate their ability to generate returns. As a result, they overpay for target companies and undertake value-destroying mergers (Malmendier and Tate, 2008). Overconfident and overoptimistic CEOs are also 65% more likely to complete an acquisition; and,
serial acquisition: some companies are serial acquirers and acquire multiple companies per year. Renneboog and Vansteenkiste (2019) find that serial acquisition performance declines deal by deal, mainly driven by CEO overconfidence (related to the previous reason).
18.1.4 M&A Advisory
During an M&A process, both the bidder (acquirer) and the seller (target) hire advisory partners, also known as buy-side and sell-side mandates. Typically, an investment bank acts as the primary contact person for the sellers and bidders throughout the entire process, whereby each selling or bidding company hires its own investment bank advisor. When the seller is the initiator, the seller’s investment bank supports the company in preparing the to-be-sold equity, before pitching to prospective bidders. Similarly, when the bidder is the initiator, the bidder’s investment bank supports the company in selecting potential targets. Additionally, investment banks support with valuations and negotiations.
Various specialists are hired to conduct a due diligence of the target. Financial experts normalise and evaluate the target’s earnings and financial statements (see Chap. 17). Operational specialists evaluate the different value drivers of the target, e.g. an industry specialist analyses its production network. Finally, lawyers review critical company contracts and prepare the non-disclosure agreements and the purchase agreement.
18.1.5 M&A Waves
M&A activity comes in waves, as illustrated by Fig. 18.2. These M&A waves are linked to the state of the economy. During an upswing of the economy, M&A activity increases followed by a sharp decline when the downturn sets in. Figure 18.2 shows this around the internet bubble (bursting in the early 2000s) and the Global Financial Crisis (starting with the fall of Lehmann Brothers in 2008).
A line graph estimates the number of M and A deals in thousands and deal value in billion dollars. The number of M and A deals and deal value plot fluctuating increasing curves from (1980, 0) to (2020, 70), and (2020, 6,000), respectively. Values are approximated.
Fig. 18.2
Global M&A activity between 1980 and 2021. Source: Data obtained from Refinitiv Eikon Deal Screener
×
Mulherin and Boone (2000) find significant industry clustering in both acquisitions and divestitures related to synergies (economic motives) and hubris (personal motives). An example is the acquisition of internet companies during the internet bubble in the late 1990s. Cross-border M&A also cluster by industry and time (Xu, 2017). Late deals exhibit better performance than early deals within a merger wave, which suggests learning.
Intuitively, this response to market conditions makes sense. During a recession, management attention is diverted to more urgent matters, such as sustaining the business model. Funding acquisitions becomes more expensive, as interest costs typically rise to reflect the market risk, while equity issues are costly for existing shareholders. As the company’s market capitalisation tends to fall during a recession, an equity issuance causes greater dilution of existing shareholder’s ownership. Lastly, valuations (of the targets also) tend to fall, because the discount rates used to compute the present value of a company’s equity increase with market risk (see Chap. 9).
18.2 M&A Valuation
In Sect. 18.1, we identified synergies as the main criterion for M&A success. But in finance terms the criterion is the same as in any investment decision: what is the NPV? Of course, the two criteria are linked: the larger the synergies, the bigger the NPV tends to be. But there are other drivers as well, such as the price demanded by the seller, who might be aware of the size of the synergies. Koller et al. (2020) define the value creation as follows:
Figure 18.3 summarises the components of the acquirer’s value creation.
A tree diagram of value creation for the acquirer is equal to the value received minus the price paid. The value received involves the standalone value of the target plus the value of performance improvements. The price paid involves the market value of the target plus the acquisition premium.
Fig. 18.3
Value creation for the acquirer
×
The stand-alone value of the target is management’s assessment, which does not need to equal the market value (and may be either higher or lower). The value of performance improvements relates to the measures that the acquirer intends to take, for example cost cutting or using new market channels. These are often referred to as synergies.
The acquisition premium is the price paid by the acquirer on top of the market value of the target. This premium is driven by expectations (the size of the expected synergies; ‘normal’ acquisition premia) and behaviour (hubris of the bidder or overvaluation by the management of the target, or by its core shareholders).
We can of course express the terms from Fig. 18.3 in numbers. The following information is given: the market value of the target is $585 million, which is a 10% undervaluation of its intrinsic value at $650 million; synergies are estimated at 15% of intrinsic value, which is $97.5 million (= 15% * $650 million). There are two scenarios for the sellers’ demanded acquisition premium on the target’s market value: 20% and 30%. Then what is the value creation for the acquirer in both scenarios? Table 18.1 gives the calculations.
Table 18.1
M&A valuation example
Value component
Value, $ millions at a 20% takeover premium
Value, $ millions at a 30% takeover premium
Stand-alone intrinsic value of the target
650
650
+ Value of performance improvements
97.5
97.5
= Value received (1)
747.5
747.5
Market value of the target
585
585
+ Acquisition premium
117
175.5
= Price paid (2)
702
760.5
Value created for acquirer (1)–(2)
45.5
−13
In both scenarios, the intrinsic value (i.e. the fundamental value based on a serious DCF analysis) is $650 million +15% of $650 million = $747.5 million. The difference is in the price paid, driven by the acquisition premium of $117 million (20% of $585 million) versus $175.5 million (30% of $585 million). Table 18.1 shows the value created for the acquirer. In the case of a 20% takeover premium, the value created for the acquirer is $45.5 million (= $747.5 million–$702 million). In the case of a 30% takeover premium, the value created is –$13 million (= $747.5 million–$760.5 million).
This example still leaves open where these valuations come from, or how the acquisition is financed (cash or stock financed). M&A valuations may, just like regular company valuations, be based on multiples or the discounted cash flow (DCF) model (see Chap. 9). Multiples valuation is a relative valuation, whereby a stock value (or more generally, an asset’s value) is derived from the given (market) value of another comparable stock. The DCF model is an absolute valuation method, whereby the free cash flows available to investors (equity and debt holders) are discounted. The valuation can be split into value drivers: sales growth, EBIT margin, and cost of capital.
The tough part about M&A valuation is making assumptions about the value drivers. Management’s assumptions are not known to the outside world. That makes it hard to assess how rational management’s assumptions are. For example, in its 2014 takeover of WhatsApp, Facebook (now Meta) paid $19 billion for a company with just $20 million in annual revenue. As a Forbes article3 put it: ‘That’s not enough to justify a $19 billion price tag, so Facebook is almost certainly looking at other ways the messaging service could make money’. In sum, it is very hard to tell in particular cases if companies make the correct assessment. However, there is strong evidence that they often do not make a rational assessment. Example 18.1 asks you to calculate the value creation in a M&A deal in the car industry.
Example 18.1 Value Creation in M&A
Problem
Assume a hypothetical acquisition in the car industry, where German car manufacturer Volkswagen decides to acquire the smaller, Swedish car manufacturer Volvo. As of the closing date, Volvo’s equity was trading at a market cap of €37.6 bn. By integrating Volvo into its wider company, synergies of €4.5 bn are projected, while Volkswagen assumes Volvo to be worth 10% more than its current trading value.
Assume that Volkswagen is willing to pay a €2 bn premium, how much value is created?
What would be the highest acquisition premium at which Volkswagen still creates value?
Solution
Firstly, we compute the stand-alone value, from the acquirer’s point of view:
Just to check—the maximum acquisition premium of €8.3 bn is composed of the 10% higher valuation by VW of Volvo of €3.8 bn (=€41.4 bn – €37.6 bn) and the projected synergies of €4.5 bn. So, Volkswagen has scope to increase the initial acquisition premium of €2 bn during the bidding. In practice, instead of making a public offer, VW would probably approach Volvo’s controlling shareholder to make a deal.
18.2.1 Financing M&A Deals
The acquirer needs to finance the M&A deal. The acquiring company can pay the price for the target company in cash, in stock or with a combination of both. Taken from Eq. (18.1), the price paid is as follows:
The cash financed M&A deal is straightforward. The acquirer offers the original share price plus the acquisition premium in cash to the target’s shareholders. Assuming that our target company in Table 18.1 has 100 million shares outstanding and offers a 20% takeover premium, the acquirer’s cash offer is $7.02 per share, adding up to $702 million (=$7.02 * 100 million shares). This cash offer is a combination of the original share price (before the takeover announcement) of $5.85 and an acquisition premium of $1.17 (20% of the original share price).
Many mergers and acquisitions are paid wholly or partly in the acquirer’s stock. Let’s assume that the acquirer also has 100 million shares outstanding at $10 per share. To pay the takeover in stock, the acquirer has to offer 70.2 million shares (=$702 million/ $10). The target stockholders receive a fraction x of the combined companies:
$$ x=\frac{new\ shares}{new+ old\ shares} $$
(18.3)
In our example, the target stockholders receive a fraction of \( 0.4125=\frac{70.2}{70.2+100} \) of the combined companies.
Is the stock offer equivalent to the cash offer? Assuming that the acquirer’s stock is priced at its intrinsic value (i.e. no over- or undervaluation), the value of the combined companies is $1747.5 million, which is the sum of the acquirer’s intrinsic value ($1000 million), the target’s intrinsic value ($650 million), and the performance improvements ($97.5 million). The target stockholders receive $720.8 million (=0.4125 * $1747.5 million). The value of the stock offer is $18.8 million more than the cash offer of $702 million. Why is that? The explanation is that in stock payments, what you see is not what you get.
In a stock offer, the effective price of the merger or takeover is affected by the M&A gains or losses. Whereas target stockholders get a fixed price (i.e. cash) in a cash offer, they share in the post-merger gains or losses if stock is offered. Let’s do the calculation. The merger gain is $45.5 million in our example in Table 18.1. The target stockholders obtain 0.4125 * $45.5 million = $18.8 million of the merger gain. This is exactly the difference between the stock offer and cash offer, as calculated above. Example 18.2 shows the calculation of a cash and stock-financed M&A deal. This is quite a demanding exercise requiring several steps in the calculation.
Payment in stock mitigates the undervaluation and overvaluation of both companies (see below on behavioural issues). In the case of overvaluation of the target (e.g. because of a hidden liability), the target and acquirer stockholders share in the losses. Similarly, in the case of undervaluation, the target and acquirer stockholders share in the gains.
Example 18.2 Cash and Stock-Financed M&A
Problem
An aerospace company takes over an aircraft engine manufacturer in a vertical takeover. The aerospace company makes a combined offer in cash and stock. Assume the target currently has 300 million shares outstanding, which are trading at €26.3 per share. Additionally, an acquisition premium of 12.5% is to be paid. The acquirer currently has €1.2 billion in liquid, freely available funds, which it intends to use for the acquisition.
1.
How many new shares does the aerospace company need to issue if its own equity is trading at €75 per share?
2.
If the acquirer has 500 million shares outstanding and expects €2.5 billion in synergies, how much does the combined cash and stock offer exceed a pure cash offer?
Solution
For question (1), we first compute the price paid by the acquirer, using Eq. (18.2).
The next step is to calculate the value per share of the combined company. That is the combined company value, which is the stand-alone market value of both companies plus the expected synergies, divided by the new number of shares.
As you can see, the combined offer of €9.35 bn exceeds the pure cash offer, which is worth €8.9bn. The excess amount of €0.45 bn can be explained by the participation in the predicted synergies. We can check this extra amount for the aircraft engine maker’s shareholders:
As discussed previously, behavioural issues can be internal (errors by management) or external (errors by the market). In internal errors, managers overvalue their own company, the target, or the synergies. Companies can make several such behavioural mistakes when doing M&A. For example, before they make their bid, they can overestimate the aforementioned synergies or underestimate the risks involved, such as the cultural risks of integrating two organisations with different habits. In a bidding context, management can succumb to the winner’s curse: winning an auction or bidding contest by overpaying. This can be aggravated by hubris, a special case of winner’s curse, caused by overconfidence (Roll, 1986).
In external errors, the market overvalues the target or the bidder (who might be paying in its own shares). Such misvaluation can dramatically change M&A incentives. This is very nicely shown in the Shleifer and Vishny (2003) model, which assumes that: (1) acquirers are overvalued; and (2) the motive for acquisitions is to preserve some of the temporary overvaluation for long-run shareholders—that is, the goal is not primarily to realise synergies.
The empirical predictions of the model are as follows:
Managers’ perceptions of mispricing drive acquisition probabilities;
Method of payment matters: predicts that cash acquirers earn positive long-run returns versus negative for stock acquirers since the latter are likely to be overvalued. There are varying pecking orders:
for the acquirers who regard themself undervalued: preference for paying cash;
for the acquirers who regard themself overvalued: preference for paying in stock;
Market-level mispricing proxies and merger volume are positively correlated, i.e. higher M&A volumes in overvalued markets. This is confirmed by Dong et al. (2006).
The Shleifer and Vishny (2003) model is the external errors’ mirror image of Roll’s (1986) hubris theory of M&A, which is based on internal errors. It is consistent with the findings by Moeller et al. (2005) that large M&A losses are concentrated in a small number of very large deals. Box 18.2 provides the example of the $182 billion Time Warner takeover by AOL.
Of course, one could ask why not do an outright equity issue to realise the overvaluation? First, a stock-financed takeover more effectively hides the underlying market timing motive from investors. Second, inertia (i.e. tendency to do nothing) plays a role: equity issues require investor action whether to buy the new stocks or not, while M&A doesn’t require specific action. Of course, investors do need to approve the takeover if the acquiring company issues a large amount of new stock in the deal. The US stock exchanges, such as NYSE and NASDAQ, require, for example, shareholder approval when a company issues more than 20% of its stock in a M&A deal.
Box 18.2 AOL’s Takeover of Time Warner
In 2000, America Online (AOL) paid $165 billion in AOL stock and acquired $17 billion of Time Warner debt in one of the biggest M&A deals in history. The aim was to create a digital media powerhouse. The market capitalisation before the announcement was $185 billion for AOL and $84 billion for Time Warner. This looked like an almost 100% takeover premium (paying $165 billion in AOL stock for $84 billion of Time Warner stock), but AOL stock was vastly overvalued at the peak of the dot-com bubble in 2000. There were indications for AOL’s overvaluation at the time:
AOL had zero residual income;
Internal memos indicate that AOL’s CEO Steve Case thought that dot-com stocks, including AOL, were overpriced and that he sought to exploit this overpricing; and
Time Warner’s investor relations admitted that AOL was ‘basically an elaborate spin machine’.
Time Warner did not recognise AOL’s overvaluation, as Time Warner’s CEO Gerald Levin trusted market prices. In the year after the deal, AOL Time Warner experienced a $99 billion write down. The combined market capitalisation fell from its peak of almost $250 billion in 2000 to less than $50 billion in 2002. This dramatic loss in value of 80% stemmed partly from false expectations about forecasted earnings growth of 30%.
It can also be the other way around, namely that the bidder is undervalued or perceives itself to be undervalued. This effectively discourages the bidder to make the offer in stock. Say the price of the target is $13 billion, and the bidder perceives itself to be undervalued by 20%, then it feels it is paying 25% more: $16.25 billion (= $13 billion/[1–0.2]).
18.2.3 Hedge Fund Activism
There are market participants who specialise in hostile M&A activity. These are activist hedge funds, which have a highly concentrated portfolio of holdings in companies that they want to shake up. Their stakes are not necessarily large as a percentage of a target company’s overall capital. For example, The Children’s Investment (TCI) succeeded in breaking up ABN AMRO bank in three pieces sold to Royal Bank of Scotland, Fortis, and Santander with just 1% of the shares, by writing an aggressive letter and amassing a coalition of partners in 2007.
There is academic evidence that an activist approach can work. Boyson et al. (2017) find that shareholder value creation from hedge fund activism occurs primarily by influencing takeover outcomes for targeted firms. Even failed bids lead to improvements in operating performance, financial policy, and positive long-term abnormal returns at targets of activism, which suggests that activism enhances value. Brav et al. (2018) find that companies targeted by activists improve their innovation efficiency over the five-year period following hedge fund intervention. Despite a tightening in research and development (R&D) expenditures, target firms increase innovation output, as measured by both patent counts and citations, with stronger effects among firms with more diversified innovation portfolios.
18.3 E and S Affecting M&A Valuation
Thus far, we have left E and S out of the equation, but they can have very material effects on M&A deals and their valuation.
18.3.1 E and S Effects on M&A Before Valuation
Managers can see E and S issues as drivers of risks and opportunities in their product markets (see Chap. 2). In terms of risks, they can perceive certain assets as being too risky operationally or bringing reputation risks, which can result in management teams shying away from specific M&A deals in the first place. Opportunities can also drive strategic preferences in M&A deals, such as the desire to acquire sustainability skills or to buy renewable energy assets. Take energy companies Ørsted and Neste for example, who transformed their product portfolios by selling fossil fuel assets and buying renewables assets.
This also means that companies can become targets because of their sustainability skills. Gomes (2019) finds that companies with higher CSR scores are more likely to be acquisition targets. And sustainability skills are also associated with buyer success: Deng et al. (2013) find that mergers by high CSR acquirers take less time to complete and are less likely to fail than mergers by low CSR acquirers. This fits with the observations of Polman and Winston (2021) who argue that a sustainability-driven culture drives M&A preferences of takeover targets: Unilever acquired many mission-driven and founder-led firms that only wanted to be taken over by Unilever, not by its peers, because of its values.
Moreover, Arouri et al. (2019) find that during 2004–2016, arbitrage spreads (a measure of deal uncertainty) are negatively associated with acquirers’ CSR. So, a stronger CSR profile of the bidder means higher probability of closing the deal. Weaker players try to avoid this by seeking environments with lower societal pressure: Bose et al. (2021) find that high carbon emitting acquirers are more likely to buy firms in countries with low GDP; and they also tend to buy firms in countries with weak environmental or governance standards.
18.3.2 E and S Effects on M&A Valuation
As we saw in the previous chapters, E and S can affect the value drivers and hence the attractiveness of M&A deals. For example, as low-carbon energy assets benefit from upcoming regulation and likely higher future carbon prices, they tend to have better expected cash flows and lower risk than otherwise identical energy assets with higher carbon intensities. This is likely to drive up the bid prices of utilities companies with low-carbon intensities versus those with high carbon intensities. Gomes and Marsat (2018) study the impact of CSR performance on acquisition premiums. Although CSR performance is an imperfect measure of E and S value, they do find a positive link between targets’ overall CSR performance and acquisition premiums and a positive link between targets’ environmental performance and acquisition premiums. Their findings are less pronounced for targets’ social performance, which turn out to only impact acquisition premiums in cross-border deals. In addition, Deng et al. (2013) find that compared with low CSR acquirers, high CSR acquirers realise higher merger announcement returns.
18.3.3 E and S Effects on Post-Deal Performance
E and S can also have impact on post-deal performance. Deng et al. (2013) find that compared with low CSR acquirers, high CSR acquirers realise larger increases in post-merger long-term operating performance. They also realise positive long-term stock returns, suggesting that the market does not fully value the benefits of CSR immediately as part of the positive stock returns are obtained only in the long run.
The underestimation of E and S effects can be extremely costly. A major example is the takeover of Monsanto by Bayer (see Box 18.3). Health issues related to one of Monsanto’s key products, Roundup, led to numerous lawsuits culminating in a multi-billion settlement. That shows the importance of not only checking the financial accounts in the due diligence during the bidding process (see Sect. 18.1), but also examining relevant E and S issues.
Box 18.3 Health Issues Destroy Value in Bayer’s Takeover of Monsanto
Bayer, the German pharma and biotechnology company, announced the takeover of the agri-chemical company Monsanto in 2016 with the intention to become a global leader in life science. The final cash offer amounted to $63 billion. After settling antitrust concerns, the deal was completed in 2018. Soon after finishing the deal, the first lawsuits on Monsanto’s Roundup weed killer started, internalising the negative health issues.4
Roundup was popular with farmers, as it increased crop yield by killing weed. Glyphosate is a chemical ingredient of Roundup. A 2015 report from the World Health Organisation’s International Agency for Research on Cancer showed that there was ‘sufficient evidence’ that glyphosate causes cancer in animals as well as damaging effects on human cells. As of September 2022, Monsanto has settled over 100,000 Roundup lawsuits worth over $10 billion. Over 30,000 lawsuits are still pending.5 Bayer cut its dividend to zero in 2021 after litigation on health issues hit 2020 cash flows and profits (see Chap. 16). In 2022, Bayer resumed dividend payouts.
The market capitalisation of Bayer was $83 billion and that of Monsanto was $45 billion at the time of the announcement. The acquisition premium amounted to $18 billion (=$63 billion − $45 billion) or 40% of Monsanto’s pre-announcement market value. Bayer expected annual cost and sales synergies of $1.5 billion. In its bid announcement, Bayer did not give an estimate of potential health liabilities, suggesting that they were not considered.
Bayer financed the deal with new equity of $7 billion, combined with asset sales, cash drawdown, and new debt. At the time of writing (December 2022), Bayer’s market capitalisation was $55 billion, well below its original market cap of $90 billion (= $83 billion + $7 billion). The Bayer-Monsanto deal is an example of very negative S impact on M&A value, although the drop in market capitalisation cannot be fully attributed to the lawsuit ($10 billion).
Going forward, pesticides, such as Roundup, are increasingly banned by governments in the transition to healthy food and regenerative agriculture (see Chap. 2).
18.3.4 E and S Driven M&A Activism
The past years have seen the emergence of sustainability-driven activism by hedge funds.6 For example, Jana Partners partnered with CalSTRS in 2018 to pressure Apple’s board to address the potential negative effects of iPhone use on children. Trian Partners has pushed companies including GE, DuPont, and Danone to promote workplace diversity, adopt supplier codes of conduct, and reduce emissions and waste. Some hedge funds went further and put companies under pressure to do E and S driven M&A deals. For example, Bluebell asked Glencore to separate its coal mines.7 And Third Point called for a breakup of Shell.8
This is a positive development, and possibly the start of a break with the past. Looking at the past, DesJardine and Durand (2020) found that hedge fund activism between 2000 and 2016 yielded benefits that were shareholder-centric and short-lived, with immediate increases in market value and profitability, coming at a mid- to long-term cost to other stakeholders, captured by decreases in operating cash flow, investment spending, and social performance.
18.4 E and S Valuation of M&A
The previous sections discussed M&A from the perspective of financial capital. But E and S in M&A can be valued in their own right. That is important, since the potential for S and E value destruction in M&A is massive, but hitherto typically remains invisible. There is, of course, also potential for S and E value creation through M&A.
Grullon et al. (2019) find that since the late 1990s, over 75% of US industries have experienced an increase in concentration levels. Moreover, firms in industries with the largest increases in product market concentration show higher profit margins and more profitable M&A deals. At the same time, they find no evidence for a significant increase in operational efficiency. Taken together, their results suggest that market power is becoming an important source of value, reducing consumer surplus (see also Philippon, 2019). It has not been documented to what extent M&A might be motivated by the extraction of financial value at the expense of S and E (facilitated by market power).
Incumbent firms may acquire innovative targets solely to discontinue the target’s innovation projects and pre-empt future competition. Cunningham et al. (2021) call such acquisitions ‘killer acquisitions’. Using pharmaceutical industry data, they show that acquired drug projects are less likely to be developed when they overlap with the acquirer’s existing product portfolio, especially when the acquirer’s market power is large because of weak competition or distant patent expiration. Conservative estimates indicate that 5% to 7% of pharma acquisitions are killer acquisitions.
To determine the E and S valuation effects of M&A, one needs to calculate the pre-deal EV and SV of the target and the bidder; and EV and SV of the resulting combination—and hence its synergies. These can be valued, following the same logic as in Chaps. 5, 6, 9, and 10. Tables 18.2 and 18.3 give the example of a deal in which SV+, SV−, and EV− deteriorate as a result of the deal, likely because the bidder imposes its exploitative business model and lower standards on the target. Please note that the superscript + and − stands for positive and negative values, respectively. The loss of SV and EV in synergies is substantial: −15 on SV and −7 on EV in Tables 18.2 and 18.3. This is also what likely would have happened if Kraft Heinz had succeeded in taking over Unilever. See the appendix to this chapter for the case study on that failed deal, including detailed calculations of SV and EV.
Table 18.2
SV valuation example in M&A
Bidder, pre-deal
Target, pre-deal
Synergies
Total
SV+
14
23
−3
34
SV−
−27
−3
−12
−42
SV
−13
20
−15
−8
Table 18.3
EV valuation example in M&A
Bidder, pre-deal
Target, pre-deal
Synergies
Total
EV+
0
0
0
0
EV−
−52
−18
−7
−77
EV
−52
−18
−7
−77
Of course, it could also be the other way round. The bidder can use the target’s capabilities to improve the E and S profile of the combined company. That is likely to result in positive synergies on SV and EV. The outcome thus depends very much on the bidder’s strategy on sustainability.
18.5 Integrated M&A valuation
Once we know the M&A valuation effects on EV and SV, we can also determine the integrated value (IV) of an M&A deal. Remember that IV = FV + SV + EV, whereby SV and EV can be split in positive and negative values, denoted by the superscript + and -, respectively. Table 18.4 shows the IV of the deal from the example in Tables 18.2 and 18.3. The financial synergies (7) are offset by the negative social (−15) and environmental (−7) synergies, resulting in overall negative synergies (−15).
Table 18.4
IV example in M&A–low E&S quality bidder
Bidder
Target
Synergies
Total
FV
126
38
7
171
SV+
14
23
−3
34
SV−
−27
−3
−12
−42
EV−
−52
−18
−7
−77
IV
61
40
−15
86
This deal is value destructive on EV, SV, and IV. It would fail the integrated takeover test presented in Sect. 18.5.3. This highlights that E and S should also become part of data rooms, due diligence, and reporting. The picture could look quite differently with a high E&S quality bidder, as shown in Table 18.5.
Table 18.5
IV example in M&A–high E&S quality bidder
Bidder
Target
Synergies
Total
FV
108
38
3
149
SV+
79
23
4
106
SV−
−5
−3
1
−7
EV−
−25
−18
7
−36
IV
157
40
15
212
In this case, the financial synergies are lower (3), but the high E&S quality bidder also realises positive social (5) and environmental (7) synergies. The high-quality bidder thus manages to improve the overall value creation profile of the combined company by 15, an objective presented in Chap. 2.
18.5.1 Kraft Heinz–Unilever Case Study
Let’s illustrate our examples with a company case study. In the Appendix, we present the attempted takeover of Unilever by Kraft Heinz in 2017. Kraft Heinz is an example of a low E&S quality bidder, which applied the standard financial analysis of synergies. Kraft Heinz’s strategy was to maximise shareholder value, measured by EPS (earnings per share). Using EPS multiples, Kraft Heinz estimated the financial value of the synergies to be €46 billion. Table 18.6 presents this financial result in the first columns; the numbers are taken from Table 18.8 in the Appendix.
Table 18.6
Synergies for Kraft Heinz–Unilever takeover (in € billions)
Financial analysis based on EPS
IPV analysis based on DCF
Value
Synergies
Value
Synergies
FV
46
FV
−11
SV
−38
EV
−13
FV
46
IPV
−63
By contrast, an IPV analysis of the synergies based on a DCF model showed a very different result. The final columns of Table 18.6 present the financial, social, and environmental value creation; numbers are taken from Table 18.12 in the Appendix. The synergies were estimated at the time to be negative on all three dimensions: financial, social, and environmental value.
So, the estimated synergies depend very much on how the valuation analysis is conducted. There are two main reasons for the differences. First, the IPV analysis includes not just financial value but all three value dimensions. Second, the financial analysis was based on Kraft Heinz’s EPS maximisation strategy: achieving sales growth while cutting costs. Moreover, Kraft Heinz assumed that sales growth could be maintained (i.e. extrapolating these growth numbers to the future) delivering positive financial value, which appeared not to be the case a few years later. In contrast, the IPV analysis was based on Unilever’s long-term financial value drivers, which would decline due to diminished attention for social and environmental factors (because of the cost cutting).
18.5.2 IPV Criterion
Ideally, M&A deals result in an improvement in SV and EV, or at least not in a deterioration in SV and EV. However, as long as NPV of FV > 0 is the main criterion to judge the soundness of an M&A deal, the change in SV and EV is more likely to be negative than positive. In Chap. 6 (Eq. 6.3), we introduced the IPV (integrated present value) criterion for new investments:
$$ IPV= FV+b\bullet SV+c\bullet EV>0 $$
(18.3)
whereby b ≥ 0 denotes the weighting of SV; and c ≥ 0 denotes the weighting of EV. In the context of the models of Chap. 5 and 6, the incidence of M&A deals that do improve SV and/or EV is likely to increase with:
higher values for the parameters b and c to weight SV and EV.
In this way, applying the IPV criterion to M&A deals can improve the value profile of the company across the three value dimensions. The stylistic examples in Tables 18.2, 18.3, 18.4, 18.5 show the effects on the individual value dimensions: FV, SV, and EV. In reality, the three value dimensions interact. DSM is an example of a company that actively managed the three dimensions in an integrated way (though not using those labels). By improving SV and EV through internal investments and external M&A (see Box 18.4), DSM improved its long-term FV.
Box 18.4 DSM’s Transition
DSM (Dutch State Mines) was established by the Dutch government to mine coal reserves, as its name suggests. When the coal mines were closed in the 1970s, the Dutch government helped out in the transformation of DSM into a base chemicals company. The government did not want to protect the coal mining jobs, but wanted to maintain employment (an important S issue) in the southern part of the Netherlands.
Since the 1990s, during which the company was fully privatised, DSM has transformed itself again, selling almost all of its commodity chemicals activities (to reduce exposure to negative E factors) and becoming a global science-based company for nutrition and health through a string of M&A deals9:
acquisition of Martek in 2011—adding a new nutrition growth platform focused on polyunsaturated fatty acids;
acquisition of Fortitech in 2012 to strengthen its human nutrition business;
acquisition of Tortuga, the Brazilian market leader in organic trace minerals for animal nutrition and health, in 2013;
acquisition of SRF Ltd.’s Specialty Materials business in India in 2019;
acquisition of Erber Group, a company specialised in animal nutrition & health businesses, and Human Milk Oligosaccharides (HMO), a leading supplier of human milk for early life nutrition applications, in 2020;
merger with Firmenich, a Swiss manufacturer of flavours and fragrances for the food and beverage industry, in 2022.
The DSM–Firmenich merger combines the health and nutrition divisions of DSM and the taste and perfume divisions of Firmenich. This latest merger completed the transition of DSM into a global leader in nutrition, beauty, and wellbeing.
18.5.3 Integrated Takeover Test
Implicit awareness of SV and EV is rising, but not yet safeguarded. The aftermath of the aborted takeover of Unilever by Kraft Heinz generated a debate on the ‘protection’ of companies steering on integrated value against the aggressive bids of shareholder-driven companies. Without protection, financial considerations (F) would always dominate social and environmental considerations (S + E). This would imply a bias towards the shareholder model (see Chap. 3). General defences against takeovers, such as certified shares, dual class shares, pyramiding or priority shares with friendly shareholders, can reduce market discipline on the management, which in turn might decrease the stock price of the company, without necessarily protecting against value extraction.
De Adelhart Toorop et al. (2017) propose a societal cost-benefit test for takeovers, which includes financial, social, and environmental factors. This is akin to an integrated takeover test. It is the responsibility of the management of both the acquiring and target company to conduct this test to obtain the integrated value of the joint companies. Similar to the way that an investment bank decides whether the terms of an M&A deal are fair, an independent advisor would give a fairness opinion on the outcome of the integrated takeover test. A Commercial Division of the Court or a Take-Over Panel (as in the United Kingdom) would only approve a takeover or merger if and when this integrated takeover test showed an improvement in the integrated value for society (in comparison with the integrated value of the stand-alone companies)—and ideally an improvement in the value of all its components. When necessary the Court or Panel could appoint experts to re-calculate the integrated takeover test.
It should be acknowledged that conducting such an integrated takeover test is administratively cumbersome and requires detailed information. With advances in integrated reporting this information will become more readily available, as highlighted in Chap. 17.
18.5.4 Integrated View on M&A Activism
One could also apply the integrated lens (with or without a formal integrated takeover test) to judge M&A activism. M&A activism is typically justified by claims of value creation (in the form of ‘synergies’). But the key question is whether that value creation benefits all stakeholders (i.e., FV, SV, and EV all rise, or at least none of them fall), which is real or integrated value creation; or whether it is only value creation for (some) of the claimants of FV, coming at the expense of other stakeholders (i.e. SV and/or EV destroyed), which should be labelled value extraction instead of value creation (Mazzucato, 2018). It would be helpful if this distinction would already be made by managers, analysts, regulators, and reporters. Figure 18.4 illustrates this key question of value creation versus value extraction.
2 arrow diagrams represent value creation versus value extraction in M and A. The value creation involves improving F V, S V, and or E V without hurting the other. The value extraction involves taking a share of value at the expense of F V, S V, and or E V.
Fig. 18.4
Value creation versus value extraction in M&A
×
18.6 Conclusions
M&A are very large investments in which a company absorbs another company, which can dramatically change the profile of a company’s assets. M&A deals can be done for several reasons, some are more rational and valid than others. Less valid motives include diversification and deals done for the sake of boosting earnings per share (EPS). Value creation is often more likely if there are synergies between the companies involved. M&A deals tend to come in waves, with clustering in industries and partly driven by market valuations.
Just as in any other investment decision, the financial sanity of M&A activity can be assessed with the NPV method. However, the numbers tend to be much bigger than in ordinary capex decisions, hence the stakes are bigger as well. This makes behavioural issues even more problematic, as they can result in very large overvaluation, overinvestment, and value destruction. And indeed, massive value destruction in a small number of very large M&A deals is well documented.
E and S issues can also affect the risk and valuation of M&A deals. If not properly understood and considered, E and S issues can have similar effects as the abovementioned behavioural issues, and reduce the company’s financial value. A notorious example is Bayer’s acquisition of Monsanto, which resulted in over $10 billion in litigation costs on health issues due to Monsanto’s glyphosate product Roundup.
While the effects of E and S issues on M&A valuation are increasingly understood, scarce academic attention is given to the valuation of E and S in their own right in M&A deals. An M&A deal can be massively value destructive on E or S, which might justify blocking the deal. For example, the source of a takeover’s financial success can lie in business practices that involve increased pollution, negative health effects, and exploitation of workers and consumers. In contrast, M&A deals can also be used to acquire S and E capabilities, accelerating a company’s sustainability transition.
Therefore, an integrated perspective on M&A valuation is needed. In particular for large M&A deals, an integrated value test should be required. This implies that a takeover or merger would only go ahead if and when the integrated value of the combined companies is higher than the integrated value of the stand-alone companies. The DSM-Firmenich merger, which created a global nutrition and health company out of a chemicals company, would likely have passed the integrated value test. But the aborted takeover attempt of Unilever by Kraft Heinz would not have passed the integrated value test. While the merged combination might have improved short-term financial value (passing the NPV test), the integrated value would have declined as Kraft Heinz planned to reduce the sustainability (E and S) efforts of Unilever (failing the integrated value test).
Key Concepts Used in this Chapter
Acquirer is the company that buys another company in an M&A deal
Acquired company is the company that is bought by another company in an M&A deal
Acquisition is the situation in which one company buys another company; it is typically quite clear who is the buyer and who is the seller
Acquisition premium is the price paid in excess of the market price before the bid
Bidder is the company that tries to buy another company in an attempted M&A deal
Buyer is the company that buys another company in an M&A deal
Conglomerate M&A is an M&A among companies in unrelated businesses
Due diligence is an investigation carried out by the bidder (or its deal consultant) into the target’s accounts under strict non-disclosure agreements
Economies of scale means that as production volumes go up, unit costs tend to fall due to learning effects and the recovery of fixed costs
Economies of scope means that combining similar products tends to give positive spill-over effects
Horizontal M&A is an M&A among companies in the same line of business
Industry consolidation refers to M&A deals that reduce competition, taking a larger part of the consumer surplus (by the consolidated companies)
Integrated takeover test is a test which measures whether the integrated value of the combined companies is improved in comparison with the integrated value of the stand-alone companies
M&A refers to mergers and acquisitions and is used as a general term for all kinds of deals in which companies or parts of companies are bought and sold
Merger refers to the situation in which companies of roughly equal size together decide to continue as one company, without a clear buyer or seller
Synergies refer to the benefits from combining two companies
Takeover see acquisition
Takeover premium is the price paid in excess of the market price before the bid
Target is the company that is targeted to be bought by another company in an M&A deal
Value creation refers to an increase in environmental value (EV), social value (SV), and financial value (FV)
Value extraction refers to an increase in financial value (FV) at the expense of environmental value (EV) and/or social value (SV)
Value of performance improvements relate to the measures that the acquirer intends to take, for example cost cutting or using new market channels; these are often referred to as synergies
Vertical M&A is an M&A among companies in different stages of the same value chain
Open Access This chapter is licensed under the terms of the Creative Commons Attribution 4.0 International License (http://creativecommons.org/licenses/by/4.0/), which permits use, sharing, adaptation, distribution and reproduction in any medium or format, as long as you give appropriate credit to the original author(s) and the source, provide a link to the Creative Commons license and indicate if changes were made.
The images or other third party material in this chapter are included in the chapter's Creative Commons license, unless indicated otherwise in a credit line to the material. If material is not included in the chapter's Creative Commons license and your intended use is not permitted by statutory regulation or exceeds the permitted use, you will need to obtain permission directly from the copyright holder.
The attempted takeover of Unilever by Kraft Heinz in 2017 is particularly interesting because it represents a clash between two visions on value creation. Kraft Heinz represented the typical short-term financial optimiser of shareholder value; and Unilever the showpiece of enlightened shareholder value that recognises that, to obtain good long-term financial outcomes, other types of value need to be managed as well (see Fig. 18.5).
A block diagram of 3 company profiles. Dimensions include the goal, business model, and indicators. Kraft Heinz's profile involves the shareholder value, efficiency-driven model, and E P S. Unilever's profile involves the enlightened shareholder value, sustainable business model, and E P S, U S L P.
Fig. 18.5
Profile of the companies. Note: EPS is earnings per share; USLP is Unilever Sustainable Living Plan
×
Kraft Heinz was the result of the merger of Kraft and Heinz and listed by 3G in 2015. 3G is a Brazilian private equity house infamous for its efficiency squeeze model based on zero-based budgeting. Zero-based budgeting means that all expenses must be justified and approved for each new period, regardless of how much money has previously been budgeted to any given line item. ZBB was also applied at previous targets of 3G, like Anheuser-Busch, resulting in very high margins, because of cost savings.
For many investors, Kraft Heinz looked like the epitome of efficiency and shareholder value creation, with even legendary investor Warren Buffett involved. Kraft Heinz’s valuation was high, but its portfolio consisted of old-fashioned products and had little Emerging Markets exposure.
By contrast, Unilever did have an innovative product portfolio and a very high Emerging Markets exposure. It was also the favourite of proponents of a more social model (prosocial shareholders), with the Unilever Sustainable Living Plan (USLP) and a CEO who was vocal on social issues. But its margins were lower, and to the conventional investors, Unilever looked like the laggard that wasted money on fancy sustainability projects—behaviour begging to be ‘disciplined’ in the spirit of Jensen’s (1986) free cash flow hypothesis. So, some investors were complaining about inefficiency. And then the bid came.
Not surprisingly, the announcement of the bid sparked a lot of debate: does the more profitable and less social company have the right to acquire the more social company? Conventional investors said yes, and prosocial shareholders said no—but lacked the means to back that up by protecting Unilever—as even their own portfolio managers are incentivised to maximise financial returns in the short run.
Unilever rejected the bid, saying that it ‘fundamentally undervalues Unilever’, and: ‘Unilever rejected the proposal as it sees no merit, either financial or strategic, for Unilever’s shareholders. Unilever does not see the basis for any further discussions’. And many of Unilever’s top shareholders said that the bid drastically undervalued the company’s assets. Unilever’s CEO, Paul Polman played the game well, effectively forcing Kraft Heinz to come out with a bid much earlier than planned. That bid was too low and easily rejected. Three years later, it is Kraft Heinz that is in trouble while Unilever continues to flourish. Kraft Heinz suffered from falling margins and sales as well as an accounting scandal. Its stock price collapsed from just under $100 at the time of the bid, to well below $30 in 2020. However, it should be emphasised that Unilever’s successful rejection of the bid was not a foregone conclusion, and it came at a price: to avoid another bid 6 months later (the regulatory window), the company felt it needed to keep the share price above €50, and it was forced to take measures such as cost cutting, disposals, and share buybacks.
Available and Missing Numbers in Kraft-Heinz’ Failed Takeover Attempt of Unilever
The enlightened shareholders were basically saying that there was positive value in Unilever’s model, which would have been destroyed if the takeover had happened. But they lacked the numbers to show that, and the mandate to act on it. In this section, we try to fill in those missing numbers, before discussing potential action in the next section. We value the bid from four perspectives:
1.
short-term shareholder value;
2.
long-term shareholder value;
3.
social value; and
4.
environmental value.
Short-term shareholder value
Kraft Heinz had a growth strategy based on maximising earnings per share. We use the multiples formula from Chap. 9 (Eq. 9.17) for calculating the components of the stock price P0:
$$ {P}_0={EPS}_0\ast \frac{P}{E} $$
(18.4)
whereby EPS0 is the earnings per share and P/E the price-earnings ratio. Table 18.7 derives the earnings per share and multiples underlying the initial stock price: PUnilever = €1.90 ∗ 20.8 = €39.5 and the target stock price: PUnilever = €3.01 ∗ 22 = €66.3.
Table 18.7
Kraft Heinz’ path to short-term value creation
Item
Value
Unilever 2016 EBIT margins (1)
15%
KH EBIT margin target for 2017 (2)
26%
% of the margin gap to be closed (3)
80%
New Unilever margin under KH management (4) = (1) + [(2)–(1)]*(3)
Source: Derived by the authors based on company financials and news items
Before the bid, Unilever’s stock price drifted around €39–40. Allegedly, 3G and Warren Buffett thought they could create $50 billion in shareholder value by taking over Unilever and raising its EBIT margins from 15% towards the levels of Kraft Heinz (26% in 2017). They would do that by using zero-based budgeting and cutting as much cost as possible, including spending on marketing and on the USLP. This would raise 2017 EPS from €1.9 to €3.0. A key assumption was apparently that the price-earnings multiple would rise to 22 as a more profitable company should fetch a higher multiple.10 The stock price would move to €66.3 (22*€3.0), an increase of €27 or 70%. That would imply a market value of €114 billion (€66.3*1.715 billion shares) versus €68 billion (€39.5*1.715 billion shares) previously; hence, short-term value creation of €46 billion, or almost $50 billion (see Table 18.8 and Fig. 18.6). These numbers look very impressive. But they are also very simplistic, as they require some implicit assumptions to hold. First and foremost, it implies that profitability permanently moves to a much higher level, while holding all else equal, i.e. growth remains the same, and the cost of capital remains the same. That is not realistic: the cuts in spending on marketing and the USLP are bound to result in a loss of sales growth.
Table 18.8
Kraft Heinz’ short-term value creation
Short-term value creation based on EPS
Equity value per share
Market capitalisation € billions
Stock price before the bid
€ 39.5
€ 68
Kraft Heinz bid price
€ 47.0
€ 81
Likely value to Kraft Heinz
€ 66.3
€ 114
Short-term value creation
€ 26.8
€ 46
A bar graph of the short-term value capture per share. Unilever's stock price right before the bid is 40 euros. Kraft-Heinz's bid price is 47 euros. The estimated value to Kraft Heinz is 66 euros. The value captured by selling shareholders is 7 euros. The value captured by Kraft Heinz is 19 euros.
Fig. 18.6
Short-term value capture per share
×
Long-term Shareholder Value
The long-term shareholder value can be measured by the DCF model. Taking Eq. (9.12) from Chap. 9, we can calculate the enterprise value V0 as follows:
where WACC represents the weighted average cost of capital, FCF the free cash flow, and TVN the terminal value at t = N. The underlying value drivers of the free cash flows (and the terminal value) are sales and margins. The cost of capital WACC is the third value driver (see Sect. 9.4 in Chap. 9).
We consider long-term value creation by comparing the DCF value of Unilever in a stand-alone scenario with the DCF of Unilever within Kraft Heinz. For the bid to be long-term value creative, the latter DCF value should be higher, but we find the opposite. In the stand-alone DCF, we assume a rise in margins to 16% driven by management’s current program, and 4% sales growth for the years to come. The cost of capital is 7.4%. While there is a positive relation between sales growth and margins due to economies of scale, there is also a trade-off between margins and growth: by investing in sustainability and its brands, Unilever’s margins are lower than they could have been, but they help keep sales growth higher. We make the following Value Driver Adjustments (VDAs, see Chap. 9): due to its USLP, margins are probably 300 bps lower than they could have been, and sales growth is probably 200 bps higher than that of a similar company without USLP. Inserting these assumptions in otherwise identical DCF models of Unilever, Table 18.9 shows an 8% higher fair value (€64.7) in the case with the USLP than in the case without USLP (€60.2). See the book’s website (available at www.rsm.nl/corporatefinanceforlongtermvalue) for the DCF model used.
Table 18.9
Value driver adjustments for the USLP
Sales growth
EBIT margins
WACC
Fair value
Unilever excl. USLP
2%
19%
7.4%
€60.2
USLP effect
+200 bps
−300 bps
–
+€4.5
Unilever incl. USLP
4%
16%
7.4%
€64.7
Note that the resulting fair values are over 50% higher than the stock price of €40. This means the market took a dim view of management’s ability to realise those value drivers. And the €64.7 price target may look excessively optimistic. The DCF calculation suggests it is not. First, the value driver assumptions are plausible given Unilever’s positioning. Second, the DCF outcome was not the most optimistic out there: some analysts had price targets of well over €70 and many of Unilever’s top shareholders said that the bid drastically undervalued the company’s assets. Third, Kraft Heinz’s value drivers were much more aggressive than Unilever’s (see below). Fourth, deriving the market implied value drivers suggests that the market was mainly extrapolating recent weaker performance. We can estimate the market implied value drivers by starting from our €64.7 and adjusting each value driver. Assuming sales growth of 2.5% instead of 4% takes €13 off the stock price. This is consistent with analysts’ scepticism on Unilever’s sales growth following a period of currency fluctuations in emerging markets. Next, assuming margins to stay at 14% (i.e. extrapolating the 2015 level) instead of rising to 16%, takes another €8 off the stock price. Finally, using a WACC of 7.9% instead of 7.4% brings down the stock price another €4, to arrive at €39.6.
The next question is how Unilever’s stand-alone value compares to long-term value within Kraft Heinz. In the case of Unilever within Kraft Heinz, we assume margins to temporarily rise much higher to 24%, but then to drop back down to 18%, which is still higher than in the stand-alone scenario. But crucially, we expect sales growth to slow dramatically in the within Kraft Heinz scenario because of reduced marketing and sustainability spending. See Figs. 18.7 and 18.8. Although we should be careful with reasoning with hindsight, this was soon borne out by Kraft Heinz’s own value driver performance, which had plummeting margins and negative sales growth—while Unilever kept up its value driver performance.
A line graph estimates sales growth. The D C F standalone line plots a horizontal curve at 4%. The D C F market implied line plots a horizontal curve at 2.5%. The D C F Unilever in K H C line plots a fluctuating curve, with the lowest at 0% in 2021. Values are estimated.
Fig. 18.7
Unilever sales growth within Kraft Heinz versus stand-alone and market implied
A line graph of E B I T margins. The D C F standalone line plots a horizontal curve at 16%. The D C F market implied line plots a horizontal curve at 14%. The D C F Unilever in K H C line plots a fluctuating curve, with the highest at 24% in 2021. Values are estimated.
Fig. 18.8
Unilever margins within Kraft Heinz versus stand-alone and market implied
×
×
As a result, the DCF value is higher in the stand-alone scenario (€64.7) than in the within Kraft Heinz scenario (€58.4). Note that the latter is below the value of €66.3 envisaged by 3G and Warren Buffett, as they simplistically and conveniently assumed sales growth to stay the same. Clearly, a longer horizon brings a different perspective here. And this is even without considering internalisation scenarios, i.e. scenarios in which the company would have to pay up for the negative externalities it creates. These would be much higher in the within Kraft Heinz scenario than in the stand-alone scenario, as we will see in the following sections on societal value. Also, we did not make adjustments to the cost of capital in case of a within Kraft Heinz scenario, but in hindsight an upward (i.e. value reducing) adjustment seems plausible. Given Kraft Heinz’ poor societal record, hidden liabilities are likely. The long-term value differences are visualised in Fig. 18.9.
A bar graph plots the long-term shareholder value. The values are as follows. D C F value Unilever standalone, 65 euros. D C F value Unilever in Kraft Heinz, 58 euros. Long-term financial value destruction by Kraft Heinz is 7 euro per share.
Fig. 18.9
Long-term shareholder value
×
Of course, one could argue that the stand-alone value is too high (or too low), depending on the assumptions used. The same applies to the DCF value of Unilever within Kraft Heinz. Whether the DCF valuation estimate is correct cannot be established. In the end, a valuation is a reasoned opinion. For the sake of the argument, it does not even matter: the point is that such calculations should be done in the first place to make comparisons that are typically not made.
Social Value
For the calculation of the social and environmental value, we focus on material social and environmental issues (see Chap. 5). If anything, this leads to an undervaluation of these values. Given its ZBB program, we would expect Kraft Heinz to make spending cuts in both Unilever’s own workforce and in its sourcing. In the hunt for bargains, the latter would necessarily involve relaxation of labour rights demands in the supply chain as well as reduced enforcement thereof. This would eliminate much of the work done by Unilever on improving working conditions in its major supply chains.
Table 18.10 summarises our assumptions and the resulting estimated value losses for both employees and people in the supply chain. The latter would account for the bigger loss—while per person losses may be lower, this concerns much more people than the employee effect. Unilever had 169,000 people directly employed. The value of employment can be measured in life satisfaction points. We assume a deterioration in working conditions and salaries of one life satisfaction points of €2250 (2017 prices derived from Table 11.11). In the supply chain, Unilever had 1.5 million farmers. Adding other workers, we assume three million people in the supply chain. The average living wage gap was €3000 (source: Impact Institute). We assume that Kraft Heinz would operate at the average, while Unilever had halved the living wage gap. The attribution factor for the supply chain is 0.5 (see Chap. 5).
Table 18.10
Social value loss
Stakeholders
Employees
People in the supply chain
Nature of the value creation/destruction
Change in working conditions and salaries
Change in (1) social programmes on sanitation, women empowerment, etc. (2) working conditions and salaries at suppliers
Crude assumptions
Deterioration in working conditions and salaries equivalent to a loss of €2250 per employee per year for next 15 years
3 million people in and near the Unilever supply chain to suffer a loss in value of €1500 per person per year for next 15 years; attribution factor of 0.5
Volume unit
People
People
Number (thousands)
169
3000
Value per unit per year (in €)
−2250
−750
Annual value creation, € billions
−0.4
−2.3
Social discount rate of 2.2%, with employee growth at 2% per year
2.2%
2.2%
PV of value creation, € billions
−5
−33
PV of value creation, € per share
−3
−19
The appropriate discount rate for social value is the social discount rate of 2.2% (see Chap. 12). Finally, we assume these differences to last for 15 years, as Kraft Heinz will at some point be forced to adhere to international labour standards.
Admittedly, these estimates are mere guesses—the best we can do given the state of reporting on these topics. Therefore, the numbers should be used with caution: they could be much higher or lower. Still, it is safe to assume that the sign is correct: stakeholders would suffer a value loss on S if Unilever were taken over by Kraft Heinz. Table 18.10 estimates the social value loss at €22 per share.
Environmental Value
For E, we can do the same kind of analysis as for S, but of course with different indicators. We could try to estimate Unilever’s impact on all of the nine planetary boundaries (see Chap. 1). However, for the sake of simplicity, we only consider GHG emissions. Unilever’s 2018 CO2 equivalent footprint was 61 million tonnes, achieved on a programme aimed at emissions reductions. Kraft Heinz does not have reduction targets (or even reporting) on GHG, so we estimate future emissions of Unilever within Kraft Heinz to be 10% higher. This means an additional 6.1 million tonnes per annum (i.e. ignoring the mutually offsetting effects of sales growth and efficiencies). That amount can be monetised by using a carbon price, for which we take the 2017 shadow price of €137 (source: True Price). True Price’s shadow carbon price grows at 3.5% per year. Again, we assume the difference to last for 15 years, as Kraft Heinz will at some point also be forced to reduce carbon emissions. Table 18.11 estimates the environmental value loss at €8 per share.
Table 18.11
Environmental value–GHG emissions
Stakeholder
Current and future generations
Nature of the value creation/destruction
Change in GHG emissions. Unilever’s 2018 CO2 equivalent footprint was 61 million tonnes.
Crude assumptions
In the absence of reduction targets at Kraft Heinz, future emissions for the next 15 years are estimated to be 10% higher at €137 carbon price.
Volume unit
CO2 equivalent
Number (thousands)
6100
Value per unit per year (in €)
−137
Annual value creation, € billions
−0.8
Social discount rate of 2.2%, with shadow carbon price growing at 3.5% per year
2.2%
PV of value creation, € billions
−13
PV of value creation, € per share
−8
Again, it should be stressed that this is done in the absence of critical data: Kraft Heinz does not even report its emissions. Moreover, this is just carbon. It does not include the likely massive effects on biodiversity (palm oil, plastics), nitrogen cycles, or other planetary boundaries. Also, this is value destruction of the within Kraft Heinz case versus Unilever stand-alone—i.e. the value destruction on top of that already being effected by Unilever. In fact, a company with serious externalities needs to have a transition path towards elimination of those externalities—which Unilever is trying to develop, and Kraft Heinz is not.
Total Long-term Value Destruction
The materiality (or lack thereof) of the social and environmental dimensions is highly context specific. It varies per industry, and also within industries, depending on the nature of the industry, the specific company’s business model and local conditions (see Chaps. 2 and 5). Hence, the KPIs used will differ across companies. Still, one can estimate financial, social, and environmental value or the change therein, which we present in Table 18.12 and Fig. 18.10.
Table 18.12
Unilever’s long-term value creation (in € billions)
Long-term value creation based on DCF
Equity value per share
Equity value € billions
DCF value Unilever stand-alone
€ 64.7
€ 111
DCF value Unilever in Kraft Heinz
€ 58.2
€ 100
Financial value creation
−€ 6.5
−€ 11
Social value creation
−€ 22.2
−€ 38
Environmental value creation
−€ 7.8
−€ 13
Long-term value creation
−€ 36.5
−€ 63
Note: The equity value is obtained by multiplying the equity value per share with the number of outstanding shares, which is 1.715 billion shares. For example, the long-term value creation is -€63 billion (=€36.5*1.715 billion shares). Please note that numbers do not add up exactly due to rounding
A step graph of the integrated value creation, and destruction per share. The values are as follows. L T shareholder value creation, 6 euros. Social value creation, 22 euros. Environmental value creation, 8 euros. The estimated total value destruction, if Kraft Heinz's bid succeeded, 36 euros.
Fig. 18.10
Integrated value creation (destruction) per share
×
We arrive at €36.5 value destruction per share, or 56% of the long-term value per share of €64.7. Of course, this number should be interpreted with caution: critical numbers are missing, so there is a wide confidence interval. Moreover, one could disagree with the assumptions applied in our analysis. This means that the size could change, in both directions—as argued, we did not take into account aspects of S and E that were also likely to give value destruction. While sizes could be debated, the negative signs on S and E would not disappear.
It is also striking that all components are in the same direction: the takeover would have resulted in value destruction on F, S, and E—only short-term F based on EPS would have gone up (provided that investors believed Kraft Heinz’ financial engineering for at least a while). Of course, we could also have found a value creation profile that was negative on S and E, but positive on long-term F. In that case, narrow fiduciary duty would have obliged Unilever’s board to support the takeover bid. This illustrates the importance of the integrated takeover test, introduced in Sect. 18.5. This test would fail in the Kraft Heinz-Unilever case, not allowing the takeover to proceed. The integrated value destruction of €36.5 per share, which amounts to €63 billion in equity value, could not be compensated by potential synergies.
Conclusions and Recommendations
The analysis of Kraft Heinz’s attempted takeover of Unilever illustrates that social and environmental value destruction in M&A can be massive. Such value destruction typically remains invisible, because it is not a common practice to consider it, let alone to analyse it. Those who want to do such analysis run into an information problem: the needed data is typically not reported. As described in Chap. 17, corporate reporting is expected to evolve in such a way that it allows users to estimate social and environmental value in a better way.
Next, incentive structures are such that the bid could have succeeded, with a few people better off (short-term financial gain) at the expense of all others. Such value destruction could be avoided by changing corporate legal and taxation structures, as well as business education.