Top

2017 | Book

Statistical Analysis of Proteomics, Metabolomics, and Lipidomics Data Using Mass Spectrometry

insite
SEARCH

About this book

This book presents an overview of computational and statistical design and analysis of mass spectrometry-based proteomics, metabolomics, and lipidomics data. This contributed volume provides an introduction to the special aspects of statistical design and analysis with mass spectrometry data for the new omic sciences. The text discusses common aspects of design and analysis between and across all (or most) forms of mass spectrometry, while also providing special examples of application with the most common forms of mass spectrometry. Also covered are applications of computational mass spectrometry not only in clinical study but also in the interpretation of omics data in plant biology studies.

Omics research fields are expected to revolutionize biomolecular research by the ability to simultaneously profile many compounds within either patient blood, urine, tissue, or other biological samples. Mass spectrometry is one of the key analytical techniques used in these new omic sciences. Liquid chromatography mass spectrometry, time-of-flight data, and Fourier transform mass spectrometry are but a selection of the measurement platforms available to the modern analyst. Thus in practical proteomics or metabolomics, researchers will not only be confronted with new high dimensional data types—as opposed to the familiar data structures in more classical genomics—but also with great variation between distinct types of mass spectral measurements derived from different platforms, which may complicate analyses, comparison, and interpretation of results.
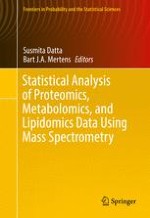
Table of Contents

Frontmatter
Transformation, Normalization, and Batch Effect in the Analysis of Mass Spectrometry Data for Omics Studies
Abstract
Data transformation, normalization, and handling of batch effect are a key part of data analysis for almost all spectrometry-based omics data. This paper reviews and contrasts these three distinct aspects. We present a systematic overview of the key approaches and critically review some common procedures. Much of this paper is inspired by mass spectrometry-based experimentation, but most of our discussion carries over to omics data using distinct spectrometric approaches generally.
Bart J. A. Mertens
Automated Alignment of Mass Spectrometry Data Using Functional Geometry
Abstract
A principled approach for automated alignment of LC-MS chromatograms is critical for reconciling observations across settings and devices, and for annotating large databases of chromatograms. While current algorithms rely on certain pre-processing steps, such as peak detection and matching, tasks that are often subjective and require human intervention, we present a simple and yet fully automated, computational technique for alignment of peaks/nulls in chromatograms. The basic idea is to view chromatograms as real-valued functions on a fixed interval, and derive a geometric, template-based alignment approach. The template is constructed as the sample mean of the given functions under an extended Fisher-Rao metric, and the individual functions are aligned to this mean using time-warping under the same metric. While the original form of the metric is complicated, a square-root slope function representation simplifies it to the \(\mathbb{L}^{2}\) metric, and makes the overall algorithm very efficient. We demonstrate these ideas using a number of alignment experiments, both pairwise and groupwise, and highlight the effectiveness of this automated procedure in spectral alignment.
Anuj Srivastava
The Analysis of Peptide-Centric Mass-Spectrometry Data Utilizing Information About the Expected Isotope Distribution
Abstract
In shotgun proteomics, much attention and instrument time is dedicated to the generation of tandem mass spectra. These spectra contain information about the fragments of, ideally, one peptide and are used to infer the amino acid sequence of the scrutinized peptide. This type of spectrum acquisition is called a product ion scan, tandem MS, or MS2 spectrum. Another type of spectrum is the, often overlooked, precursor ion scan or MS1 spectrum that catalogs all ionized analytes present in a mass spectrometer. While MS2 spectra are important to identify the peptides and proteins in the sample, MS1 spectra provide valuable information about the quantity of the analyte. In this chapter, we describe some properties of MS1 spectra, such as the isotope distribution, and how these properties can be employed for low-level signal processing to reduce data complexity and as a tool for quality assurance. Furthermore, we describe some cases in which advanced modeling of the isotope distribution can be used in quantitative proteomics analysis.
Tomasz Burzykowski, Jürgen Claesen, Dirk Valkenborg
Probabilistic and Likelihood-Based Methods for Protein Identification from MS/MS Data
Abstract
The process of identification of peptides from the mass spectra and the constituent proteins in a sample is called protein identification. In the current literature, there exist many proposed approaches for the protein identification problem based on tandem mass spectrometry (MS/MS) data. While there are many two-step protein identification procedures that first identify peptides in a separate process and then use the results in protein identification, in recent years there have been attempts to develop a one-step solution to the problem through simultaneous identification of proteins and peptides in a sample. We briefly introduce the probabilistic and likelihood-based two-step and one-step procedures and report some comparative performances of these procedures for different MS/MS data.
Ryan Gill, Susmita Datta
An MCMC-MRF Algorithm for Incorporating Spatial Information in IMS Proteomic Data Processing
Abstract
It is desirable to not only identify the peaks of the mass spectra but also to study relations among them using the spatial information for the entire imaging mass spectrometry (IMS) data cube. In this paper, we incorporate spatial information in IMS data analysis using Markov random field (MRF) and optimize classification accuracy with Markov chain Monte Carlo (MCMC) sampling. First, we discuss the necessity of incorporating spatial information in IMS data analysis and give a brief introduction to MRF and its background. Then, we develop the MCMC-MRF computation framework using MCMC sampling and the Ising model, which is the simplest MRF, as prior information to optimize IMS data classification accuracy. The method to estimate parameters using training data is also discussed. Finally, we use test data to test the performance of this model under different definitions of neighboring system. The experiment results show that the MCMC-MRF model can improve IMS data classification accuracy effectively, and the more realistically the neighboring system is defined, the better classification result will be.
Lu Xiong, Don Hong
Mass Spectrometry Analysis Using MALDIquant
Abstract
MALDIquant and associated R packages provide a versatile and completely free open-source platform for analyzing 2D mass spectrometry data as generated, for instance, by MALDI and SELDI instruments. We first describe the various methods and algorithms available in MALDIquant. Subsequently, we illustrate a typical analysis workflow using MALDIquant by investigating an experimental cancer data set, starting from raw mass spectrometry measurements and ending at multivariate classification.
Sebastian Gibb, Korbinian Strimmer
Model-Based Analysis of Quantitative Proteomics Data with Data Independent Acquisition Mass Spectrometry
Abstract
In shotgun proteomics, more abundant peptides are selected for MS/MS fragmentation leading to sequence assignment and their quantitative abundance is computed from peak area of the extracted ion chromatogram. This analysis framework is called data dependent acquisition (DDA). However, the bias towards abundant peptides limits reproducible extraction of peptide signals for a large proportion of the proteome. Recent advances in next generation mass spectrometers enabled implementation of an alternative approach called data independent acquisition (DIA), which improves data quality in terms of dynamic range, measurement precision, and more importantly, reproducible detection. In this chapter, we review the process of generating quantitative proteomics data with DIA, and present a computational tool mapDIA designed for data processing and statistical analysis of the DIA proteomics data. Using an example of renal cancer data set, we demonstrate that fragment intensity data from DIA provide a reliable repeated measure of peptide abundance after careful filtering, and direct modeling of the hierarchical data (protein → peptide → fragment) improves the detection of differentially expressed proteins compared to the analysis using protein intensity data derived by summation of fragment intensities.
Gengbo Chen, Guo Shou Teo, Guo Ci Teo, Hyungwon Choi
The Analysis of Human Serum Albumin Proteoforms Using Compositional Framework
Abstract
Mass spectrometric immuno assays (MSIA) can now measure multiple modified forms of a protein in large cohorts of patients. These measurements consist of the relative abundances of proteoforms, and are well-suited for the compositional data analysis statistical framework. In this article, we describe an approach to the analysis of relative abundance of proteoforms from MSIA data using the compositional framework. We demonstrate the application of these concepts by exploring the association of human serum albumin’s posttranslational modifications and kidney function in patients with Type 2 diabetes mellitus. Finally, we discuss the pitfalls of ignoring the compositional nature of such data, and highlight emerging applications demonstrating the generality of the framework.
Shripad Sinari, Dobrin Nedelkov, Peter Reaven, Dean Billheimer
Variability Assessment of Label-Free LC-MS Experiments for Difference Detection
Abstract
In the analysis of data acquired from label-free experiments by liquid chromatography coupled with mass spectrometry (LC-MS), accounting for potential sources of variability can improve the detection of true differences in ion abundance. Mixed effects models are commonly used to estimate variabilities due to heterogeneity of the biological specimen, differences in sample preparation, and instrument variation. In this chapter, we investigate the mixed effects models and evaluate their performance in difference detection, in comparison to other methods such as marginal t-test, which uses the average over analytical and technical replicates within each biological sample for statistical analysis. Experimental design including replication assignment and sample size calculation is discussed. These are highly dependent on the variation contributed by the different sources, which can be estimated from LC-MS pilot studies prior to running large-scale label-free experiments.
Yi Zhao, Tsung-Heng Tsai, Cristina Di Poto, Lewis K. Pannell, Mahlet G. Tadesse, Habtom W. Ressom
Statistical Approach for Biomarker Discovery Using Label-Free LC-MS Data: An Overview
Abstract
The identification of new diagnostic, prognostic, or theranostics biomarkers is one of the main aims of clinical research. Technologies like mass spectrometry (MS) focus on the discovery of proteins as biomarkers and are commonly being used for this purpose. Mass spectrometry consists in the separation by gas of charged molecules, based on their mass-over-charge. Liquid chromatography coupled to tandem mass spectrometry (LC-MS/MS) first involves a separation by liquid chromatography (LC) followed by mass spectrometry in the MS and MS/MS modes.
Caroline Truntzer, Patrick Ducoroy
Bayesian Posterior Integration for Classification of Mass Spectrometry Data
Abstract
High-throughput technologies currently have the capability to capture information at both global and targeted scales for the transcriptome, proteome, and metabolome, as well as determining functional aspects of these biomolecules. The promise of data integration is that by utilizing these disparate data streams a more accurate predictive model of the phenotype of interest can be developed by identifying the best subset of molecules associated with the outcome. However, in a space of tens of thousands of variables (e.g., genes, proteins), feature selection approaches often yield over-trained models with poor predictive power. Moreover, feature selection algorithms are typically focused on a single source of data and do not evaluate the effect on downstream statistical integration models. The integration of Bayesian statistical outputs have been shown to be an effective approach that optimizes the outcome of interest in the context of the integrated posterior probability. This chapter demonstrates that this approach can improve sensitivity and specificity over simple selection routines based on individual high-throughput datasets generated via mass spectrometry.
Bobbie-Jo M. Webb-Robertson, Thomas O. Metz, Katrina M. Waters, Qibin Zhang, Marian Rewers
Logistic Regression Modeling on Mass Spectrometry Data in Proteomics Case-Control Discriminant Studies
Abstract
We present an adaption of the logistic regression model for the evaluation of mass spectrometry data in proteomics case-control studies. We parameterize the predictor as a linear combination of Gaussian basis functions along the mass/charge axis. The location of these basis functions is treated as a random variable and must be estimated from the data. A fully Bayesian implementation is pursued, which allows the number of functional components within the regression parameter vector to be specified as a random variable. Calculations are implemented through birth–death process modeling. We evaluate the model on data from a block-randomized case-control designed experiment, as well as on a proteomic model-mouse study, which were both carried out at the Leiden University Medical Center. The first experiment compares mass spectra of serum samples of 63 colon cancer patients with spectra from 50 control patients. We present a-posteriori analyses of the fitted models which allow researchers to select specific spectral regions for further investigation and identification of the associated differentially expressed peptides. A sensitivity study is presented which links some of our results to those which may be obtained through standard maximum likelihood logistic regression on principal components reduction for mass spectral data. The second experiment contrasts proteomic spectra from 18 dystrophin-deficient mdx mice with those from 74 controls.
Bart J. A. Mertens
Robust and Confident Predictor Selection in Metabolomics
Abstract
Metabolomics is a proven tool to obtain information about differences in food stuffs and to select biochemical markers for sensory quality of food products. A valuable application of untargeted metabolomics is the selection of metabolites that are (highly) predictive for sensory or phenotypical traits for use as (bio) markers. This chapter demonstrates how to robustly select key metabolites and evaluate their predictive properties. The proposed approach constrains the number of selected metabolites, searching for an optimal number of predictive metabolites by cross-validation. This mitigates the problem of selection of spurious metabolites. It also enables straightforward use of linear regression. In the present implementation simple forward selection is used. In concert with a second cross-validation to assess the predictive power of the selected set of metabolites, the proposed method involves two leave-one-out cross-validations and will be referred to as LOO2CV. In the second leave-one-out cross-validation a multitude of regression models is generated. This offers additional information that is potentially useful for selection of key metabolites in the spirit of stability selection. The proposed LOO2CV approach is illustrated with sensory and large-scale metabolomics data from a set of 76 different cocoa liquors. The proposed approach is compared with conventional stepwise regression and stepwise regression in concert with cross-validation for evaluation of predictive power of the model.
J. A. Hageman, B. Engel, Ric C. H. de Vos, Roland Mumm, Robert D. Hall, H. Jwanro, D. Crouzillat, J. C. Spadone, F. A. van Eeuwijk
On the Combination of Omics Data for Prediction of Binary Outcomes
Abstract
Enrichment of predictive models with new biomolecular markers is an important task in high-dimensional omic applications. Increasingly, clinical studies include several sets of such omics markers available for each patient, measuring different levels of biological variation. As a result, one of the main challenges in predictive research is the integration of different sources of omic biomarkers for the prediction of health traits. We review several approaches for the combination of omic markers in the context of binary outcome prediction, all based on double cross-validation and regularized regression models. We evaluate their performance in terms of calibration and discrimination and we compare their performance with respect to single-omic source predictions. We illustrate the methods through the analysis of two real datasets. On the one hand, we consider the combination of two fractions of proteomic mass spectrometry for the calibration of a diagnostic rule for the detection of early stage breast cancer. On the other hand, we consider transcriptomics and metabolomics as predictors of obesity using data from the Dietary, Lifestyle, and Genetic determinants of Obesity and Metabolic syndrome (DILGOM) study, a population-based cohort, from Finland.
Mar Rodríguez-Girondo, Alexia Kakourou, Perttu Salo, Markus Perola, Wilma E. Mesker, Rob A. E. M. Tollenaar, Jeanine Houwing-Duistermaat, Bart J. A. Mertens
Statistical Analysis of Lipidomics Data in a Case-Control Study
Abstract
We investigate variable-dimension modeling to assess effect of lipids in a case-control study. Use of multiple imputation on partially observed or incomplete data is discussed. It is demonstrated how the model allows us to investigate lipid selection and co-selection for association with the case-control outcome. The Leiden Longevity lipid study data is used to illustrate the methods.
Bart J. A. Mertens, Susmita Datta, Thomas Hankemeier, Marian Beekman, Hae-Won Uh
Metadata
Title
Statistical Analysis of Proteomics, Metabolomics, and Lipidomics Data Using Mass Spectrometry
Editors
Susmita Datta
Bart J. A. Mertens
Copyright Year
2017
Electronic ISBN
978-3-319-45809-0
Print ISBN
978-3-319-45807-6
DOI
https://doi.org/10.1007/978-3-319-45809-0

Premium Partner