The moderating role of CEO sustainability reporting style in the relationship between sustainability performance, sustainability reporting, and cost of equity
Authors:
Kerstin Lopatta, Thomas Kaspereit, Sebastian A. Tideman, Anna R. Rudolf
This paper explores the role of individual managers in the relationship between sustainability performance, sustainability reporting, and cost of equity. Based on prior research showing that both sustainability performance and reporting reduce the risk premium, this paper contributes to the literature by acknowledging that the true motives behind a manager’s corporate sustainability engagement are not apparent to investors. Thus, investors need to rely on further information to assess the relationship between sustainability performance and risk. We argue that CEOs’ values and preferences drive their decisions regarding sustainability activities. Thus, their fixed effect on sustainability reporting conveys a signal to investors about the motives behind corporate sustainability engagement and the extent of reporting. In the first step of our empirical analysis, we document that a CEO’s specific reporting style indeed has significant statistical power in explaining a company’s level of sustainability reporting. In the second step, we find that improved sustainability performance is associated with increased cost of equity when the CEO exerts a strong personal influence on sustainability reporting. However, cost of equity declines if the CEO’s influence on the reporting of improved sustainability performance is low. Our results are consistent with the argument that investors interpret CEO’s fixed-effect on sustainability reporting as a signal. That is, for a high CEO fixed-effect, increases in sustainability engagement are conflated with the CEO's self-interested values. In further tests, we show that the signal seems to be particularly important for normative sustainability activities (vs. legal sustainability activities).
Springer Nature remains neutral with regard to jurisdictional claims in published maps and institutional affiliations.
1 Introduction
“The most fundamental criticism of CSR is that what executives spend on it is other people’s—i.e., shareholders’—money. They may mean well, and it may give them satisfaction to write a cheque for hurricane victims or disadvantaged youth, but that is not what they were hired to do. Their job is to make money for shareholders. It is irresponsible for them to sacrifice profits in the (sometimes vain) pursuit of goodness.”1
Anecdotal evidence such as the quote above suggests that at least some investors and parts of the business press are critical when it comes to strong sustainability engagements on the part of chief executive officers (CEOs). Prior research has shown that CEOs indeed have a significant imprint on a company’s decisions regarding sustainability performance (Cronqvist and Yu 2017; Jiraporn and Chintrakarn 2013). These individual decisions are based on distinct and unobservable motives (Aguilera et al. 2007). Specifically, CEOs’ social values seem to determine their instrumental, relational, and moral motives (Boone et al. 2020). However, the way in which CEOs’ social values and motives translate into company-level sustainability is somewhat difficult to assess for outsiders such as investors, as it is hard to determine whether these decisions are driven by self- or other-serving values (Boone et al. 2020).
Advertisement
In this paper, we address the question of whether investors perceive CEOs’ sustainability reporting style as a signal, and if they assess company risk as a function of sustainability performance that is moderated by sustainability reporting. This approach is motivated by prior research that suggests that the relationship between sustainability performance and financial performance is not linear. Positive, negative, and non-significant relationships have been documented to date in various contexts (Fujii et al. 2013; McWilliams and Siegel 2000; Trumpp and Guenther 2017; Schreck 2011). Accordingly, the impact of sustainability performance on future financial performance and company risk can be difficult for capital market participants to assess. Therefore, sustainability reporting is essential for companies to reduce information asymmetries on their sustainability activities (Clarkson et al. 2013; Dhaliwal et al. 2011; El Ghoul et al. 2011). Stakeholders may also incorporate other additional publicly available information in their assessment of the true motives underlying a firm’s engagement in sustainability (Ogunfowora et al. 2018).
CEOs’ engagement in sustainability activities is driven by a mix of instrumental and relational motives. These motives aim at maximizing their own utility function through compensation, job stability, and reputation, as well as moral motives that are purely altruistic beyond genuine self-fulfillment (Aguilera et al. 2007). Since CEOs are guided by their social values and preferences in their decision making regarding sustainability activities (Boone et al. 2020), we hypothesize that their social values and preferences also influence a company’s sustainability reporting. This channel is essential to disseminate information about sustainability performance to the external environment (Clarkson et al. 2013).2 Therefore, it is difficult for capital market participants to evaluate the motives behind sustainability engagement and the implications for their investment in the companies. CEOs might offer some potentially significant insights that affect outsiders’ perception of sustainability engagement motives (Ogunfowora et al. 2018). Based on signaling and attribution theory, we postulate that CEOs’ sustainability reporting style is a public signal available to investors.3 Investors then consider this signal in building their assessment of company risk, which in turn is a function of sustainability performance. Therefore, we argue that a deviation from average CEO reporting behavior (relative to a company’s baseline level of reporting on sustainability) could be recognized and interpreted by investors as an ambiguous signal. It is thus ex-ante unclear whether investors perceive it as a positive or negative signal when evaluating a company’s future risk. Since true sustainability performance is partly unobservable to investors and disclosure is the primary source of readily assessable information, we conjecture that they base their perceptions more on CEOs’ specific reporting style than on CEOs’ specific sustainability performance style. Overall, (1) we build on the established link between sustainability performance and implied cost of equity (e.g., El Ghoul et al. 2011). Since investors base their perception on available information, we argue that in this relationship, sustainability reporting is essential to reduce information asymmetries and thus moderates the said relationship (2). Based on this illustration we hypothesize that CEO-fixed effects (high/low) moderate the relationship (3). As a result, we expect a three-way moderation between sustainability performance (1), sustainability reporting (2), and CEOs’ style of sustainability reporting (3).
To test our hypotheses, we first construct a measure for sustainability reporting. Michelon et al. (2015) argue that sustainability reporting quality is a multidimensional construct consisting of quantitative as well as content-based dimensions. Hence, we measure the quality of sustainability reporting on an aggregated level with a self-constructed score comprising five equally weighted different sustainability reporting items from the Asset4 database. These items have been identified as being relevant to investors by prior research (e.g., Plumlee et al. 2015; Reimsbach et al. 2018).
For our empirical test, we employ a two-step research design. First, to estimate whether CEOs significantly contribute to the quality and scope of a company’s sustainability reporting, we follow the mover dummy approach outlined in Bertrand and Schoar (2003). We calculate CEO-fixed effects on a sample comprising US companies for all CEOs who became CEO in one of the sample companies within the sample period, left a sample company as CEO, or switched sample companies as CEO in any year during the observation period 2001 to 2019. With this approach, we measure time-invariant fixed effects for each CEO, arguing that a CEO’s values and preferences that influence sustainability reporting style are rather stable over time as the orientation of a CEO towards sustainability is most likely a result of their personality and social values (Kang 2017; Boone et al. 2020). In a second step, to empirically answer whether the specific reporting style attributable to CEOs conveys a signal to investors, we employ the estimated CEO-fixed effects from the first step. By applying a three-way interaction term, we test whether there is a moderating relationship between sustainability performance, sustainability reporting, and CEO-fixed effects as our variables of interest with implied (ex-ante) cost of equity (investors’ perception of company risk) as the dependent variable.
Advertisement
In the first step of our analysis, we provide novel evidence that CEO-fixed effects significantly explain sustainability reporting at the firm level, which supports our first hypothesis. In the second step, we find that CEOs with a high (low) fixed effect on sustainability reporting are associated with an increase (decrease) in the cost of equity related to a marginal increase in sustainability performance, moderated by sustainability reporting. This supports our Hypotheses 2a/2b, underlining the view that capital market participants use CEOs’ fixed-effects on sustainability reporting as an indicator of the motives and CEOs’ social values underlying the corporate engagement in sustainability. Our findings indicate that high CEO-fixed effects (i.e., driving sustainability reporting) are interpreted as self-serving action. Similarly, low CEO-fixed effects (i.e., lowering sustainability reporting) instead are taken as true motives related to shareholder value maximization through corporate sustainability engagement as a business case. Consequently, investors value sustainability activities perceived to be mainly driven by instrumental motives as long as they are assessed to add value for shareholders and do not provide CEOs with the possibility to pursue their own ambitions detached from business objectives.
The contribution of our study is twofold. First, our findings add to the literature on the impact of executives on company-level disclosures. Prior studies indicate that executives have an impact on mandatory rather backward-looking financial disclosures (Levy et al. 2018), as well as voluntary financial disclosures (Bamber et al. 2010; Brochet et al. 2011; Yang 2012; Davis et al. 2015). While voluntary financial disclosures (i.e., conference calls) tend to be short-term in their focus, sustainability reporting is primarily long-term oriented (Dhaliwal et al. 2011). Given that managers follow different time horizons (Brochet et al. 2015), we provide evidence that managers also influence not only voluntary short-term but also long-term disclosure channels. Thus, we provide new evidence, as we show in particular, that their specific style does indeed significantly explain the choice of quality and quantity of voluntary company-level long-term nonfinancial disclosures. By identifying CEOs as drivers of sustainability disclosure, we also add to previous studies that analyze company-specific factors driving sustainability reporting (among many others, Brammer and Pavelin 2006; Clarkson et al. 2008; Cormier and Magnan 2003; Dhaliwal et al. 2011, 2014).
Secondly, we contribute to signaling theory literature (e.g., Connelly et al. 2011) and the literature investigating the relationship between sustainability performance and perceived company risk (El Ghoul et al. 2011). While there are many signals to the market in the sustainability context, such as sustainability and ethics programs, corporate disclosures, trustmarks, or sustainability performance (Zerbini 2017), stakeholders still struggle to evaluate the motives behind such signals as sustainability performance (Ogunfowora et al. 2018). Specifically, by examining the moderating role of CEOs’ company-specific sustainability reporting style on the relationship between sustainability performance and shareholders’ perceived risk as a particular stakeholder group, we contribute to the literature that considers CEOs signal senders vis-à-vis stakeholders in the sustainability context, which has only been backed up by some experimental evidence to date (Ogunfowora et al. 2018). We suggest that investors incorporate publicly available information about CEOs’ impact on company level sustainability reporting into their evaluation of sustainability activities when they assess company risk. We hence add to the literature on the relationship between sustainability performance and risk perception (e.g., El Ghoul et al. 2011) by providing insights into two specific moderators of this relationship, namely sustainability reporting and CEOs’ imprint on sustainability disclosure. In particular, we demonstrate how the interaction of sustainability performance and reporting on the next-period’s cost of equity is moderated by how CEOs shape the sustainability reporting style of the company they currently serve.
Our findings show companies how important the CEO role is for implementing a sustainability strategy, which includes the reporting thereon. Our study may also be of use for CEOs in that it demonstrates that they indeed have an influence on company-level sustainability reporting. If they are aware of this influence, they may also be aware that investors could incorporate these differences as signals in their assessments.
The remainder of this paper is structured as follows: Section 2 reviews the relevant literature and develops our research hypotheses. Section 3 describes our methodology, and Sect. 4 reports our results. Robustness tests are conducted in Sect. 5. Section 6 concludes the paper.
2 Literature review and hypotheses development
2.1 Sustainability performance and cost of equity
A company’s commitment to sustainability may mitigate crisis risks (Coombs and Holladay 2015), increase customer confidence, boost a company’s competitive advantage (Du et al. 2011), and improve organizational processes (Eccles et al. 2014). These benefits contribute to the relationship between sustainability performance and market returns, which has been studied extensively in the context of sustainability performance (e.g., Flammer 2015). Previous research on companies’ commitment to sustainability and how it is evaluated by the market has found divergent results and reported either a positive, negative, or no significant relationship depending on the sample, research design, and setting (Friede et al. 2015; McWilliams and Siegel 2000). These findings also support the notion that the market perception of sustainability performance is moderated by other factors such as the relationship with customers (Schreck 2011).
Corporate sustainability engagement may generate competitive advantages, which in turn translate to lower financing costs (Chava 2014; El Ghoul et al. 2011; Ge and Liu 2015; Goss and Roberts 2011). A beneficial impact, especially on the cost of equity, may take place via two possible channels (El Ghoul et al. 2011). First, enhanced sustainability performance reduces the perceived company risk as it increases the stability of future cash flows. More specifically, in negative incidents, stakeholders sanction the affected companies. Such sanctions range from boycotts to challenging business rights and harm reputation and revenues (Godfrey 2005). As a result, the extent to which a company is penalized varies depending on how stakeholders perceive the company’s intentions (Godfrey 2005). Activities in sustainability build moral capital that protects a company’s reputation and operations when such negative events occur as stakeholders acknowledge such moral capital (Godfrey 2005; Godfrey et al. 2009; Peloza 2006). Consequently, commitment to sustainability creates risk management benefits (i.e., a buffer function in case of adverse events) that are recognized by the capital market (Kim et al. 2021). Similarly, poor sustainability performance and irresponsible behavior regarding sustainability topics result in increased perceived risk by investors and, consequently, increased cost of capital (Chava 2014). The second channel is the reduction of information asymmetries through engagement in sustainability, leading to reductions in agency issues (El Ghoul et al. 2011; Lopatta et al. 2016). Additionally, managers who adopt international frameworks (e.g., the UN Guiding Principles on Business and Human Rights), are more likely to follow ethical and moral standards and need less monitoring (Lopatta et al. 2016), which in turn reduces information asymmetries and cost of equity (Jensen and Meckling 1976).
Dhaliwal et al. (2011) indicate that companies with a strong sustainability performance also have superior reporting on that performance. Hence, disclosure on sustainability performance is essential to convey information to the capital market to increase transparency and reduce information asymmetries (Clarkson et al. 2013). Also, companies with strong sustainability performance have stronger incentives to disclose information on their performance (Richardson and Welker 2001). Both sustainability performance and reporting lower information asymmetries, which increase overall company value and allow companies to receive debt and equity capital at more favorable conditions (Dhaliwal et al. 2011; Ioannou and Serafeim 2017; Michaels and Grüning 2017). In the context of sustainability reporting, the underlying reporting quality of sustainability performance is closely linked to the value relevance of this particular information for investors (Du and Yu 2021). Given the evidence on the relationship between sustainability performance and the documented effects of reporting thereon, it can be reasonably assumed that these interact with each other in a moderating relationship when it comes to investors’ risk perceptions in the capital market, similar to the relationship between sustainability performance and (accounting-based and market-based) financial performance (Schreck 2011).
2.2 Managerial values, preferences, and sustainability reporting
According to Aguilera et al. (2007), managers engage in sustainability activities due to instrumental, relational, and moral motives, which they incorporate into their decision-making process in descending order and by different weighting (i.e., each manager has their own mix of motives with different relevant importance for each motive). While instrumental motives, according to agency theory (Jensen and Meckling 1976), are mostly self-serving and based on maximizing shareholder wealth and related managerial compensation (McWilliams and Siegel 2001), relational motives are based on stakeholder theory and pressure from stakeholders (Clarkson 1995; Freeman 2010). Additionally, managers also have personal and moral incentives to increase company-level sustainability performance as they strive for a meaningful existence, as explained by stewardship theory (Davis et al. 1997).
Moreover, CEOs are known to adopt different management decisions (Bertrand and Schoar 2003; Fee et al. 2013) and to deal with complex situations differently (Hambrick 2007; Hambrick and Mason 1984). These styles vary according to various talent characteristics such as general ability and communication, interpersonal, and execution skills (Bolton et al. 2013; Kaplan et al. 2012). However, these differences in style arise not only due to talent characteristics; they are also the result of inborn predispositions as well as past professional and personal (early) life experiences (Benmelech and Frydman 2015; Bernile et al. 2017; Davidson et al. 2015; Dittmar and Duchin 2016; Malmendier et al. 2011; Schoar and Zuo 2017). Moreover, managerial decisions are based on cognitive biases and personal values (Cyert and March 1963). Most differences in style can be explained by genetically and culturally transmitted preferences and values (Cesarini et al. 2009; Gören 2017). For instance, Grønhøj and Thøgersen (2009) found that social interactions within families influence individuals’ environmental values, concerns, and behaviors, while Alford et al. (2005) found that genetic influences on a person’s behavior shape their political reactions. Hereby, the genetic influences are roughly twice as influential as environmental ones.
Managers may have certain personal and moral motives to correct existing imbalances, especially when it comes to corporate engagement in sustainability and social issues (Logsdon and Wood 2002). Depending on their values, they have multiple unobservable motives to increase sustainability performance that are related to broader interests rather than self-fulfillment (Davis et al. 1997). According to Boone et al. (2020), social values determined by different information-processing affinities help CEOs navigate in their complex decision environments, especially when it comes to engagement in sustainability. They distinguish between other-serving values resulting in intrinsically motivated actions, and self-serving values which result in extrinsically motivated actions such as a personal gain from corporate engagement in sustainability. Consequently, their specific characteristics and values have a significant impact on their overall action on sustainability at the corporate level (Hambrick and Finkelstein 1987; Kang 2017). For instance, Cronqvist and Yu (2017) showed that CEOs who have a daughter shape their company in a more social direction, while Davidson et al. (2019) documented that materialistic CEOs lower firm-level sustainability performance.
Beyond that, CEOs’ motives underlying personal characteristics and values influence corporate transparency and the quality of information disclosed (Bamber et al. 2010; Brochet et al. 2011; Davis et al. 2015). As a result, managers who engage in “off-the-job” behaviors that reflect underlying self-serving values, such as low frugality and legal violations, negatively affect the quality of corporate reporting (Davidson et al. 2015). By analogy, we argue that CEOs influence the reporting based on their underlying motives of sustainability engagement. Thus, to improve their self-image and receive praise, CEOs with self-serving personality traits might use disclosure channels excessively (Marquez-Illescas et al. 2019), in contrast to CEOs without self-serving personality traits who might primarily aim at reducing information asymmetry. On the other hand, CEOs might also have personal incentives to diminish disclosure quality to mask poor sustainability performance, as this might worsen their reputation and career prospects (Cai et al. 2020; Wang et al. 2018). Hence, we expect CEOs’ values and motives concerning sustainability and the reporting thereon to shape how companies publicly disclose information on their sustainability performance. Therefore, we formulate our first hypothesis as follows:
Hypothesis 1
The unobservable values and preferences of a given manager captured with CEO-fixed effects have significant statistical power in explaining company-level sustainability reporting.
2.3 CEOs’ sustainability reporting style and cost of equity
After testing whether managers have an individual imprint on a company’s sustainability reporting through their specific values and preferences, we are interested in whether a CEO’s reporting style alters the relationship between sustainability performance and capital market risk perceptions moderated by the reporting thereon.
According to signaling theory, companies send (positive or negative) signals, thereby revealing private information to the capital market. Shareholders assess a company’s behavior based on incomplete information, caused by uncertainties regarding quality and intention, and update their perceptions based on the additional information they receive (Connelly et al. 2011). Corporate engagement in sustainability is seen as a sign of a company’s quality (Branco and Rodrigues 2006; Zerbini 2017). However, companies have incentives to mimic signals, or even send false signals, that do not reflect a company’s true motives (Connelly et al. 2011). Thus, corporate engagement in sustainability may generate ambiguous signals that could be interpreted by the receiver as either positive or negative (Connelly et al. 2011). As the motives (instrumental, relational, and moral) behind companies’ engagement in sustainability are barely accessible to the market (Ogunfowora et al. 2018), the signals companies send about sustainability are rather ambiguous and often perceived by outsiders as conflicting (Skarmeas and Leonidou 2013). To evaluate a signal sender’s behavior and intention, additional relevant information is required (Kelley and Michela 1980).
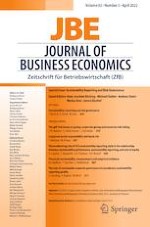
Signals provided by CEOs offer potentially meaningful insights and additional information that affect stakeholders’ perception of a company’s sustainability engagement motives (Ogunfowora et al. 2018). We argue that CEOs’ style of sustainability reporting, driven by their personal motives and values, is an additional signal that market participants use to evaluate the relationship between sustainability performance and sustainability reporting in their perceptions of risk. Figure 1 illustrates the moderating relationship of CEOs’ sustainability reporting style on the relationship of sustainability performance and cost of equity moderated by sustainability reporting.
Fig. 1
The moderating effect of CEOs’ sustainability reporting style and sustainability reporting on the influence of sustainability performance on cost of equity
×
Given this relationship, the unanswered question is how capital market participants evaluate such styles in sustainability reporting. Specifically, we are interested in whether their style is a relevant signal to investors, which we would then expect to moderate the relationship between sustainability performance and sustainability reporting on the cost of equity.
We assume that typical CEOs engage in sustainability due to a mix of instrumental and relational motives and thus provide no meaningful signal with the reporting on these activities. We consider these typical CEOs as the reference group. In addition to these CEOs, CEOs who deviate from this group and base their motives on self- and other-regarding values send a signal to the capital market. Therefore, we distinguish between CEOs who increase the level of reporting, and CEOs who adversely affect the level of sustainability reporting. Since it is difficult to distinguish whether observable actions are motivated by other-serving values to behave altruistically or by self-serving values to enhance the CEOs’ personal self-view (Avolio and Locke 2002; Boone et al. 2020), the signal a CEO transmits to the market by impacting sustainability reporting might be ambiguous. As a result, shareholders may vary in their attribution regarding the true motives of CEOs’ reporting styles.
Observing the signal conveyed by a CEO with driving, company-level sustainability reporting, capital market participants potentially recognize this excessive reporting as stemming from personal motives, far beyond instrumental and relational motives, to maximize shareholder wealth. Alternatively, CEOs may exploit sustainability reporting to distribute information on sustainability performance which enhances their reputation and helps them pursue a personal agenda (Petrenko et al. 2016; Wang et al. 2008). Management research suggests that the relationship of many apparently monotonous positive relationships reach context-specific inflection points after which the relationships often become negative (i.e., follow an inverted U-shape) (Busse et al. 2016; Pierce and Aguinis 2013). This holds particularly true for the relationship between sustainability performance and financial performance (Fujii et al. 2013; Trumpp and Guenther 2017). Specifically, at some point the marginal beneficial impact of an increase in sustainability performance on the performance of the company is significantly below the amount that has to be invested for this purpose (Fujii et al. 2013). Thus, capital market participants may perceive a positive impact of the CEO on sustainability reporting as a signal that the inflection point in this relationship has been reached, or that managerial misconduct is becoming more significant with increased corporate social engagement (Wang et al. 2008). They may then infer that CEOs pursue sustainability activities mainly grounded on instrumental motives. However, in the process they do not act in the interest of shareholder value maximization, as CEOs with self-serving values (i.e., materialism) tend to invest in activities that benefit them personally (Davidson et al. 2019). This, in turn, results in an increase in the cost of equity in response to a marginal increase in sustainability performance at a given level of sustainability reporting. Therefore, we formulate our second Hypothesis 2a as follows:
Hypothesis 2a
If the CEO increases company-level sustainability reporting, there is a positive relationship between sustainability performance and costs of equity, moderated by sustainability reporting.
Similarly, social values and preferences behind a CEO’s decision to reduce company-level sustainability reporting are not observable to capital market participants, who may view such a CEO as investing in sustainability only for truly instrumental and relational motives unaffected by personal agendas (i.e., attribute this as a positive signal). Hence, these investments in sustainability activities based on instrumental motives could be viewed as grounded in a genuine business case (Carroll and Shabana 2010), which means that CEOs in this case are also conducting themselves morally. Hafenbrädl and Waegner (2021) document that signaling sustainability commitment for instrumental reasons and highlighting the sustainability business case is a superior impression management strategy, since this reduces perceptions of hypocritical behavior. Moreover, the capital market may perceive a decrease in sustainability reporting quality induced by a specific CEO as a signal that there is no overinvestment driven by a CEO’s motives for attention (Petrenko et al. 2016; Wang et al. 2008), resulting in a lower perceived risk and accordingly lower cost of equity.
However, one could also argue that other stakeholders (e.g., customers) also perceive only truly instrumental motives for sustainability as negative. This could be penalized by reduced consumer demand (Ellen et al. 2006; Skarmeas and Leonidou 2013), resulting in lower future cash flows attributed by shareholders as a negative signal. Moreover, a decrease in sustainability reporting related to a CEO could be perceived as a signal for self-serving values and motives. Managers driven by self-serving values such as materialism show lower corporate engagement in sustainability (Davidson et al. 2019), which in turn could also affect reporting thereon. Thus, for CEOs who negatively impact company-level sustainability reporting, we formulate our second Hypothesis 2b as follows:
Hypothesis 2b
If the CEO reduces company-level sustainability reporting, there is a negative relationship between sustainability performance and costs of equity, moderated by sustainability reporting.
3 Sample and methodology
3.1 Sample selection
Sustainability reporting data are taken for all available companies from the US from the Asset4 section of DataStream, but excluding companies from the financial or utilities industries (SIC codes 4900–4999 and 6000–6999).4 Accounting data are from Compustat North America, return data from CRSP, CEO data from ExecuComp, and analyst and management forecast data are obtained via I/B/E/S. Board characteristics data are taken from Asset4 and BoardEx. We use all company-years from the Asset4 database for which our constructed measure of sustainability reporting is available in a company-year.5 Our initial sample size consists of 14181 company-year observations spanning the period 2001 to 2019. Due to missing data, we end up with 7149 company-year observations comprising 987 distinct companies for the CEO-fixed effects estimation model. The sample for the cost of equity and CEO-fixed effects model is reduced to 1510 observations and 264 distinct companies. We present the sample selection procedure in Table 1.6
Table 1
Summary of the sample selection procedure
Reduction
Sample size
(1) Asset4 sample excluding financial and utilities industries
14181
(2) No sustainability performance data
2007
12174
(3) Missing CEO data
2910
9264
(4) Missing Compustat accounting data
637
8627
(5) No CRSP return data
875
7752
(6) No cost of equity data
135
7617
(7) Missing data for board characteristics
468
7149
(8) CEO-fixed effects estimation model
7149
(9) Less observations with no CEO-fixed effects (companies without CEO turnover)
4087
3062
(10) Missing I/B/E/S analyst forecasts
1377
1685
(11) Missing values due to using lead variables
175
1510
(12) Cost of equity and CEO-fixed effects model
1510
Bold indicates the total number of firm-year observations included in the first (second) step of the analysis
3.2 Measuring the quality of sustainability reporting
Previous research often considers only standalone sustainability reports (Dhaliwal et al. 2011, 2014) when assessing the impact of sustainability reporting on investors (e.g., by looking at cost of equity). However, recent research findings indicate that more than the sustainability report itself matters to investors; they also look at whether these reports incorporate non-financial and financial disclosures and whether they comply with international guidelines such as the GRI guidelines (see in detail Reimsbach et al. 2018). We therefore use a self-constructed five-item score to measure the overall quality of sustainability reporting based on the reporting elements that previous literature has identified as relevant to investors. These elements capture both the quantity as well as the content of these reports, with Michelon et al. (2015) arguing that the quality of sustainability reports is a multidimensional construct consisting of both quantitative and content-based subdimensions. Table 2 shows the five sustainability reporting elements, of which at least three have to be available,7 that constitute our sustainability reporting score (SR) and indicates on which studies we base those elements.8
Table 2
Sustainability reporting score
Item
Name
Description
Related studies
SRS1
Separate Sustainability Report (Section)
Value 1 if the company publishes a separate sustainability report or a minimum five-page section on sustainability in its annual report; 0 otherwise.
Value 1 if the company has published a sustainability report in accordance with the GRI guidelines; 0 otherwise.
Clarkson et al. (2008); Skouloudis et al. (2010); Clarkson et al. (2013); Plumlee et al. (2015); Kaspereit and Lopatta (2016)
SRS3
Integrated MD&A
Value 1 if the company explicitly integrates financial and extra-financial factors in its management discussion and analysis (MD&A) section in the annual report; 0 otherwise.
Calculated as the sum of all SRS item values, divided by the number of all available SRS items. Thus, SR ranges between 0 and 1. A minimum of three out of five items is required for SR.
3.3 CEOs’ style of sustainability reporting
Many existing studies on managerial style effects rely on the method developed by Abowd et al. (1999) (hereafter, the AKM method). However, especially in the case of CEO-firm matched samples, the AKM method is methodologically problematic, as the mover/non-mover ratio is typically quite low. In our sample, the ratio is less than 1%.9 A low mover/non-mover ratio might cause a severe limited mobility bias, i.e., a downward bias in the estimated correlations between company and CEO-fixed effects (Abowd et al. 2003; Andrews et al. 2008). This is not surprising, given that being appointed CEO is presumably the pinnacle of a manager’s career, making it likely they will retire after their time as CEO (Cronqvist and Yu 2017). Hence, we refrain from using the AKM method as our main method to estimate the CEO-fixed effects and instead follow the mover dummy approach of Bertrand and Schoar (2003). For each moving (i.e., a future company-changing or departing) CEO, the mover dummy approach estimates a fixed effect after controlling for company-specific time-variant characteristics as well as firm- and time-fixed effects. Given the restricted size of our sample, we modify their methodology and require a CEO turnover event for each company. Therefore, and due to the small number of switching CEOs within the sample, the estimated fixed effects rather capture CEO style conditional on a particular company and might include an underlying company-specific time trend related to sustainability reporting.10 Nevertheless, to increase confidence in our results, we also employ the AKM method as a validity analysis and still find a significant influence of the CEO on a firm’s level of sustainability reporting quality and scope (results tabulated in the ESM Appendix 4 Table 1).
To test our first hypothesis and measure the explanatory power of individual CEOs’ style based on social values on a firm’s sustainability reporting quality,11 we benchmark the baseline Model (1a) without CEO-fixed effects model against Model (1b), which includes CEO-fixed effects estimated with the mover dummy approach, apply a firm-cluster robust version of the Vuong test (Vuong 1989), and hold the sample constant. The model builds on the logistic model of Dhaliwal et al. (2011):
where SR measures the quality of sustainability reporting as defined in ESM Appendix 1. We use the next period’s value of sustainability reporting, as reporting behavior presumably reacts at a delay to environmental or firm-specific changes. As we analyze annual firm data, and various sustainability reporting items are disclosed at different timepoints throughout the year, SR is calculated as the average value of the monthly SR for each firm at the end of June of each year.12
We discuss our control variables in detail in ESM Appendix 2, and briefly outline them in this section. Our starting point is the control variables introduced by Dhaliwal et al. (2011). For instance, we control for sustainability performance (SP) (Dye 1985). Further, we include company-specific controls identified by prior literature to be associated with voluntary disclosure such as size (SIZE) (Prado-Lorenzo et al. 2009), profitability (ROA) (Dhaliwal et al. 2011), company’s share liquidity (LIQUIDITY) (Clarkson et al. 2008), net issuance of long-term debt and shares in a period (FIN), earnings quality (EM) (Dhaliwal et al. 2011), issuance of management forecasts (MF) (Dhaliwal et al. 2014), leverage (LEV) (Prado-Lorenzo et al. 2009), market-to-book ratio (MTB), cost of equity (COEC) (Dhaliwal et al. 2014),13 foreign income (GLOBAL) (Dhaliwal et al. 2011) and market competition (HHI) (Dhaliwal et al. 2011). Additionally, we control for time-variant CEO characteristics such as CEO’s tenure (CEOTEN), age (CEOAGE), and also their prior experience as a CFO (CFOEXP) in the company they currently serve (Bochkay et al. 2019; Matsunaga and Yeung 2008). Further, we add whether a company receives external assurance on its sustainability reporting (EXTERNALSSURANCE) (Steinmeier and Stich 2019), and whether a company has signed the United Nations Global Compact (GLOBALCOMPACT) (Cetindamar 2007).
Further, we control for governance measures regarding the CEO and board composition. Thus, we include a proxy for CEO centricity (CEO_POWER) following Bauer et al. (2021), and CEO duality (CEO_DCHAIR) (Song and Wan 2019). Moreover, we add board characteristics such as the percentage of outside directors monitoring the CEO (BOARD_INDEPENDENT) (Jo and Harjoto 2011), the sustainability expertise and voice of a chief sustainability officer (CSO) (Fu et al. 2020; Gallego-Álvarez and Pucheta-Martínez 2020), and BOARD_GENDER_DIV, the female share on the board (Adams and Ferreira 2009; Melero 2011). Additionally, we control for compensation incentives such as whether compensation is tied to a sustainability target (BOARD_CSR_COMP) (Tsang et al. 2021), and the maximum time horizon in years for the director’s targets to receive full compensation (BOARD_LT_COMP) (Mahoney and Thorne 2005). Lastly, we include time- and firm-fixed effects.14 We define all variables in Table 3. Again, for a more detailed discussion of our control variables, please see ESM Appendix 2.
Table 3
Variables description
BASPREAD = Bid/ask spread calculated as the yearly average of the difference between ask and bid price, scaled by the ask price
BETA = Annual market model beta using daily return data of the common shares and the value-weighted daily return of all US companies
BOARD CSR_COMP = Indicator variable that equals 1 if the senior executives compensation is linked to sustainability targets. If a company changes their compensation scheme within a year we weight the dummy according to the remaining months of the financial year
BOARD LT_COMP = The maximum time horizon in years of the board member’s targets to reach full compensation
GENDER_DIV = Percentage of females on the board
BOARD
BOARD INDEPENDENT = Percentage of independent board members as reported by the company
CEOFE = CEO-fixed effects sorted into tercile ranks according to their yearly across-sample rank. The fixed effects are estimated in Model (1b) using the mover dummy approach
CEOAGE = CEO age defined as the natural logarithm plus one of the CEO’s age
CEOTEN = The tenure of the CEO is calculated as the difference in years between the current year and the date on which the CEO started in the current position
CEO_DCHAIR = Indicator variable that equals 1 if the CEO simultaneously chairs the board or the the chairman of the board has been the CEO of the company
CFOEXP = Indicator variable that equals 1 if an individual served as CFO in the same company before taking office as CEO; 0 otherwise
COEC = Cost of equity following the approach outlined in Hou et al. (2012). We take the average value of all available cost of equity values both using actual earnings numbers (model-based forecasts) as well as analyst’s earnings forecast estimated with five different cost of equity measures:
Claus and Thomas (2001), Gebhardt et al. (2001), Gordon and Gordon (1997), MPEG/Easton (2004), and Ohlson and Juettner-Nauroth (2005)
CEO_POWER = Defined as the total CEO pay, divided by the sum of the total pay of the top five executives (Bauer et al. 2021)
CSO = Indicator variable that equals 1 if the company has a chief sustainability officer on their board; 0 otherwise
DISP = Spread of analyst forecasts measured as the logarithm of the standard deviation of analysts’ earnings per share forecast scaled by the consensus forecast
EXTERNAL ASSURANCE = Indicator variable that equals 1 if the company has commissioned a third party to provide external assurance for its sustainability report; 0 otherwise
EM = Earnings management as the absolute value of abnormal accruals estimated with the modified Jones model, following Dechow et al. (1995)
FIN = Variable that measures a firms’ financing activities in a year. Calculated as sale of common and preferred shares, reduced by repurchases of common and preferred shares, plus long-term debt issuance minus long-term debt reduction, all scaled by lagged total assets at the beginning of a year
GLOBAL = Indicator variable equaling 1 if a company reports foreign income; 0 otherwise
GLOBAL COMPACT = Indicator variable that equals 1 if the company has signed the UN Global Compact; 0 otherwise
HHI = Herfindahl-Hirschmann Index calculated for each SIC2 industry to proxy for competition intensity in an industry. It is calculated as the sum of the squared shares of sales of the 50 firms with the largest sales within a SIC2 industry. In case there are fewer than 50 firms in an industry in a year, all squared sales-shares are used
LEV = Ratio between total debt and total assets at year-end
LIQUIDITY = Liquidity of a company defined as the ratio between the number of a firms’ shares traded during the year and the number of total shares of a company outstanding at year-end
LTGROWTH = Long-term growth rate calculated as the difference between two-year and one-year ahead I/B/E/S earnings per share according to analyst consensus forecast
MFCAST = Indicator variable that equals 1 if a firm has issued at least one management forecast in year t; 0 otherwise
MTB = Ratio of market value of common equity divided by the book value of common
equity at year-end
ROA = Income before extraordinary items scaled by lagged total assets at a year’s beginning
SIZE = Defined as the natural logarithm of a firm’s equity market capitalization at year-end
SR = Annual average score of monthly measured quality of sustainability reporting. The score comprises five elements that capture sustainability reporting: SR Report (Section), GRI Report Guidelines, Integrated MD&A, Stakeholder Engagement, Global Activities. Each item is an indicator variable that equals 1 if the item is reported/given for a company and 0 otherwise. The score is calculated as the average of all item values for which at least three items need to be available
SP = Asset4 measure that captures the sustainability performance of a firm comprising around 150 sustainability performance indicators based on approximately 375 data points in the fields of environmental, social, and corporate governance performance
VOL = Annual standard deviation of the share’s (midpoint) price
This table defines all variables used in the main models. All continuous variables are winsorized at the 1st and 99th percentile
3.4 CEO-fixed effects and future cost of equity
In our design choice to test Hypothesis 2a/2b, we build on the research design of El Ghoul et al. (2011). Since sustainability performance and cost of equity may be bilaterally interrelated,15 we follow Dhaliwal et al. (2011) and lead the dependent variable by one period, since the motivating effect of the future (anticipated) cost of equity on sustainability performance and reporting should be weaker than the motivating effect of the current cost of equity. We estimate the corresponding Model (2a) as follows:
To verify whether the portion of the level of sustainability reporting attributable to a CEO is perceived by investors as a positive (negative) signal regarding the underlying motives of an increase in sustainability performance, we estimate the relationship of the current period’s sustainability performance and related CEO-fixed effects on the next period’s level of cost of equity (COEC). We interact SP with SR (Dhaliwal et al. 2011), as the relationship between sustainability performance and cost of equity seems to depend on a company’s sustainability reporting.
CEOFE captures the CEO-fixed effects estimated applying Model (1b). To reduce measurement noise and increase the model’s explanatory power, we group the CEO-fixed effects into terciles (quartiles, quintiles as robustness tests with similar results).16 Consequently, CEOFE captures the CEO-fixed effects from Model (1b) transformed to their across-sample tercile rank value. This data transformation also allows us to compare the relationship of sustainability performance on cost of equity for companies that employ a CEO with a high CEO-fixed effect on sustainability reporting with firms employing a CEO with a low CEO-fixed effect on sustainability reporting. Here, the bottom (top) tercile group consists of CEOs equipped with a high (low) CEO-fixed effect on sustainability reporting. As we predict CEOs to affect the relationship between sustainability performance and cost of equity, we interact SP with CEOFE.
We assume that CEO-fixed effects on sustainability reporting especially matter to investors when they assess companies’ sustainability reporting. Hence, we anticipate the coefficient of the separate variable CEOFE to be statistically insignificant. However, due to econometric concerns (outlined in detail in Brambor et al. (2006)), we refrain from excluding CEOFE as a separate variable.17 For the same reasons, we interact all three sustainability-related variables (CEOFE, SP, and SR), resulting in seven interaction term elements. We expect the association between sustainability performance and cost of equity to be altered by CEOs with a high (low) CEO-fixed effect on sustainability reporting. For CEOs with a low CEO-fixed effect on sustainability reporting, we expect a negative association. Considering only CEOs with a high CEO-fixed effect on sustainability reporting, we foresee a positive relationship.18
Besides these sustainability-related variables of interest, we employ further control variables based on El Ghoul et al. (2011) as cost of equity is affected by several company-specific factors such as information asymmetries (BASPREAD) and stock return volatility (VOL) (Gebhardt et al. 2001). We further control for size (SIZE), market-to-book ratio (MTB), and leverage (LEVERAGE) as they influence cost of equity (Fama and French 1992). Following El Ghoul et al. (2011), we use the market-model beta (BETA) to control for whether a firm’s share is more volatile than the market. Moreover, there is evidence that cost of equity is affected by a firm’s expected long-term growth rate (Gebhardt et al. 2001) and analyst dispersion (Dhaliwal et al. 2005; Gebhardt et al. 2001). Hence, we include the long-term growth rate (LTGROWTH) and analyst dispersion (DISP) (El Ghoul et al. 2011) and again include firm- and time-fixed effects. All variables are defined in Table 3.
4 Main results
4.1 Descriptive statistics
Table 4, Panel A displays univariate variable-specific statistics for the variables used in Models (1a) and (1b), and Panel B does the same for Model (2). In our sample for the CEO-fixed effects estimation, the average sustainability reporting score SR equals 0.283. All other variables are in line with previous literature except COEC, where the average value is slightly below the cost of equity found in other studies (Dhaliwal et al. 2011; Hail and Leuz 2006).19 Comparing Panels A and B, the samples are largely comparable regarding financial characteristics such as LEV, MTB, and COEC. We also find similar values across both panels for non-financial characteristics sustainability performance SP and sustainability reporting quality SR. Table 5 shows the Pearson correlations.
Table 4
Descriptive statistics of regression variables
Variable
N
Mean
S. Dev
25%
Median
75%
Panel A: CEO-fixed effects estimation model
SRi,t
7149
0.2826
0.3387
0.0000
0.0000
0.6000
SPi,t
7149
0.4138
0.1912
0.2627
0.3793
0.5488
SIZEi,t
7149
8.6643
1.4074
7.6845
8.5189
9.5495
LIQUIDITYi,t
7149
2.5424
1.6420
1.4258
2.0825
3.1322
FINi,t
7149
− 0.0008
0.1381
− 0.0607
− 0.0174
0.0172
ROAi,t
7149
0.0745
0.0776
0.0349
0.0699
0.1117
HHIi,t
7149
0.0808
0.0620
0.0471
0.0597
0.0830
EMi,t
7149
0.0003
0.0731
− 0.0339
− 0.0008
0.0312
MFCASTi,t
7149
0.9203
0.2709
1.0000
1.0000
1.0000
LEVi,t
7149
0.2268
0.1612
0.1009
0.2209
0.3312
MTBi,t
7149
4.5542
5.6014
1.9656
3.0495
4.8734
COECi,t
7149
0.0564
0.0324
0.0356
0.0502
0.0693
GLOBALi,t
7149
1.6836
0.9151
1.0986
1.7918
2.3979
CEOTENi,k,t
7149
4.0505
0.1177
3.9703
4.0604
4.1271
CEOAGEk,t
7149
0.7573
0.4287
1.0000
1.0000
1.0000
CFOEXPi,k
7149
0.0817
0.2739
0.0000
0.0000
0.0000
GLOBALCOMPACTi,t
7149
0.0769
0.2665
0.0000
0.0000
0.0000
EXTERNALASSURANCEi,t
7149
0.1077
0.3100
0.0000
0.0000
0.0000
CEO_POWERi,k,t
7149
0.3214
0.0812
0.2851
0.3229
0.3583
CSOi,t
7149
0.0460
0.2095
0.0000
0.0000
0.0000
CEO_DCHAIRi,t
7149
0.6819
0.4543
0.0000
1.0000
1.0000
BOARD_CSR_COMPi,t
7149
0.2045
0.3752
0.0000
0.0000
0.0833
BOARD_LT_COMPi,t
7149
1.1204
1.3921
0.0000
1.0000
2.0000
BOARD_GENDER_DIVi,t
7149
16.5102
10.3261
10.0000
15.5550
22.2550
BOARD_INDEPENDENTi,t
7149
80.1161
12.1647
75.0000
83.3300
88.8900
Panel B: Cost of equity and CEO-fixed effects model
COECi,t
1510
0.058
0.027
0.039
0.053
0.073
SRi,t
1510
0.276
0.332
0.000
0.000
0.556
CEOFEi,t
1510
1.964
0.855
1.000
2.000
3.000
BASPREADi,t
1510
0.001
0.001
0.000
0.001
0.001
VOLi,t
1510
6.073
5.552
2.663
4.428
7.165
SPi,t
1510
0.429
0.191
0.275
0.409
0.565
SIZEi,t
1510
9.127
1.274
8.232
9.009
9.802
BETAi,t
1510
1.091
0.382
0.836
1.067
1.339
LEVi,t
1510
0.209
0.149
0.095
0.207
0.295
MTBi,t
1510
4.244
4.098
2.170
3.280
4.883
LTGROWTHi,t
1510
1.094
1.836
0.151
0.761
1.647
DISPi,t
1510
− 3.862
1.014
− 4.575
− 3.948
− 3.263
This table shows descriptive statistics for all variables used in the CEO-fixed effects estimation model (Panel A) as well as in the cost of equity and CEO-fixed effects model (Panel B). All continuous variables are winsorized at the 1st and 99th percentile. All variables are as defined in Table 3
Table 5
Pearson correlation CEO-fixed effects estimation model
Panel A
[1]
[2]
[3]
[4]
[5]
[6]
[7]
[8]
[9]
[10]
[11]
[12]
SRi,t+1
[1]
SPi,t
[2]
0.750
SIZEi,t
[3]
0.515
0.545
LIQUIDITYi,t
[4]
− 0.0550
− 0.063
− 0.160
FINi,t
[5]
− 0.046
− 0.091
− 0.090
− 0.019
ROAi,t
[6]
0.042
0.058
0.249
− 0.036
− 0.193
HHIi,t
[7]
− 0.034
0.010
− 0.033
0.117
− 0.079
0.021
EMi,t
[8]
− 0.016
− 0.014
− 0.001
0.010
0.105
0.100
− 0.010
MFCASTi,t
[9]
0.119
0.170
0.137
0.050
− 0.083
0.018
0.009
− 0.041
LEVi,t
[10]]
0.124
0.089
0.054
− 0.047
0.235
− 0.249
0.000
− 0.003
0.038
MTBi,t
[11]
0.038
0.035
0.171
− 0.044
− 0.049
0.220
− 0.036
0.003
− 0.033
0.207
COECi,t
[12]
0.077
0.025
− 0.107
0.204
0.010
− 0.133
0.061
− 0.032
− 0.006
0.128
− 0.187
GLOBALi,t
[13]
0.162
0.170
0.159
− 0.065
− 0.024
− 0.043
− 0.235
− 0.016
0.084
0.019
0.001
− 0.060
CEOTENi,k,t
[14]
− 0.089
− 0.073
− 0.057
− 0.001
0.011
0.091
− 0.006
0.039
− 0.039
− 0.098
0.016
− 0.112
CEOAGEk,t
[15]
0.023
0.019
0.022
− 0.072
0.007
0.027
0.003
0.005
− 0.030
0.009
− 0.027
− 0.001
CFOEXPi,k
[16]
0.051
0.047
− 0.040
0.012
0.010
− 0.047
0.045
0.012
− 0.031
0.087
0.029
0.047
GPACTi,t
[17]
0.365
0.375
0.267
− 0.071
− 0.029
0.016
− 0.057
0.002
0.058
0.013
0.016
0.005
ASSUREi,t
[18]
0.497
0.481
0.381
− 0.103
− 0.009
0.026
− 0.045
− 0.012
0.064
0.069
0.057
0.001
CEOPi,t
[19]
− 0.081
− 0.125
− 0.126
− 0.061
0.032
− 0.020
− 0.053
0.015
0.027
0.056
− 0.013
0.036
CSOi,t
[20]
0.246
0.242
0.214
− 0.048
− 0.016
0.041
0.054
0.016
0.040
0.029
0.035
0.004
CDCHi,t
[21]
0.041
0.005
0.136
− 0.063
− 0.052
0.076
0.047
− 0.026
0.023
− 0.022
0.005
0.002
BCSRCi,t
[22]
0.312
0.357
0.232
0.008
− 0.018
− 0.026
− 0.028
− 0.009
0.073
0.073
− 0.049
0.094
BLTCi,t
[23]
0.049
0.127
− 0.004
0.044
0.008
0.032
− 0.069
0.032
0.022
− 0.025
0.029
− 0.096
BGDIVi,t
[24]
0.283
0.378
0.187
− 0.060
− 0.074
0.005
0.056
− 0.025
0.078
0.059
0.079
− 0.033
BINDi,t
[25]
0.244
0.333
0.099
0.038
− 0.029
− 0.004
− 0.064
− 0.020
0.119
0.060
0.029
− 0.005
Panel A
[13]
[14]
[15]
[16]
[17]
[18]
[19]
[20]
[21]
[22]
[23]
[24]
SRi,t+1
SPi,t
SIZEi,t
LIQUIDITYi,t
FINi,t
ROAi,t
HHIi,t
EMi,t
MFCASTi,t
LEVi,t
MTBi,t
COECi,t
GLOBALi,t
CEOTENi,k,t
− 0.077
CEOAGEk,t
− 0.041
0.386
CFOEXPi,k
− 0.012
− 0.151
− 0.084
GPACTi,t
0.114
− 0.059
− 0.011
0.017
ASSUREi,t
0.100
− 0.047
0.029
0.046
0.365
CEOPi,t
− 0.022
0.028
0.024
− 0.011
− 0.071
− 0.057
CSOi,t
0.042
− 0.026
0.033
0.090
0.162
0.219
− 0.062
CDCHi,t
− 0.027
0.114
0.116
− 0.051
0.032
0.024
0.018
0.038
BCSRCi,t
0.077
− 0.024
0.028
0.028
0.161
0.233
− 0.024
0.121
0.044
BLTCi,t
0.005
0.046
0.017
0.016
0.021
0.042
− 0.022
0.022
− − 0.029
0.022
BGDIVi,t
0.057
− 0.080
0.045
0.083
0.157
0.171
− 0.078
0.106
0.016
0.081
0.005
BINDi,t
0.127
− 0.018
0.005
0.018
0.098
0.127
0.034
0.030
− 0.033
0.165
0.015
0.200
Panel B
[1]
[2]
[3]
[4]
[5]
[6]
[7]
[8]
[9]
[10]
[11]
COECi,t+1
[1]
SRi,t
[2]
0.069
CEOFEi,t
[3]
0.024
0.212
BASPi,t
[4]
0.087
− 0.226
− 0.018
VOLi,t
[5]
0.049
0.007
− 0.063
− 0.075
SPi,t
[6]
− 0.047
0.769
0.112
− 0.272
− 0.030
SIZEi,t
[7]
− 0.082
0.455
0.031
− 0.185
0.072
0.549
BETAi,t
[8]
0.080
− 0.121
0.057
− 0.097
0.162
− 0.187
− 0.237
LEVi,t
[9]
0.116
0.117
− 0.020
0.076
− 0.088
0.109
0.030
− 0.157
MTBi,t
[10]
− 0.172
0.006
− 0.021
0.016
0.068
0.063
0.196
− 0.169
0.187
LTGi,t
[11]
0.061
0.006
− 0.074
− 0.031
0.229
0.007
0.077
− 0.009
0.030
0.015
DISPi,t
[12]
0.219
− 0.001
0.029
0.132
0.002
− 0.117
− 0.197
0.391
0.015
− 0.177
− 0.041
All continuous variables are winsorized at the 1st and 99th percentile. Bold indicates pairwise Pearson correlation at the 10% significance level. All variables are as defined in Table 3. For the sake of presentation, we abbreviate in this Table GLOBALCOMPACT as GPACT and EXTERNALASSURANCE as ASSURE, CEO_POWER as CEOP, CEO_DCHAIR as CDCH, BOARD_CSR_COMP as BCSRC, BOARD_LT_COMP as BLTC, BOARD_GENDER_DIV as BGDIV, BOARD_INDEPENDENT as BIND, BASPREAD as BASP, LTGROWTH as LTG. Panel A shows correlation for the CEO-fixed effects estimation model, whereas Panel B shows correlation for the cost of equity and CEO-fixed effects model
We assume CEOs to significantly influence a firm’s sustainability reporting beyond firm-specific and time-fixed effects. To test this, we benchmark Model (1b) with CEO-fixed effects against Model (1a) without CEO-fixed effects. Table 6 reports the results.
Panel A presents the regression results for Model (1a) without CEO-fixed effects (Column 1) and Model (1b) with CEO-fixed effects (Column 2). All variables are as defined in Table 3. Panel B shows the test statistics for the Vuong test using firm-clustered standard errors with H0: Model (1a) and Model (1b) are equally close to the true specification and H1: Model (1b) is closer to the true specification than Model (1a). Asterisks indicate significance levels with: ***p < 0.01, **p < 0.05, and *p < 0.1. Standard errors are reported in parentheses
Models (1a) and (1b) provide quite similar results. All significant coefficients have the same direction. As expected, sustainability reporting quality is motivated by good sustainability performance, high visibility, and stronger pressure (firm size). The higher adjusted R-squared of Model (1b) compared to Model (1a) (61.5% vs. 49.3%) shows a considerable explanatory power of CEO-fixed effects. Looking at the individual CEO level, we estimate 681 distinct CEO-fixed effects.
To test for the overall significance of CEO-fixed effects in explaining sustainability disclosures at the firm level, we apply the Vuong test for (un)equal explanatory power between two distinct models following the approach for nested models as outlined in Wooldridge (2011) and use firm-clustered standard errors to receive firm cluster-robust Vuong test statistics. According to the test statistics shown in Panel B, Model (1b) with CEO-fixed effects has higher explanatory power than Model (1a) without CEO-fixed effects. The adjusted R-squared equals 61.5% in the model with CEO-fixed effects compared to 49.3% in the model without. The two-sided Vuong test for a non-zero difference of the two models’ explanatory power is significant at the 1% level. This finding supports our first hypothesis that CEOs’ sustainability reporting style has significant explanatory power in explaining firm-level differences in sustainability reporting.20
4.3 CEO-fixed effects and future cost of equity
Next, we test the relationship between the CEO-fixed effects, sustainability performance, and sustainability reporting on the next period’s levels of cost of equity. Because we employ moderating variables and self-constructed score-variables, we focus on interpreting the direction of the relationships rather than their magnitudes (Hartmann and Moers 1999). As we employ interaction terms including two continuous variables, the overall magnitude of the relationship of sustainability performance and the significance level thereof depend on the concrete values of sustainability reporting and the CEO-fixed effect tercile. Whether or not the overall relationship remains significant may depend on these values.21 Beyond displaying the classic results table, we hence analyze the interaction relationships graphically to show the exact significance intervals for all variables that constitute the interaction terms. With only the result table, we would not be able to provide significance intervals for marginal relationships of the interaction term elements (e.g., sustainability performance) as the significance of the marginal relationships is a joint function not only of its coefficient estimate and variance, but also of the other coefficients estimates (SP, SP*SR, SP*CEOFE, SP*SR*CEOFE), variances, and covariances thereof (Aiken el al. 1996). In the case of negative covariances between the coefficients’ estimates, insignificant constitutive interaction terms can still result in significance ranges for the interaction term elements (Brambor et al. 2006).22
Figure 2 displays the marginal relationship of sustainability performance on the next period’s levels of cost of equity (x-axis) depending on the levels of sustainability reporting (y-axis) and the respective CEO-fixed effect tercile rank. The figure runs from the smallest (0) to the largest (1) possible sustainability reporting score. The dashed (dotted, solid) line presents the relationship between sustainability reporting and cost of equity (“marginal effect”) depending on sustainability reporting levels for companies having a CEO in the bottom (middle, top) fixed-effect tercile. Significances are indicated by means of bold lines above the respective line. Thus, for each tercile, the graphic shows for which levels of sustainability reporting the marginal effect of sustainability performance on the next period’s cost of equity is significant.
Fig. 2
Marginal effect of SP on COEC depending on SR and CEO-fixed effects. This figure shows the marginal effect of sustainability performance (SP) on next period’s cost of equity (COEC) depending on CEO-fixed effects (CEOFE) as well as sustainability reporting (SR). The dashed (dotted, full) lines indicate the marginal effect of sustainability performance on next period’s cost of equity depending on sustainability reporting levels for firms with a CEO from the bottom (middle, top) CEO-fixed effect tercile. Values of sustainability reporting levels and CEO-fixed effect terciles for which we find a significant marginal effect of sustainability performance on next period’s cost of equity at the 10% significance level are indicated with a bold line positioned above the respective variables’ value combinations
×
With regard to Hypothesis 2a, we discuss the signal CEOs convey which are appointed to the top tercile (i.e., attributed to having a high CEO-fixed effect). In this case, we find a significant positive relationship between a marginal increase in sustainability performance and the next period’s cost of equity for levels of sustainability below a certain level of sustainability reporting (SR < 0.57, solid line in Fig. 2). This supports Hypothesis 2a, which suggests that a positive impact on sustainability reporting by the CEO may be interpreted as a negative signal by the capital market when evaluating the value of a marginal increase in sustainability performance. Thus, the results suggest that the capital market tends to evaluate this investment decision as mainly dominated by instrumental motives beyond shareholder value maximization, so purely self-serving for the CEO and shareholder value decreasing. Alternatively, the market could interpret the CEO-driven increase in sustainability reporting as a negative signal, because the market participants struggle to properly interpret this information, as the overall level of reporting is below a certain required threshold.
This is also in line with a limitation of our analysis, namely that we estimate fixed effects conditional upon a particular company (e.g., CEO (k) for company (a) vs. CEO (l) for company (a)). However, we concede that due to our limitations in methodology, the estimated CEO-fixed effect also transmits a signal to the capital market that might be related to a company-specific time trend with respect to sustainability reporting.23
For the CEOs in the bottom tercile (i.e., attributed to have a low CEO-fixed effect), we document a negative relationship between an increase in sustainability performance and the next period’s level of cost of equity for sustainability reporting above a certain level (SR > 0.25, dashed line in Fig. 2). This provides initial evidence for Hypothesis 2b that the market interprets this as a positive signal, suggesting that shareholders perceive investments in sustainability activities based on instrumental motives to maximize shareholder value and thus behaving morally in their interest.
That this relationship is observable once a certain threshold of SR is reached is consistent with market participants who can only estimate and value investments in sustainability if the information on this performance is already reported adequately. For the lower and upper terciles, we find comparatively large significance intervals, while the middle tercile (reference group) shows only a fairly small significance interval for CEOs. We argue that CEOs in the middle tercile do not send a strong signal, as their reporting style does not largely differ from that of the company-level baseline. In the interest of clarity, we also report the average coefficients as a results table in Table 7. The first column shows the results using tercile ranks of the CEO-fixed effects, the second (third) column shows the corresponding results with qualitatively similar results for our variables of interest compared to the first regression, now using quartile (quintile) rank indicator variables instead. The overall model fit is similar in all three specifications.
Table 7
Cost of equity and CEO-fixed effects
Dependent variable: COECi,t+1
(1)
(2)
(3)
VARIABLES
CEOFEi,t
− 0.004 (0.004)
− 0.002 (0.002)
− 0.000 (0.002)
SRi,t
0.064** (0.028)
0.047* (0.024)
0.054** (0.025)
SPi,t
− 0.015 (0.020)
− 0.006 (0.017)
0.001 (0.016)
CEOFEi,t * SRi,t
− 0.020* (0.011)
− 0.010 (0.008)
− 0.011* (0.006)
CEOFEi,t * SPi,t
0.016 (0.010)
0.008 (0.006)
0.004 (0.005)
SPi,t * SRi,t
− 0.089* (0.048)
− 0.064 (0.046)
− 0.080* (0.044)
CEOFEi,t *SRi,t* SPi,t
0.024 (0.020)
0.011 (0.014)
0.015 (0.011)
BASPREADi,t
− 0.166 (0.833)
− 0.185 (0.841)
− 0.192 (0.837)
VOLi,t
− 0.000 (0.000)
− 0.000 (0.000)
− 0.000 (0.000)
SIZEi,t
0.004 (0.003)
0.004 (0.003)
0.004 (0.003)
BETAi,t
− 0.004 (0.003)
− 0.004 (0.003)
− 0.004 (0.003)
LEVi,t
0.008 (0.009)
0.009 (0.009)
0.008 (0.009)
MTBi,t
− 0.000 (0.000)
− 0.000 (0.000)
− 0.000 (0.000)
LTGROWTHi,t
− 0.001 (0.000)
− 0.001 (0.000)
− 0.000 (0.000)
DISPi,t
− 0.002 (0.001)
− 0.002 (0.001)
− 0.002 (0.001)
CONSTANT
0.025 (0.024)
0.021 (0.024)
0.018 (0.024)
Observations
1510
1510
1510
Adjusted R-squared
0.626
0.625
0.625
Firm FE
Yes
Yes
Yes
Year FE
Yes
Yes
Yes
This table presents the results for Model (2). The first column presents the effects of levels in Sustainability Performance (SP) and Sustainability Reporting (SR) on next period’s cost of equity (COEC). Column 1 presents the effects of CEO-fixed effects on next period’s cost of equity (COEC). Column 1 presents the results sorting the CEO-fixed effects into terciles, Column 2 (Column 3) as a robustness test into quartiles (quintiles). All variables are as defined in Table 3. Asterisks indicate significance levels with: ***p < 0.01, **p < 0.05, and *p < 0.1. Standard errors are clustered by CEO and reported in parentheses
Overall, these results are consistent with our general suggestion that CEOs are guided by their social values and preferences that drive their motives to engage in sustainability. Thus, they have a somewhat visible influence (i.e., CEO-fixed effects) on firm-level sustainability reporting which, then again, capital market participants use to assess a company’s risk as a function of incremental changes in sustainability performance.
5 Further analyses and robustness tests
In this section, we briefly present our additional tests. We discuss these in detail in ESM Appendix 3. We start our additional analyses by first examining how, in particular, certain levels of sustainability reporting moderate the relationship between sustainability performance and next-period cost of equity when CEO fixed effects are high (low). Our results suggest that, especially for CEOs belonging to the top tercile (i.e., CEOs with a high CEO-fixed effect), investors perceive an increase in sustainability performance as a bad signal when the reporting level is below the annual sample median, suggesting that this reporting level is insufficient to adequately convey the information to the capital market. Second, we analyze how, in particular, legally required (legal) and voluntarily implemented (normative) sustainability activities are moderated by CEO-fixed effects (Harjoto and Jo 2015). For this purpose, we split the sustainability performance variable into a normative and a legal sustainability performance measure and re-ran our moderation analysis. Our results suggest that CEO sustainability reporting style is particularly important for investors when evaluating normative sustainability activities. Third, we conduct a series of robustness tests to verify our main findings. In particular, we perform placebo tests in which we create artificial CEO-switches within the sample, restrict the sample to CEO changes from the internal pool, and only consider exogenous CEO turnovers in line with Fee et al. (2013). Additionally, we validate our score by randomly weighting items and comparing our measure of sustainability reporting to the length of hand-collected sustainability reports. Overall, our results support the findings of the main analyses. Kindly refer to ESM Appendix 3 for detailed discussion of all additional analyses and robustness tests and to ESM Appendix 4 for the corresponding result tables and figures.
6 Conclusion
This paper sheds light on the interplay between sustainability performance, sustainability reporting, and CEO-fixed effects on sustainability reporting and how they are jointly associated with cost of equity. We are particularly interested in how investors incorporate individual CEO-fixed effects on sustainability reporting as additional information as they assess company risk affected by sustainability performance. Our findings suggest that CEO-fixed effects have significant statistical power to explain the quality of sustainability reporting. Further, we use CEO-fixed effects of sustainability reporting to enhance our understanding of the relationship between sustainability performance and cost of equity and to disentangle sustainability reporting levels, which are primarily related to company-level characteristics, from those more closely tied to CEOs.
Our empirical findings indicate that investors recognize the specific style of a CEO as signaling the underlying motives behind corporate engagement in sustainability in their evaluation of future perspectives and risks. In this context, an increase (decrease) in the baseline company-level sustainability reporting results in increasing (decreasing) cost of equity in response to a marginal increase in sustainability performance depending on the levels of reporting a firm undergoes. Our results suggest that investors are more likely to perceive sustainability engagement related to increased reporting on it as a negative signal. Hereby, CEO’s underlying self-serving values might amplify this reaction as investors could view excessive reporting as mainly serving a CEO’s agenda (e.g., through extensive media coverage) at shareholders’ expense. Beyond that, investors are more likely to perceive corporate sustainability engagement in the context of tight reporting as pure shareholder value maximization and sustainability engagement as a business case. Subsuming shareholders appreciate sustainability activities perceived as grounded on instrumental motives as long as they are attributed to be shareholder-value increasing (i.e., as long as a CEO's goals aligns with the goals of shareholders).
We contribute to two research strings. First, we show that CEO-fixed effects help to explain a company’s quality and scope of sustainability reporting. In doing so, we add to the literature on manager-specific influences on company-level voluntary disclosure. The evidence so far is limited to voluntary financial reporting (Davis et al. 2015). We add to this stream of literature by considering the influence of CEOs on non-financial, rather long-term disclosures. We also add to the body of literature on factors influencing company-level sustainability reporting quality beyond company and industry level determinants (Brammer and Pavelin 2006; Clarkson et al. 2008, 2011; Dhaliwal et al. 2014).
Our second contribution builds on the first. With CEO-fixed effects considered a signal to outsiders (Ogunfowora et al. 2018), we add to the literature on signaling and attribution theory (Connelly et al. 2011). Specifically, we show that investors incorporate CEO-fixed effects on sustainability reporting in their perception of company risk when evaluating company-level sustainability performance, depending on the level of reporting thereon. Our paper thus enhances the understanding of the link between perceived risk and sustainability performance. Lastly, our continuous sustainability reporting score may also be helpful to practitioners and researchers engaging in future explorations of sustainability reporting beyond the sustainability report itself. Its wide availability and ready-to-use character make it appropriate not only as a variable of research interest, but also as an easy-to-implement control variable in empirical models.
Our study provides some insights into the signals that CEOs send to capital markets through their underlying personal style and value system. However, there are some limitations inherent to this study, particularly due to the limited sample size and the availability of within-sample switches that restrict the estimation of CEO-fixed effects. Specifically, we cannot observe unconditional CEO-fixed effects, as the estimated fixed effect is only relative to a company’s reporting level imprinted by its previous CEO. Hence, we acknowledge that the CEO-fixed effects obtained through our methodology are rather differences between company-level reporting style (imprinted by the prior management style) and the actual CEO-specific reporting style. In addition, we are not fully able to isolate time-invariant CEO characteristics, as additional time-varying but unobservable CEO characteristics could also be included in the estimated CEO-fixed effects. Further, CEO-fixed effects may capture some company-specific and selection effects. Lastly, we want to stress that the estimated CEO-fixed effects could also capture a signal to the capital market that is more related to a company-specific time trend with respect to sustainability reporting. Yet, we find significant results when we only consider exogenous CEO turnovers according to Fee et al. (2013). Therefore, it might be unlikely that unobservable factors (e.g., due to selection) drive our results. That said, we believe our findings are nonetheless meaningful as we are particularly interested in the way the signal of publicly observable CEO reporting styles depending on the level of reporting are processed by investors (who are likely to rely on methodology and data similar to those on which this study is based).
Acknowledgements
We appreciate feedback and suggestions from Joseph Comprix, Irene M. Gordon, Marie Dutordoir, Patrick D. Kielty, Christian Fieberg, David Harris, Lihong Liang, Peter Koveos, Bharat Patil, Ana Isabel Lopes, Kenth Skogsvik, Ting Dong, Mariya Ivanova, Milda Tylaite, Peter Aleksziev, Jochen Zimmermann, Juergen Bitzer, Erkan Goeren, and Joern Hoppmann as well as from participants of workshops held at Syracuse University (USA), Stockholm School of Economics (Sweden), University of Oldenburg (Germany), University of Bremen (Germany), University of Luxembourg, and conference participants of the 16th CICA International Accounting and Auditing Congress 2017 (Aveiro, Portugal), the 5th Paris Financial Management Conference 2017 (France), the Annual Accounting Conference 2018 (Berlin, Germany), the 80th VHB Annual Meeting 2018 (Magdeburg, Germany), the 41st Annual Congress of the European Accounting Association 2018 (Milan, Italy), the CAAA Annual Conference 2018 (Calgary, Canada) as well as the 2018 AAA Annual Meeting (Washington, DC, USA). We thank Chon-kul Park from Thomson Reuters (Asset4) for answering numerous questions regarding the methodology and data credibility of the sustainability reporting data provided in Asset4. We are also thankful for knowledgeable research support by Annabell Tietz. All errors are our own.
Declarations
Conflict of interest
Kerstin Lopatta declares that she has no conflict of interest. Thomas Kaspereit declares that he has no conflict of interest. Sebastian A. Tideman declares that he has no conflict of interest. Anna R. Rudolf declares that she has no conflict of interest. This research was not supported by external funding. Data is obtained from commercial, public sources and available via these databases.
Open AccessThis article is licensed under a Creative Commons Attribution 4.0 International License, which permits use, sharing, adaptation, distribution and reproduction in any medium or format, as long as you give appropriate credit to the original author(s) and the source, provide a link to the Creative Commons licence, and indicate if changes were made. The images or other third party material in this article are included in the article's Creative Commons licence, unless indicated otherwise in a credit line to the material. If material is not included in the article's Creative Commons licence and your intended use is not permitted by statutory regulation or exceeds the permitted use, you will need to obtain permission directly from the copyright holder. To view a copy of this licence, visit http://creativecommons.org/licenses/by/4.0/.
Publisher's Note
Springer Nature remains neutral with regard to jurisdictional claims in published maps and institutional affiliations.
From January 2013, the Zeitschrift für Betriebswirtschaft (ZfB) is published in English under the title Journal of Business Economics (JBE). The Journal of Business Economics (JBE) aims at encouraging theoretical and applied research in the field of business economics and business administration, promoting the exchange of ideas between science and practice.
We focus on CEOs in our analysis, as they are involved in all major disclosure policy decisions at the corporate level. Sustainability disclosure is admittedly within the responsibility of a company's CEO and CFO (Carroll and Shabana 2010). However, CFOs are more likely to be involved in the development or discussion of disclosure guidance (Brochet, Faurel, and McVay 2011). Still, we also performed our analysis on CFOs (see ESM Appendix 4 Fig. 1). Here the signal transmitted to the capital market is significantly weaker than the signal transmitted by the CEO.
Signaling and attribution theory promotes the idea that individuals update their assessment when they receive new signals (Connelly et al. 2011; Kelley and Michela 1980).
To ensure that the data quality of Asset4 is sufficiently high, we contacted Thomson Reuters to inquire further about their data processing. According to the information we received, data quality is ensured via both algorithmic as well as human processes. These processes include data entry checks (e.g., built-in error check logics), post-production automated quality check screens (e.g., interrelated data points and variance within year as logic checks; inconsistency/missing data checks), independent audits and feedback sessions with their data production teams, and management reviews with a focus on top areas of concern.
Using the Asset4 database, we expect to have covered most US firms that engage in sustainability reporting. Of 100 hand-collected, randomly selected US firms that are part of our initial sample but are not included in the Asset4 database, only four had published a sustainability report during our observation period.
Asset4's coverage changed in recent years. In particular, the coverage increased in 2017. To ensure the change in coverage does not drive our results, we repeated our analysis with a sample limited to companies that were in the Asset4 database prior to 2017. For our first and second step, our results (not tabulated) remain qualitatively the same.
Since at least three of the five items must be available for our measure of sustainability reporting, items are assigned a slightly higher weight if not all five items are available (i.e., 0.33 if only three items are available vs. 0.2 if all five items are available). We believe that this methodological choice is reasonable, but we acknowledge that we face a trade-off between sample size and accuracy.
Our measure is superior to the studies that use only a dummy in their research design (Dhaliwal et al. 2014; Dhaliwal et al. 2011), as these studies point out the lack of mapping of dimensions in the quality and extent of sustainability reporting. Furthermore, the adoption of our measure is not limited to Global Reporting Initiative (GRI) standards (Plumlee et al. 2015), as many other reporting standards related to sustainability disclosure exist. Furthermore, our metric captures all dimensions of sustainability reporting, including environmental, social, and governance. For instance, the metric of Clarkson et al. (2013) is limited to environmental reporting under the Environmental Protection Agency's (EPA) Toxic Release Inventory (TRI), which also requires only a limited number of companies to disclose.
Unlike Bertrand and Schoar (2003), we impose less strict requirements on CEO movements. We do not require a within- (Asset 4) sample switch of CEOs because such a restriction would result in an insufficient sample size for a multivariate analysis as we can only identify 14 within-sample switches resulting in 117 firm-year observations with estimated CEO-fixed effects related to movers. However, we require a CEO turnover for each company in our sample to, at least partly, disentangle CEOs from firm-fixed effects. Hence, each sample CEO has either become a CEO, left a firm, or switched to another company as CEO during the sample period. Given our methodological choice, we acknowledge that the estimated CEO-fixed effects are more reflective of capturing CEO style as a function of a particular company due to the small number of within-sample switches. For example, if company (a) has CEO (k) and a switch occurs and CEO (k) is replaced by CEO (l), the estimated effect on CEO (l) and company (a) reflects the change in sustainability reporting level relative to CEO (k) on company (a). For this empirical limitation we argue that it is likely to be a signal similar to that which is visible to investors when they try to assess a CEO’s sustainability reporting style. Additionally, company-level specific time trends, which are not captured by our set of control variables, are included in the CEO-fixed effect. To illustrate this concern, let’s assume a 10-year timeline and a CEO who joined a company in t = 6. Whereas the firm-fixed effect captures the baseline level of sustainability reporting quality in t = 1–5, the CEO-fixed effect measures the difference in the level of sustainability reporting quality in t = 6–10, relative to t = 1–5. While the year fixed effects capture a general time trend in the quality of corporate sustainability reporting, company-specific time trends not captured by controls remain in the CEO-fixed effect. We acknowledge this as a limitation of our approach. However, we believe that this is the best available empirical strategy, as it is not feasible to estimate this effect in this setting separately and we tried to capture as many alternative channels/determinants of sustainability reporting as we are aware of with our control variables.
We argue that intentions due to baseline instrumental or relational motives are, at least partly, captured by the company- and CEO-level control variables in Model (1b).
We chose the end of June as the dividing point so that both cost of equity as well as the sustainability reporting score are determined for annual periods from June of year t to July of year t+1. However, the results remain qualitatively similar and significant when we set the end of December as the dividing point (67.86 % of all firm-year observations in our sample have their financial year end at the end of December).
We estimate the cost of equity for each company at the end of June of each year following the approach outlined in Hou, van Dijk, and Zhang (2012) and take the mean value of five distinct cost of equity estimates, using both actual earnings numbers as well as analyst forecasts (for an comprehensive explanation of the five different cost of equity measures, see El Ghoul et al. (2011) as well as Hou et al. (2012)). These are the Claus and Thomas (2001) model; the Gebhardt, Lee, and Swaminathan (2001) model; the Gordon and Gordon (1997) model; the MPEG/ Easton (2004) model; and the Ohlson and Juetter-Nauroth (2005) model.
As indicated in Footnote 10, the estimated CEO-fixed effect indicates the impact of the CEO on sustainability reporting on the level of reporting that was influenced by the previous CEO. Since in a case with two CEOs for one company in the sample, the CEO-fixed effects fully explain the firm-fixed effect, we ensured that our statistics software (Stata) omitted the fixed effect of the first CEO for one company in our sample and did not drop the firm-fixed effect.
High levels of cost of equity have been shown to motivate firms to engage and disclose more on their sustainability performance to lower financing costs. In turn, companies with a better sustainability performance and quality of sustainability disclosures merit a reduced cost of equity.
This is commonly done in empirical accounting research when variables are known to suffer from low measurement accuracy (Ball and Bartov 1996; Bartov et al. 2000).
Brambor et. al (2006) recommend including an exogenous variable X not only as part of interaction term X*Z but also as a separate variable, even if the separate variable X is anticipated ex-ante to have zero influence on the endogenous variable Y when the other variable Z of the interaction term equals zero. This is because a measurement bias of the other coefficient estimates already emerges once the true coefficient of X is non-zero (not necessarily statistically different from zero). If the true coefficient of X truly equals zero, the estimated coefficient of X would be statistically insignificant and would not cause biased coefficient estimates.
As Fig. 1 shows, the link between sustainability performance and cost of equity is moderated by sustainability reporting and the specific style of the CEO. This channel could also be analyzed from a different angle. For example, sustainability reporting could also affect sustainability performance, the CEO’s sustainability reporting style could also influence sustainability reporting, and sustainability reporting style could also influence sustainability performance. However, we are interested in the relationship between sustainability performance and the cost of equity moderated by reporting and the CEO-fixed effect, as this sequential order is based on theory. Hence, a company has an incentive to report after it attains a certain sustainability performance, and based on this reporting, the information regarding the CEO-fixed effect is formed.
Our sample includes primarily large companies, as these are more likely to be covered by sustainability databases such as Asset4. Since size and cost of equity are inversely related (Hail and Leuz 2006), this may explain why our estimates are slightly lower compared to those of Dhaliwal et al. (2016). As we estimated the cost of equity for the entire Compustat, CRSP, I/B/E/S intersection, we compared these measures to the figures reported Dhaliwal et al. (2016). For this sample, the mean of our average cost of equity measure is 9.43, which is quite close to the average cost of equity value reported by Dhaliwal et al. (2016) (cost of equity mean 11.08). The differences in the sample period must also be taken into account when comparing these two means of cost of equity measures. Another consideration is the difference in the risk-free interest rate for the underlying sample periods of Dhaliwal et al. (2016) and our sample. While the average risk-free interest rate (yield of a ten-year government bond) for the 1981–2011 sample period was 6.82 %, the average risk-free interest rate (yield of a ten-year government bond) for our sample period is lower, with a value of 3.43 %. Taking this difference into account, the average risk premium (cost of equity – risk-free rate) for our sample and that of Dhaliwal et al. (2016) turn out to be quite similar.
Our measure of CEO reporting style, the estimated CEO-fixed effects, is the sum of observable and unobservable time-varying and time-invariant characteristics. By including observable CEO characteristics in our regression Model (1a/b), such as CEO age or tenure, we attempt to isolate the time-invariant effects for the estimated CEO-fixed effects. We argue that these variables might also capture some time-varying unobservable characteristics such as risk preferences. However, due to our research approach and the limited data availability, this is not fully possible. Therefore, we would like to point out this limitation of our methodology.
The coefficient on the three-way-interaction (SP*SR*CEOFE) is indicated as on average positive but not significant in Table 7. According to Brambor et al. (2006), “Scholars should refrain from interpreting the constitutive elements of interaction terms as unconditional or average effects—they are not. Notice that the reason why multiplicative interaction models capture the intuition behind conditional hypotheses so effectively is because they make the effect of the independent variable X on the dependent variable Y depend on some third variable Z. As a consequence, the coefficient on the constitutive term X must not be interpreted as the average effect of a change in X on Y as it can in a linear-additive regression model.”(71–72).
To address the concern that a new CEO is coupled with a company-specific time trend and that this determines the impact on the quality of sustainability reporting rather than the specific CEO, we included dummy variables in Model (1a/b) if a change occurred in the current (last or second last) period. None of the three indicators turned out to be statistically significant (see ESM Appendix 4 Table 2). To further test whether sustainability performance is more likely to be affected by a change in leadership which in turn affects sustainability reporting, we interact each of the dummy variables in Model (1a/b) with sustainability performance. Again, none of the coefficients in the estimate of Model 1 were significant (see ESM Appendix 4 Table 3).
The moderating role of CEO sustainability reporting style in the relationship between sustainability performance, sustainability reporting, and cost of equity
Authors
Kerstin Lopatta Thomas Kaspereit Sebastian A. Tideman Anna R. Rudolf