Active mobility is a way of keeping oneself in a good health, although it may cause some discomfort. Globally, and specifically in Singapore context, several elements can influence our decisions. The choice of the right time for active mobility depends not only on available vehicles but also on the weather and the air quality. Popular fitness trackers motivate users by a daily step count goal. At the same time, open data, bus arrival times or shared bicycles availability help optimise the planning of the active mobility. Given these elements, a personalised mobile application was designed in order to facilitate the mobility choice. The paper describes how this application was constructed. It focuses on the use of semantic web reasoning for the integration of all factors and the recommendation inference. The outcome of the ongoing deployment with 36 participants is presented.
1 Introduction
It is well known that physical exercise enhances blood circulation, which in turn has additional health benefits [5]. Even in advanced age, it is not too late to start even a simple exercise, such as a walk, to notice improvements [1]. Walking, a light physical activity, has been recommended to cope with type 2 diabetes [2].
We consider active mobility to be one or a combination of the following activities: walking, jogging, cycling and, to a certain extent, using a scooter or even taking public transportation as there is an additional physical effort compared to use of a private car or a motorcycle.
Anzeige
Getting physical exercise through active mobility is convenient. It has the potential to decrease the cost of commute if it can replace some parts of one’s journey. It can save time as well – time that would be needed to get to an activity-specific environment like a gym. Although active mobility is essentially an outstanding way of improving one’s health, the outdoor environment is an important risk factor. For instance, air pollution, noise, and risk of accidents [3]. Air pollution becomes dangerous due to increased respiration rate during a physical activity. For that reason, the authorities usually discourage people from performing them if the concentration of particles reaches defined thresholds.
At the same time, other research evidence suggests that the benefits of physical activity due to walking and cycling outweigh the detrimental effects of air pollution exposure and the risk of traffic incidents [4].
Our aim is to promote active mobility by making it more accessible and preferable to other kinds of transportation, such as personal vehicles, taxis and or other similar services. The focus is thus on maintaining and enhancing the health of our users. This has to be done with respect to their profiles and the potential environmental impact of the chosen mobility solutions. Other useful indicators include current daily progress, e.g. using step count, as well as other real-time and near real-time data.
We approached it by providing a unified interface for services that have been already made available by local companies or government agencies. In the back-end, we used semantic technology to facilitate the evolution of the application in order to integrate new features. We also made it modular and allow administrators to create new content that are directly visible to our participants.
Anzeige
Context in Singapore. As in other cities, in Singapore, public transportation faces the problem of the first and the last mile; the distance between the starting point of the commuter’s journey and the most convenient transportation node (bus stop, interchange or Mass Rapid Transit (MRT) station) and similarly, the exit point of the network and their real destination.
The city-state allows bicycles-riding on both walkways and roads (unlike, for example, France where riding a bike on a walkway is tolerated but not officially allowed). In 2016, shared bicycles became very popular and the trend is now decreasing. Meanwhile, the use of personal mobility devices (PMDs), mainly electric scooters is rising. In the latest legislation in effect since February 2019, the maximum riding speed on walkways is 10 km/h for all devices. Shared paths (bicycles, rollers, walking) and park connector network allow 25 km/h.
2 Research Problem
This paper presents an approach to tackle the issue of sedentary life-style in a non-intrusive way, that is suitable to everyone regardless of age or health conditions.
The main interest of ours is to motivate the user while ensuring maximum convenience given the space we have. This means we need to push our message without too much pressure in order to retain the user’s attention and interest. From the layout point of view, all necessary information should be provided without overwhelming the user.
In the back-end side of the application, which is our main focus in this paper, we ought to provide the aforementioned services in a dynamic way, transparent to the user, having a lot of flexibility as the parameters might need to evolve over time. New sources can be added and discontinued sources must not affect the functionality of the technological solution. Therefore, the proposed solution is expected to be modular.
Semantic web technologies provide interesting tools to create knowledge-based systems. They provide modularity and flexibility when removing or inserting the information. However, the main difficulty is that the logical inference may produce unexpected results and therefore, verification mechanisms have to be implemented (Fig. 2).
From the point of view of semantic technologies in mobile applications surveyed in [7], we position our software as a client-server architecture where the reasoning is performed in a remote server. In this setting, the client only formats and displays the information. The application would belong to several categories: health, recommendation, map-based.
To the best of our knowledge, no holistic application focused on mobility solution was available. We believe that a way of merging the heterogeneous data is a valuable contribution to possible uses of the semantic web technologies.
For instance, Google Maps application, offers different mobility solutions (public transport, walk, taxi). It even offers a travel time estimation. However, the mobility offer is not adapted to the user’s profile nor to the current weather. On the other hand, “fitness” applications (Fitbit, Google Fit, Apple Health) are oriented more on achieving better values, being competitive. Therefore, we believe this fusion of multiple functionalities has an added value for the user.
3 Application Design
The resulting Android application data flow is depicted in Fig. 1. Upon opening, our application sends a geo-located request to our server. The server interacts with necessary APIs to obtain the data: the current physical activity progress rate from the fitness tracker, e.g. \(90\,\%\); the weather 2 h forecast, e.g. rain,and current temperature, e.g. \(26\,^{\circ }\mathrm {C}\); and the current air quality index (AQI), e.g. 140. From the profile stored in the database, information about one’s personal condition is retrieved: asthma, e.g no; disability, e.g. yes. All the information is injected into a semantic graph structure using an ontology model in which the parameters fit: the knowledge base. The reasoning process applies our set of rules on this knowledge base. The rules keep producing new knowledge until a “desirability” of modelled mobility solutions is obtained. This information is returned to the client and along with environmental factors (forecast, temperature, AQI). The mobile application then presents this information to the user using colour codes for each mobility solution.
Fig. 1.
On a request from the application, platform UbiSmart (designed according to [6]) injects available information from multiple sources into the semantic structure of the knowledge base, applies rules and serves a comprehensive decision and its context.
×
3.1 User Interface
This part of the design process was performed by our industrial partner, having a user-centred approach in mind. The design of the system started with an overview of applications currently offered for major operating systems in sections concerning mobility, well-being and physical activity. Opinions of potential users and other stakeholders were collected in a workshop setting, using questionnaires and brainstorming techniques.
The outcome showed that a most adapted application would have a very simple interface so that it could be used without a lot of interaction, with few indicators. Then, incrementally complex view was defined for each indicator and service integrated onto the application (Fitbit integration, API for bus arrivals, points of interest, bike-sharing integration).
We defined the simple interface as a three-level indicator according to a colour level: green, yellow and red with the intuitive meaning of the traffic lights or gauges indicating a measure of danger.
Around this basic indicator, we developed an algorithm that aggregates available dimensions and projects them in a one dimensional variable “desirability”, having value between 0 and 1, for each of the selected mobility solutions. It represents to what extent we recommend the given mobility solution provided the available information. The interval was divided into three segments, one for each colour.
[0, 1/3]: red – mobility solution is discouraged given the circumstances;
(1/3, 2/3]: yellow – not recommended;
(2/3, 1]: green – recommended.
4 Reasoning
The core of the application was the engine for decision process about each mobility solution. Our reasoning processes has already been deployed in indoor and outdoor environments. Activities of daily living of elderly people were monitored in their homes with motion sensors. In this way, their caregiver had an insight into global tendencies and the elderly could extend their autonomy. For this application, we used the same platform so that it is possible to integrate both systems for the same user. This means that we would be able to offer holistic services.
For reference, we provide only a short technological description, and details on the used technologies can be found in [6]. In very simple terms, we make use of semantic web technologies to model the user and their environment. The expression language is N3, Notation3 which is a dialect of Turtle language, a terse expression equivalent to RDF, itself a subclass of XML. The language describes information organised in triples of concepts: subject, predicate, object. A set of the triples forms a knowledge base.
4.1 Model
The main component of semantic web technologies is the knowledge base (KB) that contains all pieces of information. This information is structured in triples. A triple has a form of a three-term sentence, e.g. “hom:aqi qol:hasValue 105”. Each term is either a concept or a literal. Each concept is identified by a unique identifier – URI that points to its definition. A literal is a value of one of usual data types: string of characters, numerical value, boolean value, ... The dictionary of the terms and a “grammar” are defined in an ontology. An ontology describes what can exist in the world described by our knowledge base. In simple words, it defines the hierarchy of concepts. For instance, “cycling” is a “mobility solution”, which translates to concept of “cycling” being a subclass of the concept of “mobility solution”.
4.2 Rules
Rules define the mechanics of our world and are also expressed as a special kind of triples - subject is a formula, i.e. zero or more triples, enclosed in curly braces, predicate is the string “\(=>\)”, object is another formula written in curly braces. Formulas can contain special terms beginning with a question mark, e.g. “?weather”. They are similar to variables in imperative programming languages. Their scope is limited to the rule.
A set of rules applied on the current knowledge generates new information. Depending on the evaluation of the output, appearance of some specific triples may trigger actions on the outside world (notification), removal of the information from the KB. Rules can be used to perform arithmetic operations, aggregation or simple inference “if ..., then ...”.
The following is an excerpt of the rule set used in our application to determine the coefficient of air pollution from the measure of AQI obtained from a public source.
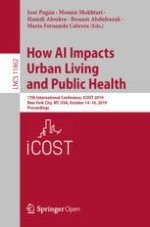
Soundness of the manually generated rules must be verified and along with the rules a table of all combinations was generated and is presented in Fig. 2.
×
4.3 Reasoner
Once the description of our universe (knowledge base) and its laws (rules) is ready, we apply a reasoner. A reasoner is an application that takes our triplets in input, along with the rules to be applied and a query that defines a selection of the knowledge base that is of interest for us. The reasoner we use is called “eye” shorthand for “Euler yet another proof Engine”. The choice of this tool is discussed in [6]. Eye is accessed via a Javascript interface inside our NodeJS application. Components of our application can add, remove and update the knowledge base.
4.4 Implementation of a Decision Table
For this application, we defined basic statements and implemented the rules. However, the most useful was the enumeration of all possible states in a table. It is automatically generated from a list of conditions for each dimension and their combinations. It was very helpful during verification process.
For the proof of our concept, the we integrated 6 dimensions with the segmentation as follows. The full table contain \(5 \mathrm {~weather~conditions} \times 2 \mathrm {~temperature~cases} \times 4 \mathrm {~AQI~intervals} \times 1 \mathrm {~scalar~goal~measure} \times 2 \mathrm {~disability} \times 2 \mathrm {~asthma} = 160 \) cells (each having a value for every mobility solution).
The visualisation of this space is presented in Fig. 2. This matrix of \(16 \times 10\) cells represents the different cases taken into account. Each cell contains a combination of digits that denote conditions in order weather (1–5: unknown, rain, fair, danger, wind), AQI (1–4: from better to worse), asthma (0 no or 1 yes), disability (0 no or 1 yes), temperature (0: under \(36\,^{\circ }\mathrm{C}\) or 1: over \(36\,^{\circ }\mathrm{C}\)).
There are 8 coloured segments, each of them represents a specific configuration of the aforementioned binary parameters. They are coded in RGB 3-dimensional colour space with following attributions: temperature = red, asthma = green, disability = blue. Their combinations give a colour combination: e.g. black (gray background) is at all values are 0, cyan has blue and green components so it depicts disability and asthma.
Within the coloured cluster, horizontal position indicates 4 cases of air quality indicator AQI with healthiest lowest values on the left and in this order: under 50, up to 100, up to 150, over 150. Vertical position within each coloured block are 5 cases of weather condition in this order: unknown, rain, good weather (fair, overcast, cloudy), dangerous (heavy rain, thunderstorm), and windy.
Inside each cell, 7 mobility solutions are indicated in order: walk, bicycle, scooter, motorbike, car, MRT, bus. Their vertical position within the cell is a measure of recommendation which also defines the colour according to their appearance in the application: red, yellow or green. The lower the mobility is placed, the lower is the score.
The indicated values are the maximum score the mobility can obtain in the configuration, and passive mobilities are weighted with current progress in goals. This means that “car” will be red if there was no physical activity progress in the day, even if it appears green in the cell.
Fig. 2.
Six dimensions for each mobility solution as implemented in our application
×
In the case of non-use of the fitness tracker, we decided to show the results as if the daily goal was achieved (we show the colour as in this table).
The current progress is adapted to the time of the day – 100% score is obtained if at 50 % of the day, the user completed 50 % of their goal.
The importance of explicitly drawing this table is for validation of the approaches to make sure that all cases are covered with values that make sense. We made use of it during the verification process and it helped to discover issues with the model.
Product of all values is the measure of desirability of given mobility solution for the currently known situation.
4.5 Deployment
The application was distributed to participants along with an optional Fitbit device. We were interested in the usage rate of the application and in gathering feedback from the users. Users own a smartphone and know at least basic interactions. In order to encourage users’ feedback, the participants were invited to a lucky draw where two participants would win an upgrade of their Fitbit device to a newer model.
5 Results
The application was deployed to 36 very heterogeneous group of users. In the latest phase, of 4 months, we monitored application start, reasoning cycle trigger, and Fitbit synchronisation time-dates.
Very few participants used the application extensively. We recognise that the installation was cumbersome due to the necessity to connect user’s Fitbit account to our application and several runtime errors in the application linked to the use of the GPS that need to be addressed in future versions. However the idea of a mobility application with these features seems appreciated. The deployment shows that 15 out of 36 users downloaded the application but needed a guided help to set it up with Fitbit or make the reasoning work (e.g. not activated geolocation services and hence, the application couldn’t operate).
According to 17 valid profiles, the age of participants ranged from 22 to 59 years, with an average of 31.5 years and median of 30.
The feedback from our active users include following categorised statements:
Data Empowerment. “The great power of data is when you can communicate it to people at an individual level that makes sense for them, for example: at a neighbourhood level . . . this is what air pollution looks like around you; what it means for you; and what the advice is.”
Near Geolocated Data. “Using the mobile App together with the wearable device is motivating, this is my one-stop-app for my personal data activity crossed with impactful Urban data. Those data are geo-located and enhance the use of the public space for citizens.”
About the Concept of Service. “Encouraging the people to be physically active and crossing this data with urban data makes sense to empower individuals in their daily lifestyle.”
Behaviour Change. “The mobile app enables to track your physical activity, it is very motivating. For instance, I will more likely try to walk or run more, also simple changes have an important impact on our daily lives, for example I take the stairs instead of the escalators to exit the subway. The sport side of the project, improving my physical activity is my main motivation.”
We also asked participants about the application’s ease of use and their feedback was used to solve technical issues. The need of providing a walk-through of the application was noted but scheduled for a further release.
6 Conclusion
We presented a functional concept application for mobility solutions based on symbolic reasoning. It combines the data from an activity tracker (Fitbit), publicly available environmental data (weather forecast, local temperature and air quality), and private profile data (asthma, disability). We described the functioning and the design, and in particular, the implementation of a 6-dimensional table used for validation of the rules.
Our solution was implemented and as an Android application deployed to 36 users. We are continuing the data collection in order to understand their use of the application. A positive user feedback shows that the application is able to fulfill new needs and it is encouraging us to enhance the interface and performances.
Acknowledgements
The work presented in this paper was supported by the PSA Group.
Open Access This chapter is licensed under the terms of the Creative Commons Attribution 4.0 International License (http://creativecommons.org/licenses/by/4.0/), which permits use, sharing, adaptation, distribution and reproduction in any medium or format, as long as you give appropriate credit to the original author(s) and the source, provide a link to the Creative Commons license and indicate if changes were made.
The images or other third party material in this chapter are included in the chapter's Creative Commons license, unless indicated otherwise in a credit line to the material. If material is not included in the chapter's Creative Commons license and your intended use is not permitted by statutory regulation or exceeds the permitted use, you will need to obtain permission directly from the copyright holder.