2022 | Buch

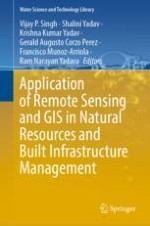
Application of Remote Sensing and GIS in Natural Resources and Built Infrastructure Management

herausgegeben von: Vijay P. Singh, Shalini Yadav, Krishna Kumar Yadav, Gerald Augusto Corzo Perez, Francisco Muñoz-Arriola, Ram Narayan Yadava

Verlag: Springer International Publishing

Buchreihe : Water Science and Technology Library

insite
SUCHEN

Über dieses Buch

This book discusses the problems in planning, building, and management strategies in the wake of application and expansion of remote sensing and GIS products in natural resources and infrastructure management. The book suggests proactive solutions to problems of natural resources and infrastructure management, providing alternatives for strategic planning, effective delivery, and growth perspectives. The uniqueness of the book is its broader spectrum of coverage with related interconnections and interdependences across science, engineering, and innovation. The book contains information that can be downscaled to the local level.

Presenting a wide spectrum of viewpoints and approaches, the book is a collective of topics such as application to agriculture and forestry (land and landscape, agriculture, forestry management and deforestation), water resources and ecology (hydro-meteorological, climate diagnostics, and prognostics, water resources management, environment management, cross-scale ecology and resilience), urban management (urban planning, design, construction and operations of infrastructure, natural disasters, novel approaches to upgrade old infrastructure), hydro informatics, predictive and geospatial data analytics, synthesis, and management through the various processes, tools, and technologies.
Inhaltsverzeichnis

Frontmatter
Chapter 1. Applications of Geospatial and Information Technologies Toward Achieving Sustainable Development Goals
Abstract
Sustainable development is possible by holistically prioritizing urban and rural development activities by capturing many complexities, constraints, and livelihood opportunities. In this context, United Nations (UN) designed a blueprint containing seventeen interlinked Sustainable Development Goals (SDGs) to address the global challenges, including climate change, environmental degradation, peace, poverty, inequality, and justice. The achievement of SDGs and their universality would be possible through readily available data from affordable sources such as remote sensing images and readily available sources. The spatio–temporal data analysis is crucial for assessing, monitoring, and decision-making and becomes integral in addressing SDG indicators. However, the advancement and availability of an enormous amount of earth observation data increased the need for new methods and techniques. Nowadays, the integration of geospatial technologies along with information and communication technology (ICT) like the Internet of Things (IoT), big data, machine learning (ML), artificial intelligence (AI), advanced sensor networking, and crowdsourcing has made a powerful analytic platform for Spatial Decision Support System (SDSS). This chapter comprehensively reviews and documents the scope and application of geospatial and information and communication technology and its role in action plan formulation toward achieving SDGs.
Srabani Das, Kuntal Ganguly, Tarik Mitran, Surya Deb Chakraborty
Chapter 2. Comparison of Maximum Likelihood, Neural Networks, and Random Forests Algorithms in Classifying Urban Landscape
Abstract
Land use land cover (LULC) is a significant component of remote sensing since it is employed in a variety of analyses, from change detection to geographic modeling. As a result, creating an accurate LULC map is critical. Three different pixel-based classification algorithms [i.e., maximum likelihood (ML), neural networks (NN) and random forests (RF)] were utilized to examine their relative performance in generating remotely sensed LULC maps in the current study. The research was carried out using high-resolution satellite images. The classification results are evaluated using accuracy measures derived from the confusion matrix. The findings suggest that it is difficult to achieve higher accuracy in classifying large urban areas using a 5 m resolution satellite dataset. The comparative results indicate that random forests have outperformed ML and NN in classifying the urban land cover using a high-resolution image. The user and producer accuracies of LULC are found to show no particular trend with any classification algorithm.
Akanksha Balha, Chander Kumar Singh
Chapter 3. Crowd-Assisted Flood Disaster Management
Abstract
Natural disasters, including floods, cause significant damage to people’s lives and properties and, in recent years, the frequency, complexity, and severity of these events appear to be increasing. Floods, in particular, cause more devastation, death, and economic impact than any other natural disaster. Disaster reporting has now progressed from official media reporting sources to real-time on-site citizen reporters. Crowd-generated content related to disasters and other events is usually identified as Crowdsourced Data (CSD). This data is often termed geospatial CSD or Volunteered Geographic Information (VGI) when the geospatial properties are provided. With advances in technology, the opportunity for citizens to report incidents as CSD is now freely and widely available. However, the quality of CSD remains problematic as it is captured by people of different backgrounds and abilities on a variety of platforms. In general, CSD is deemed unstructured, and its consistency remains poorly described. The improvement and confirmation of quality are very important for CSD use in critical applications such as flood disaster management. This chapter discusses the background, challenges and opportunities, applications, and quality of CSD along with quality evaluation processes tested on the Ushahidi Crowdmap data of the 2011 Australian floods. CSD location availability analysis, relevancy analysis using the Geographic Information Retrieval (GIR), and credibility analysis using a naïve Bayesian network-based model are also discussed. The results of this study revealed that 59% of the ABC’s 2011 Australian flood Crowdmap reports had location availability when the duplicate data were removed. They also show that GIR techniques and that naïve Bayesian models can be successfully applied to assess the CSD’s relevancy and credibility. The fit-for-purpose analysis of CSD for disaster management can significantly improve CSD's precision, reliability, currency, and ability to supplement authoritative data sources by filling information gaps.
S. Koswatte, K. McDougall, X. Liu
Chapter 4. Geospatial Big Earth Data and Urban Data Analytics
Abstract
Today, with the innovations and advancements of technologies and affordability of digital devices there is an explosion of huge amounts of archived and real-time digital data. This also includes the subset of the “Big Earth Data” which is generated using multitudinous sources viz., satellites, sensor networks, Internet of Things systems, and the hyper-connectivity of our society. It is diversified containing rich information across different geographic scales and resolutions. However, a massive challenge also exists on how this data has been exploited and explored to understand and solve problems in urban areas and cities. Furthermore, data analytics is also used for the exploration and analysis of the data sources, what the data represents, and transforming the data into information for intelligence creation. The recent evolutionary shift from Geographic Information Systems (GIS) to data analytics, including Urban Data Analytics enables us to gain insight into urban processes and answers to new and complex questions related to cities and urban areas. Based on above discussions, aims of this chapter are to provide insights on the recent trends and approaches in Geospatial Big Earth Data sources, uses, and their integration with IoT-based Big Data systems for urban studies. It also provides a review on use of machine learning and AI as state-of-the-art technologies to analyze the big urban earth data for accurate information for better decisions. Furthermore, an attempt is also made to discuss the way forward and future research areas and applications.
Chitrini Mozumder, N. S. Karthikeya
Chapter 5. A Comparative Analysis of Spatiotemporal Drought Events from Remote Sensing and Standardized Precipitation Indexes in Central America Dry Corridor
Abstract
Understanding the dynamics of the earth’s surface variation patterns has been critical for climate change adaptation and mitigation. During the last decades, detecting these events through remote sensing allowed us to improve the conventional analysis toward an integrated space–time analysis. This chapter proposes a spatiotemporal exploratory analysis of the information from SPI, SPEI and links its results into remote sensing information of NDVI using computer vision algorithms for pattern recognition and tracking. This analysis was carried out in three phases. First, a 20-year analysis of vegetation-based indices (NDVI) and meteorological drought indices (SPI, SPEI), to identify and compare the water anomalies over Central America dry corridor, using ERA5 climatological information and satellite images for the period 2000–2020. These results are used to assess the spatiotemporal variations of meteorological stress and vegetation water stress. All this is analyzed considering the conditions along the phenological cycle. The implementation of the spatiotemporal drought methodology proposed by Corzo and Vitali, 2018, and its results used as input time series, through LOWESS smoothing proposed by Jong (Remote Sens Environ 115(2):692–702, 2011). The final comparison uses statistical metrics such as spatial correlation. Drought units are identified for each meteorological drought index and are compared among them, and together with the NDVI normalization, a vegetation-based drought index (vegetation condition index or VCI) is estimated. This step allows representing the phenological conditions of vegetative water stress without interferences of temporality and consistency. Finally, the VCI is classified in categorical ranges that allow the comparison of drought units to the SPI in different lags (1, 3, 6) and SPEI (1, 3, 6). By this, establishing meteorological relationships with the vegetative surface dynamics and generating the trajectories (tracking) of each drought cluster observed with the VCI. Finally, a validation of the trajectories are also compared. All validation show that his methodology allows using directly inferred drought from remote sensing as a meteorological drought index, in similar way as SPI. The spatiotemporal changes monitoring and evaluation associated with land cover and water sources, and derivation of drought index based on vegetative condition is an essential component of this chapter’s contribution.
Karel Aldrin Sánchez Hernández, Gerald Augusto Corzo Perez
Chapter 6. Application of GIS and Remote Sensing Tools in Assessment of Drought Using Satellite and Ground-Based Data
R. V. Galkate, Sukant Jain, R. K. Jaiswal, R. P. Pandey, A. K. Lohani, Shalini Yadav, Ram Narayan Yadava
Chapter 7. Determining the Yield of Rice Using the Leaf Area Index (LAI) in Iran
Abstract
Most of Iran’s rice production is cultivated in the north zone of the country and also a strategic crop for Iranians. The per capita consumption of rice is 35 kg/person. Therefore, knowledge about the characteristics of rice and particularly, yield is very important. One of the most important indicators to determine the growth period and yield of rice is the leaf area index (LAI). In this study, the LAI index obtained from the MCD15A2H product of MODIS was used to border rice cultivation areas and to obtain yield estimates. According to previous studies of famous Iranian rice (Shiroodi, Kados, Hashemi and Deylamani) cultivars in relation to leaf area index (obtained from ground measurements) and the number of fertile tillers, which has been calculated significantly and positively. In this study, the equation for estimating rice yield was generated. The yield estimation equation was tested in 22,107 rice fields with an area of 90,350 ha. The estimated yield results were compared with the actual rice yield cultivars. In 2018–2019, the real average yield of rice in the country was 4539 kg/ha, and the result of the estimated yield was 4794 kg/ha. The average error in the country was 908.85 kg/ha.
Hamid Rahimi, Shahnaz Karami Sorkhalije, Hajar Marabi
Chapter 8. Soil Erosion Modeling Using Remote Sensing and GIS
Abstract
Besides a naturally occurring process, soil erosion results in a continuous loss of topsoil, ecological degradation, etc. Evaluating soil loss from watersheds is required while assessing the severity of soil erosion. The average annual soil loss from the Nathpa-Jhakri catchment has been estimated by employing the Revised Universal Soil Loss Equation (RUSLE) and Morgan-Morgan-Finney (MMF) models in the present study. The RUSLE factors and MMF parameters were calculated using meteorological data, FAO soil map, ASTER DEM map, European Space Agency (ESA) land use/cover map, and other reference studies. The model factors and parameters were integrated into the geographic information system (GIS) environment to estimate the soil loss. GIS was used in this study to generate, manipulate, and spatially organize disparate data for soil erosion modeling. The estimated average annual soil loss using the RUSLE and MMF models was 20.42 and 26.29 tons/ha/year, respectively. The coefficient of determination for sediment yield using the RUSLE and MMF models was 0.80 and 0.75, with a variation of 13.41% and 21.62%, respectively. Further, the total catchment area was categorized into the different erosion classes, viz., slight, moderate, high, very high, severe, and very severe. The RUSLE model showed that about 35.8% of the area of the Nathpa-Jhakri catchment lies in the slight to moderate, and 64.2% of the area lies in the high to very severe soil erosion classes. The soil loss estimated by MMF model showed that 13.88% of the Nathpa-Jhakri catchment area lies in the slight to moderate, and 86.12% of the area lies in the high to very severe soil erosion classes. The RUSLE model showed more precise results than the MMF model for the Nathpa-Jhakri catchment. Based on RUSLE model results, about 64.2% catchment area of the Nathpa-Jhakri needs immediate attention for proper land use management practices.
Osama Mirran Hussien Al-Qaim, Vikas G. Jadhao, Ashish Pandey
Chapter 9. The Mapping of the Intensity of Degradation According to the Different Land Use in Arid Regions: The Case of the Bouhamed Watershed, Southern Tunisia
Abstract
The Bouhamed watershed, which is the subject of our study, belongs to an arid ecosystem characterised by an apparent fragility which is manifested by the low-vegetation cover and the spatial importance of bare soil areas. The ecosystems fragility in this region is mainly due to unfavourable climatic conditions (aridity, low rainfall, etc.). To these climatic factors are added inappropriate anthropogenic activities (overgrazing, clearing of rangelands, etc.) to the biophysical conditions of arid environments. The overexploitation of natural resources in the study region has accentuated the degradation of these environments and even their desertification. Indeed, in our case study, the implantation of olive trees at the expense of natural vegetation exposed the soil to erosion factors. In this context, this work adopts a methodology based on the combined contribution of remote sensing and GIS. Our approach consists in evaluating the state of desertification and specifying the level of sensitivity of surfaces to degradation according to the land use patterns distinguished in the study region. As a result, three radiometric indices were calculated (the soil adjusted vegetation index (SAVI), brightness index (BI), and colour index (CI)) derived from Landsat 8 Operational Land Imager (OLI) dating from 2014, whose aim is to produce a summary map that assesses the degradation intensity in the Bouhamed watershed. Based on the combination of the three indices complemented by field observations and a spatial database (land use and surface condition) integrated in a GIS, it was easy to evaluate and classify the region studied according to the intensity of degradation, from the lowest to the highest. The determination of the degradation intensity for each land use mode favours the accuracy of the level of sensitivity to desertification. Thus, according to the sensitivity to the risk of desertification, agropastoral activity (rangelands, cultivated land, ploughed land) is classified from very sensitive to not sensitive to risk. The results show the dominance for the medium degradation intensity class, with 89% of the total area. This degradation class corresponds to surface conditions dominated by loamy to loamy-sandy soils with the outcrop of gypsum crust and hardpan.
Nesrine Arrak, Aziza Ghram-Messedi
Chapter 10. Applicability of the Global Land Evaporation Amsterdam Model Data for Basin-Scale Spatiotemporal Drought Assessment
Abstract
Drought directly impacts the living organisms and environment, and thereby, its assessment is essential. Different drought indices require different data, which can be obtained based on models or in-situ measurements, demanding a significant amount of effort. Using remotely sensed (RS) data from satellites can facilitate this data acquisition. Nowadays, more and more satellite techniques are rising, highlighting the need to assess the accuracy of their data and the reliability of the results obtained employing them. The Wet-environment Evapotranspiration Precipitation Standardized Index (WEPSI) has shown good performance in drought monitoring and assessment, especially for agricultural purposes. This chapter employs the Global Land Evaporation Amsterdam Model (GLEAM) data to investigate its applicability in the Lempa River basin drought assessment using WEPSI. In this order, evaluated data obtained from the Water Evaluation and Planning system (WEAP) were used as the basis for comparison. Precisely, a comparison was made with GLEAM and WEAP-based data as well as WEPSI time series based on these two datasets. The results show relatively high similarity between these two datasets and calculated WEPSI drought indices. This validates the good performance of GLEAM-based data in drought monitoring and assessment based on WEPSI.
Ali Khoshnazar, Gerald Augusto Corzo Perez, Vitali Diaz
Chapter 11. Remote Sensing-Based Estimation of Shallow Inland Lake Morphometry: A Case Study of Sambhar Salt Lake, Ramsar Site-464, India
Abstract
Lake morphology has been identified as a key factor for the understanding of lacustrine systems. Notably, the morphometric descriptors have been viewed as factors controlling lake productivity due to light penetration, oxygen distribution, heat balance, nature of the sediments, and littoral zone development. The overarching goal of this study is to explore the ecological knowledge of HSAS—‘Hypersaline-Alkaline Shallow Lake,’ through the determination of selected morphometric parameters. Despite their ubiquity and significance, however, inland HSAS lakes are generally less studied than freshwater lakes. Therefore, quantifying morphometry for these inland lakes is quite important, which has implications for their ecology and management. Lake morphology is quantified with morphometric metrics that are descriptors of the form and size of lake basins. Geospatial technology is becoming important to process and analyze morphometric metrics. To perform this analysis, spatiotemporal Landsat Multispectral Scanner System (MSS) and Operational Land Imager (OLI) Imagery have been used. These satellite images have been atmospherically corrected using Improved Dark Subtraction (IDOS) method, and based on Normalized Difference Water Indices (NDWI), the lake water surface extent was extracted for further analysis. For lake water depth measurements, demanding field measurements were taken using GPS receiver and other morphometric measurements were estimated using ‘Håkanson morphometry’ manual. This lake has been morphometrically assessed for the years 1975 and 2015. As a result, the drastic changes have been observed in its morphometrical dimensions. For the year 1975, this lake can be characterized as a shallow, convex, and intermediate type hypersaline-alkaline endorheic lake. In addition, for the year 2015, this lake behaves as an extremely shallow, concave, and small hypersaline-alkaline endorheic lake system. This analysis provides crucial knowledge in support of approaches to lake management. This study is based on only two distinct years, i.e., 1975 and 2015; if similar morphometrical analysis can be performed for a long time period, then characteristics of this lake can be defined in a more illustrative and descriptive way.
Kartar Singh, Mili Ghosh Nee Lala, Shubha Rani Sharma, Ashutosh, Gaurav Chandra, Anand Prakash
Chapter 12. Remote Sensing and GIS in Spatial Monitoring of the Wetlands: A Case Study of Loktak Lake Catchment, India
Abstract
Occurrence of the wetlands is characterized where the land is covered by water or the water table level is close to the land surface. Wetlands are the only ecosystems for whose conservation an international convention called Ramsar Convention was set up in the year 1971. According to Ramsar Convention, a wetland is “areas of fen, marsh, swamp, peat either artificial or natural with water which is flowing or static including areas of marine water the depth of which should not exceed six meters.” As per Ramsar Convention in 2019, there are 2341 Ramsar sites listed across the world, among which Loktak Lake is one of the Ramsar sites nestled in the North-Eastern Himalayan ranges. Distinctive feature of this lake is the presence of herbaceous floating biomass (herbaceous wetlands) locally known as phumdis. In this case study land use land cover (LULC) of Loktak Lake catchment was mapped with special emphasis on wetlands and herbaceous wetlands. Based on the driving factors and past LULC for the year 2007, 2014 and 2017, the future LULC for the year 2030 was predicted by Land Change Modeller (LCM) in TerrSet using Landsat 5 and Landsat 8 multispectral satellite imageries. Artificial neural network (ANN) and Markov chain algorithms embedded in the LCM were deployed to predict the future LULC condition. ANN was trained with driving factors, namely slope and elevation, distance from built-up area and distance from roads. Results indicate that there was decrease of 28.65% and 6.08% in herbaceous wetlands and wetlands, respectively, in the year 2017 as compared to the year 2007. Similar trends were observed in the future projected LULC map of 2030 with a decrement of 6.48% and 41.56% in wetlands and herbaceous wetlands as compare to the baseline scenario of 2007. Based on the result of projected scenario, it is evident that there is a need to devise proper environment conservation policies.
Anand Vicky, Oinam Bakimchandra
Chapter 13. Delineation of Groundwater Potential Zones in a Tropical River Basin Using Geospatial Techniques and Analytical Hierarchy Process
Abstract
The need for sustainable groundwater resource management increases with demand of clean water across the planet for industrial, agriculture, and domestic uses. In the present study, an attempt has been made to delineate the groundwater potential zones (GWPZ) in a tropical river basin, viz. Achankovil river basin (ARB), using GIS and analytical hierarchy process (AHP) techniques. For this, a total of eight geo-environmental variables such as lithology, geomorphic features, land use/land cover, soil texture, lineament density, drainage density, topographic wetness index, and mean annual rainfall were used to identify the GWPZ, and limited number dug well yield data published by the Central Ground Water Board (CGWB) is used to validate the model. The result indicates that nearly 50% of the basin is characterized by good to very good groundwater potential, whereas poor GWPZ accounts nearly 25% of the basin. Among the different thematic factors’ geology, geomorphic features and slope angle have significant control over the occurrence of groundwater in the study area. The linear relation between well yield data and groundwater potential zones is assessed, and a R2 value of 0.790 indicates that the predicted model is trustworthy and can be used for groundwater resources management in the study area. The integrated approach used in the study is reliable and can be replicated anywhere in the tropical region.
A. L. Achu, N. Anjali, Girish Gopinath
Chapter 14. Management of Environmentally Stressed Areas in Watershed Using Multi-criteria Decision Tool in GIS: A Noble Technique to Conserve Soil for Agriculture
Abstract
Soil erosion is a natural process that affects land productivity and is considered one of the most significant environmental hazards. The climate, landscape and land cover, and conservation practices are the factors that are accountable for the rate and quantum of erosion which varies spatially and temporally. The geographic information system (GIS) can analyze the spatial variability of different forces responsible for soil erosion and is widely used for the demarcation of hazardous areas and suitable conservation measures. Here, we have discussed the impacts of water erosion and suggested a framework to identify stressed areas using AHP and GIS-based techniques to suggest conservation measures. The scientifically developed catchment area treatment plan using multilayer information in GIS can control soil erosion up to the maximum possible extent and provide sustainable development of the area. A case study has been presented in the chapter to demonstrate the application of the suggested framework in a catchment of water resource projects.
Rahul Kumar Jaiswal, Shalini Yadav, Ram Narayan Yadava
Chapter 15. Geospatial Technology for Estimating the Physical Vulnerability of Building Structures to Natural Hazards
Abstract
Climate change causes major effects on the environment and nature as it leads to increasing urban flood hazards. Flooding is the most frequent natural hazard that occurs in the Asia–Pacific region where an increasing number of people are choosing to live in floodplain areas. Communities living in monsoonal regions have learned to live with floods. The most important component of flood management is assessing flood vulnerability on an urban scale. This study conducted flood vulnerability assessment and analysis of physical building structures in Warin Chamrap municipality, Thailand. GIS-based method of estimating the vulnerability of buildings to floods was employed for flood vulnerability assessment. The results identified building structures in the flood-prone area that are at extreme risk. The study found that 87 households were at a moderate to extreme risk in the extreme flood vulnerability area and 130 households with structural damage. The flood vulnerability index (FVI) is a powerful tool for a better understanding of community and building structures and to identify adaptations for vulnerability reduction. However, the FVI is limited by a number of factors that reduce its capacity as an accurate and practical tool for decision-makers. For future development, geospatial data visualization and GIS-based flood vulnerability assessment techniques should be considered as a method to provide a baseline to guide further study.
K. Nakhapakorn, P. Q. Giang, A. Ussawarujikulchai, K. Tantrakarnapa, S. Jirakajohnkool, T. Weerasiri, N. Srichan, T. Maneekul, P. PhramahaTawee
Chapter 16. Cooling Potential Simulation of Urban Green Space Using Remote Sensing and Web-Based GIS Integration in Panat Nikom Municipality, Thailand
Abstract
The most important local and global change driving force is urbanization because it progressively replaces natural surfaces with built surfaces. These causes enhance the urban heat island phenomenon where the temperature in the urban area is higher than the temperature in the countryside around the city. Increasing urban green space can play an important role in reducing the urban heat island effects and providing comfort to the nearby area. It can also contribute to the United Nations Sustainable Development Goals (SDGs), especially SDG 11, which aims to make cities and human settlements inclusive, safe, resilient, and sustainable. This study aimed to develop a web-based simulation platform for examining local temperature changes from the change in the proportion of green space in the city. The Worldview-3 imagery was used for green space area extraction through NDVI and land surface temperature from Landsat 8 OLI. The relationship between surface temperature and the green area was studied with NDVI using regression analysis to develop an equation for land surface temperature calculated according to the changes in the green area. The web-based GIS platform was developed using open source with Geoserver and LeafletJS using an equation developed for exploring and simulating the cooling potential of urban green spaces through a web user interface. The temperature was more related to the NDVI, which can refer to the quality of the green area rather than the size of the green space. It was concluded that the cooling potential of such green areas is determined mainly by the quantity and quality of the green space, which is essential to increasing or decreasing the local temperature and ecological environment. Setting the target for reducing the temperature to the comfort level might require tools that allow urban policymakers to know the level of temperature in the area and the temperature drop changes by increasing green area proportion to determine how much more green space the city has needs.
Chanida Suwanprasit, Sakda Homhuan, Wanpen Charoentrakulpeeti
Chapter 17. Geo-spatial Modeling of Coastal Flood Exposures Due to Local Sea-Level Rise and Landscape Dynamics: A Case of Sagar Island
Abstract
Coastal inundations are frequent natural events that are caused due to increase in tidal amplitudes triggered by the cyclone, storm surge, extreme rainfall, thermal expansion of oceanic waters, tectonic movements, and many other factors. Despite flooding being an essential part of the natural system, these natural events have been considered disastrous since they have a negative effect on human activities. Land use change and emissions due to anthropogenic activities have led to an increase in climatic extremes. Globally, accelerating temperatures have led to an increase in the intensity and frequency of cyclonic events and localized flooding. Inundation of coastal areas would damage agriculture yield, assets, socio-economic livelihood, natural habitats, and ecosystems. The goal of the current research is to determine the flood exposure in Sagar Island caused by storm surges, severe rainfall events, and rising sea levels. The goal was achieved by spatially overlaying two objectives, viz. (i) Land use dynamics modeling for identifying assets, houses and (ii) Flood inundation modeling. Agent-based land use change model has been used to visualize the likely change pattern for the year 2050. Zero connectivity bathtub model was used to spatially determine flood inundation exposure of the Island. Zero connectivity bathtub model assumes that all cells with elevations lesser than the threshold are subjected to flooding. Threshold in the current study was determined based on variable sea-level rise due to cyclonic storms, severe rainfall events, and topographic conditions. Population and landscapes elements that are likely to be exposed for the current and future time periods are derived based on statistical data acquired from Census of India, land use patterns, and inundation levels. The results illustrate in Sagar, the tidal height rise varies with the type of storms and quantum of local precipitation. Land use assessment indicates loss of native vegetation, increase in human-centric activities, such as housing and agriculture, resulting in increased exposure to inundation. A tide of 2 m amplitude beyond the high tide which frequently expose 32 km2 of cultivable landscapes (Agriculture and Horticulture), 5193 houses for the current time (2020), and by 2050 about 31 km2 of cultivable landscapes and 10,870 houses get exposed. With tides reaching 6 m threshold, 41,632 houses and 122,712 houses are likely to be exposed in 2020 and by 2050, respectively. The current approach and findings of this study pave the way for the governing authorities and planners to prioritize mitigative measures, strategies that are region specific to reduce the impact, and risks of coastal flood inundation due to natural hazards.
S. Vinay, H. A. Bharath
Chapter 18. Three-Dimensional (3D) Noise Pollution Visualization via 3D City Modelling
Abstract
Noise pollution is an excessive sound that can affect human health and environmental quality. There is a lot of research on environmental pollution, such as air and water pollution, but little research on noise pollution. People do not realize the potential of sound to pollute the environment. This research aims to visualize and provide noise-level information that can lead to noise pollution. The output of this research is the visualization of the noise level in 3 dimension (3D). A 3D geometrical database and the noise level are modelled and processed into a 3D environment. Due to insufficient noise pollution in 2D representation, this chapter presents a 3D noise visualization approach as it offers significant insight into situations where 3D noise effects are relevant.
Muhamad Uznir Ujang, Nurul Qahirah Dzulkefley, Suhaibah Azri, Syahiirah Salleh
Chapter 19. Decadal Satellite Data Analysis for Flood Hazard Mapping: A Case Study of Eastern Uttar Pradesh
Abstract
Flood is a natural havoc faced in many parts of India. The districts of eastern Uttar Pradesh falling under the Rapti river basin are most vulnerable to and severely affected by flood. Assessment of flood inundation and flood water stagnation has been conducted for a decade from 2008 to 2018 by using satellite datasets. Vulnerability analysis for flood-affected areas is based on the RADARSAT data available during monsoon season. The Synthetic Aperture Radar dataset has been used together with the hydrological data for estimating the period of stagnation, recurrence of flood hazards, and flood inundation. The changes in frequency of floods and its severity and the spatial extent of flood-affected areas from 2008 to 2018 have been determined from the analysis of the organized flood hazard database with spatial extent in GIS. Among the 14 districts of Rapti River basin, seven are found to be most vulnerable and heavily affected by the flood hazard viz. Gorakhpur, Shravasti, Maharajganj, Balrampur, Siddharthnagar, Deoria and Sant Kabir Nagar. Spatial intersection technique has been implemented in GIS to determine the stagnated flood water areas.
Suchita Pandey, Nilanchal Patel, Ajay Kumar Agrawal
Metadaten
Titel
Application of Remote Sensing and GIS in Natural Resources and Built Infrastructure Management
herausgegeben von
Vijay P. Singh
Shalini Yadav
Krishna Kumar Yadav
Gerald Augusto Corzo Perez
Francisco Muñoz-Arriola
Ram Narayan Yadava
Copyright-Jahr
2022
Electronic ISBN
978-3-031-14096-9
Print ISBN
978-3-031-14095-2
DOI
https://doi.org/10.1007/978-3-031-14096-9