The efficient markets hypothesis states that stock prices incorporate all relevant information instantaneously. However, investor behaviour is not always fully in line with theoretical predictions. The mechanism behind efficient markets is that a sufficient number of analysts pay attention to newly arriving information, judge it value relevant, and trade on that information. In that way, the new information gets priced in. But there is evidence that learning takes time and that adaptive markets are a better description than efficient markets. In particular, it seems that analysts have been slow to pick up sustainability-related information.
Moreover, stock prices only reflect the effects of (sustainability-related) information on the financial value of companies. There is no ‘market’ (yet) for the diffusion of information on the social and environmental value (impact) of companies. New regulations, scientific research, non-governmental organisations (NGOs), and ratings agencies do produce information on companies’ social and environmental impact. They create implicit markets on impact information and price-setting that are continuously evolving. These markets can be used to determine the willingness to pay for impact (and thus derive prices for impact). At the same time, a new breed of impact investors is emerging. These investors look for financial return (profit) as well as impact and may be willing to sacrifice some part of their financial return for higher impact.
Overview
The idea that capital markets are information efficient is the bedrock of modern finance. The efficient markets hypothesis states that stock prices incorporate all relevant information instantaneously. An example is the interest rate announcements of central banks. If the announcement is in line with market expectations, not much happens. An unexpected interest rate rise or decline leads to an immediate stock market response. Similarly, companies make announcements about important events with a potential effect on earnings outside stock market hours, so that all investors have time to digest the implications. The consequence of the efficient markets hypothesis is that investors cannot consistently beat the market.
Investor behaviour is not always fully in line with theoretical predictions. For example, individual investors tend to own a few stocks with which they are familiar, leaving them undiversified. Both individual and professional investors trade too much, leading to high transaction costs without commensurately higher returns. An important anomaly is the existence of bubbles, whereby prices are for a (long) period of time above their ‘normal’ or fundamental values. Behavioural finance seeks to explain this irrational exuberance.
Anzeige
The mechanism behind efficient markets is that a sufficient number of analysts pay attention to newly arriving information, judge it value relevant, and trade on that information. In that way, the new information gets priced in. But there is evidence that learning takes time and that adaptive markets are a better description than efficient markets. In particular, it seems that analysts have been slow to pick up sustainability-related information. Only after the high-profile Paris climate conference in 2015, have carbon emissions begun to be priced in to some degree. It is not yet clear to what extent other environmental factors, like water scarcity and biodiversity loss, and social factors, like labour practices across the value chain, are reflected in stock prices. The adaptive markets hypothesis states that the degree of market efficiency depends on an evolutionary model of individuals adapting to a changing environment. So, the more analysts start to pay attention to an issue, the more and faster it will be priced in.
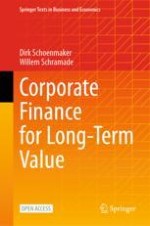
However, stock prices only reflect the effects of (sustainability-related) information on the financial value of companies. There is no ‘market’ (yet) for the diffusion of information on the social and environmental value (impact) of companies. New regulations, scientific research, non-governmental organisations (NGOs), and ratings agencies do produce information on companies’ social and environmental impact. Implicit markets on impact information and price-setting are evolving: product markets partly reveal consumer preferences for sustainable products; capital markets partly reveal investor preferences for impact investing; and elections partly reveal voter preferences for sustainable policies. These markets can be used to determine the willingness to pay for impact (and thus derive prices for impact). This is all very relevant to companies as well. Chapter 17 explains that reporting regulations are going to require companies to report on their impact alongside their financials. Finally, a new breed of impact investors is emerging. These investors look for financial return (profit) as well as impact and may be willing to sacrifice some part of their financial return for higher impact. See Fig. 14.1 for a chapter overview.
A chart presents 4 sub-topics of the chapter as sustainability unawareness, including the basics and valuation of private equity, E S G integrated or inward view, the impact of S and E in private equity, and integrated value in private equity. On the right, a chart provides an overview of Chapter 14.1.
Fig. 14.1
Chapter overview
×
Learning Objectives
After you have studied this chapter, you should be able to:
explain how information is processed into stock prices
critically reflect on the information efficiency of markets
appreciate anomalies in the behaviour of investors
contrast the efficient markets and adaptive markets hypotheses
identify the impact perspective and the role of impact investors
14.1 Efficient Markets Hypothesis
Stock prices are one of the most closely followed news items. News bulletins frequently include an update on the change in the Dow Jones index or the leading stock market index in your country. That raises the question of whether stock prices can be predicted: can a pattern or price cycle be discerned? An important premise of finance is that there are no patterns in stock prices according to the efficient markets hypothesis (explained below). Stock price changes are random: tomorrow’s stock price has an equal chance of going up or going down (Kendall, 1953). Such a random walk can be generated by tossing a coin: heads—the price goes up; and tails—the price goes down.
Anzeige
Assuming an underlying expected monthly return of 0.5%, stock prices follow a random walk with a positive drift of 0.5% per month. In statistical terms, a random walk means that subsequent price changes are independent of each other; just like tossing a coin. Even after 20 times in a row of getting ‘heads’, the chance of heads in the next toss remains exactly 50% (independent from the previous tosses). So, the pattern of past stock prices does not contain information about tomorrow’s stock price.
The premise that stock prices follow a random walk means that stock prices cannot be predicted. Otherwise, investors anticipate price changes and make easy profits. The idea is that competition between investors eliminates profit opportunities. The result is that bonds and stocks are fairly priced. In this line of thinking, an investor can’t outperform the market. Market anomalies should not exist because they will immediately be arbitraged away. However, we discuss some exceptions in Sect. 14.2.
Efficient Markets Hypothesis
The idea that investors cannot use information from past stock prices to predict future stock prices means that markets are information efficient. The efficient markets hypothesis states that stock prices incorporate all relevant information instantaneously. Eugene Fama (1970) distinguishes three forms of market efficiency:
A chart outlines different levels of market efficiency. In a strong market, prices reflect information obtained through fundamental analysis. In a semi-strong market, prices reflect both past prices and public information. In a weak market, prices reflect all available past information.
×
Weak market efficiency is already explained above. Stock prices have to follow a random walk. If not, investors could make a profit from analysing past stock prices (e.g. through technical analysis of stock prices on a chart). But in competitive markets, such profits cannot last and will thus be competed away. The result is that changes in stock prices cannot be predicted. The information in past stock prices is already incorporated in today’s stock prices.
The next step is to extend this idea to all publicly available information. This includes information from the financial press (e.g. financial newswires like Reuters and Bloomberg and financial newspapers like the Financial Times) and more broadly from the internet. Again, the semi-strong form of market efficiency states that investors cannot make persistent profits based on this public information, as competition will eliminate these profits. Boxes 14.1 and 14.2 show how important financial information is immediately incorporated in stock prices. Example 14.1 demonstrates how the expected stock price move from a take-over announcement can be calculated.
Box 14.1 Interest Rate Announcements by Central Banks
Interest rates and stock prices are both important for economic growth. When central banks fear that the economy is getting overheated leading to inflation, they will try to slow down the economy and inflation expectations with a rise in interest rates. Such an interest rate rise has a negative impact on future profits and increases the discount factor; both factors reduce stock prices. Interest rates and stock prices are generally speaking negatively correlated.
Thus, interest rate announcements have a major impact on stock prices. Central banks therefore follow a strict protocol on announcing their interest rate policy. The European Central Bank (ECB), for example, has a 6-week schedule for their monetary policy meetings on Thursdays, whereby the press release of the interest rate decision is at 13.45 and the subsequent press-conference of the ECB president at 14.30. The monetary policy meeting dates and announcement times are published well in advance on the ECB website.
In the run-up to the meeting, the market speculates on the ECB’s decision. When the decision is in line with market expectations, the stock market does not move. An unexpected interest rate rise (or decline) leads to an immediate reaction in stock prices, which adjust more or less instantaneously. This adjustment will be paired with some heightened volatility to arrive at the new market equilibrium of expectations. Fierce competition among stock traders ensures that there is limited to no opportunity to gain from the interest rate announcement.
Securities regulations force companies to publish information that can potentially move the stock price (e.g., earnings announcements or takeovers) (a) outside trading hours and (b) as widely as possible (e.g., through a press release). Investors then have time to digest the new information and have equal access to the information. Moreover, securities regulations forbid spreading rumours (i.e., false information) about companies in order to manipulate the stock price. An investor can easily talk up a company’s stock price with favourable rumours, ahead of their planned sale of the company’s stock, and vice versa.
Box 14.2 Takeovers and Market Efficiency
On December 1st, 2020, the Cloud computing giant, Salesforce, announced the acquisition of Slack Technologies for $27.7 billion dollars. Salesforce strove to expand their remote work activities via the communication platform Slack. On the announcement date, the stock price of Slack jumped 38%, revealing new information to the market according to the efficient market hypothesis. The share price immediately converged to the bid price, given the fact that Slack shareholders received $26.79 in cash and 0.0776 Salesforce shares. Also, there seems to have been some information leakage prior to the announcement, given that the stock price increased by 22%. The Cumulative Abnormal Return (CAR) shows the deviation of Slack’s realised return (on the announcement date) from its expected market return. The expected market return can be calculated with the standard CAPM market model. The figure shows that the total CAR of Slack amounts to 60%. The CAR after the announcement date is close to zero.
A line graph plots the cumulative abnormal returns % versus event time. The line for the risk-adjusted return model rises from 2%, reaches 60% at 0, rises to 70%, and fluctuates slightly. A vertical line lies at 0.
×
Example 14.1 Calculating the Expected Stock Price Change
Problem
Suppose a company with a $50 billion market capitalisation announces the takeover of a smaller competitor. The expected NPV of the takeover is $700 million (this is the NPV for the acquiring company after paying a possible take-over premium; see Chap. 18). If markets are strongly efficient, what will be the stock price effect of the announcement for the acquiring company?
Solution
Strong efficiency implies that the market correctly estimates the NPV of the takeover on its announcement. Therefore, the acquiring company’s stock price will rise by 0.7 billion/50 billion = 1.4%.
The final step is to expand market efficiency to all information, including information from fundamental analysis and inside information. Some investment analysts conduct fundamental analysis of companies with a full DCF model, as explained in Chap. 9. The strong form of market efficiency argues that these fundamental analysts cannot outperform the market. This is a very ‘strong’ statement. It means that there is no added value from fundamental analysis, while this analysis is costly to do. We come back to the role of fundamental analysis (and its cost) in this section and later sections.
Again, securities regulations forbid company insiders to trade on private information. Insider dealing is a criminal offence, although extremely difficult to prove in a criminal court. These rules also prescribe strict procedures for contacts between company management and (fundamental) investors. Company management is not allowed to give stock-price sensitive information to individual investors or small groups of investors. Companies therefore organise analyst calls, which are widely accessible to investors, to update investors on strategy, earnings outlook, etc.
The Paradox in the Efficient Markets Hypothesis: The Need for Active Investors
Interestingly, the efficient markets hypothesis has a contradictory element in it (Grossman & Stiglitz, 1980). Taking its consequences literally, all investors will be passive, as active trading strategies and information acquisition do not pay off in informationally efficient markets. At the same time, we need active investors to acquire and process information to update market prices (the process of price discovery). Information acquisition and processing are costly. So, who will provide this costly service with no benefit?
French (2008) compares the fees, expenses, and trading costs that society pays to invest in the US stock market with an estimate of what would be paid if everyone invested passively. Averaging over 1980–2006, French finds that active investors spend around 70 basis points (0.7%) of the aggregate value of the market each year searching for superior returns. This 70 bp amounts to almost 10% of market returns. However, there is no benefit to this expenditure, as active investors earn by definition the market return on average. Some are lucky and earn a bit more, and some are unlucky and earn a bit less. However, it is impossible to outperform the market on a persistent basis according to the efficient markets hypothesis.
As active investors can ‘on average’ not increase their return with active trading strategies, they could improve their returns by 70 basis points if they switched to a passive market portfolio. We can observe a move to passive investment strategies by large asset managers, such as BlackRock, Fidelity, and Vanguard. Nevertheless, active investors are needed for price discovery and thus provide a service to society. Price discovery is crucial for markets to play their allocational role: good companies can more easily raise new capital because of higher stock prices, while badly performing companies find it increasingly difficult to raise fresh capital because of declining stock prices and may ultimately disappear in the process of creative destruction (Schumpeter, 1942).
The upshot is that markets can only be close to efficiency, because some (small) profit opportunities are needed for active investors. It is an open question how many active investors are required to keep markets efficient. Further evidence for and against market efficiency is provided in the next section.
14.2 Investor Behaviour
Investor behaviour is not always fully in line with theoretical predictions of capital market efficiency. An important anomaly is the existence of bubbles, whereby prices are for a (long) period of time above their ‘normal’ or fundamental values. Behavioural finance seeks to explain this irrational exuberance.
14.2.1 Financial Investors and Capital Market Competition
To analyse investor behaviour, we need to know the investor’s goal function. The exclusively financially driven investor aims to maximise return and minimise risk. That is exactly what the CAPM is doing. As explained in Chap. 12, the CAPM constructs portfolios of stocks with maximum return given risk. The required return of individual stocks ri from the CAPM is (Eq. 12.15):
Equation 14.1 is the basis for the security market line in Fig. 14.2. Now let’s enter investors’ expectations about stock return and take the stock of Swiss nutrition company Nestlé as an example. Investors may, for example, expect a higher annual return on Nestlé of say 6.8% (due to good news about the company) than the required return of 4.8% according to the security market line. Figure 14.2 shows this difference between a stock’s expected return E[ri] and required return ri, which is called a stock’s alpha αi:
A graph illustrates the expected return versus beta. An upward slope implies that the security market line increases from 2% to 10%. The arrow points to the line's origin, indicating a risk-free rate. Nestle and Apple's dots are (0.6,7%) and (1.2,4.1%), respectively. Alpha is the distance between the slope and the dots.
Alpha is a measure of the active return on an investment and measures the performance of an investment compared with a suitable market index (a real-world proxy for the theoretical security market line). Combining Eqs. 14.1 and 14.2, we can write out the stock’s expected return:
Smart investors see the opportunity of buying Nestlé with an expected return of 6.8%, while its required return (based on its risk profile) is only 4.8%. This trading will drive up Nestlé’s stock price until the expected return arrives at 4.8%, back on the security market line. The same will happen to the Apple stock in Fig. 14.2. As Apple’s expected return of 4.2% is lower than its required return of 6.3%, investors will sell Apple until the expected return rises to 6.3%. In competitive markets, all stocks are on the security market line with an alpha of zero.
Paradoxically, while the CAPM suggests that all investors passively hold the market portfolio in equilibrium, efficient markets do require the presence of a significant number of active investors who try to beat the market. After all, the mechanism behind efficient markets is that a sufficient number of analysts pay attention to newly arriving information, judge it value relevant, and trade on that information. In that way, the new information gets priced in.
14.2.2 Behavioural Finance
But are all investors acting in line with the expectations of the CAPM model (i.e. investing in the market portfolio)? Behavioural finance looks into deviations from what we might expect from theory. Here, we discuss two major deviations. The first is the familiarity bias of individual investors, who tend to invest in a few stocks of companies they are familiar with. These are typically household names, like Apple, Nike, and McDonald’s in the USA. In Europe, this is often still country specific: Unilever, Shell, and GlaxoSmithKline in the UK; Volkswagen, Siemens, and Adidas in Germany; Danone, Carrefour, and LVMH in France; and Philips, Heineken, and ASML in the Netherlands.
The familiarity bias often results in portfolios with less than ten stocks. Retail investors may thus fail to diversify their stock portfolio appropriately. This limited diversification (which is not in line with the CAPM) is evidence of irrational investor behaviour. It should be noted that not all retail investors hold portfolios of individual stocks. Well-diversified exchange-traded funds (ETFs) and actively managed mutual funds have become popular among retail (and professional) investors.
Another deviation from theory is excessive trading. Following (financially relevant) news, investors may enter into frequent trading of their stocks. Such frequent trading gives rise to high transaction costs, which reduces net investment returns (gross investment returns minus transaction costs). When a broker excessively trades a client’s account (beyond the agreed investment objectives), this is called churning, which is forbidden by securities law. Excessive trading is not only done by retail investors, but also by professional investors. The annual stock turnover on the largest stock exchanges is well over 100%, which means that all shares change hands at least once every year (on average). Excessive trading is also not in line with the CAPM and evidence of irrational investor behaviour. In efficient markets, there is no need for frequent (and costly) trading.
14.2.3 Bubbles
In efficient markets, stock prices should trade in line with a company’s fundamentals. A company’s fundamental value can be estimated with a DCF model, as explained in Chap. 9. A company with good prospects has a higher (fundamental) value than an otherwise similar company with less favourable prospects. CAPM is good at relative pricing of stocks (i.e. relative to each other), but not at absolute pricing (i.e. the height of the stock price).
The pricing of stocks in CAPM is based on homogeneous expectations (see Box 12.2). What happens when investors collectively believe that the outlook is more favourable? Shiller (2000) has coined the term irrational exuberance which refers to investor enthusiasm that drives asset prices higher than those assets’ fundamentals justify.
A famous example of such irrational exuberance is the dotcom bubble, when investors had high expectations about the internet and valued internet companies at very high prices, even in the absence of profits and clear business models. Figure 14.3 shows the NASDAQ Composite Index, where many of these internet companies were listed. The NASDAQ increased from 750 in early 1995 to 4700 in February 2000, when the dotcom bubble burst. The NASDAQ subsequently fell back to 1170 in September 2002. With hindsight, bubbles are easy to spot, but at the time—when the frenzy takes hold—it may be difficult to identify overvalued companies or sectors. And even if one can identify a bubble, it can still go on for a long time. As Keynes famously said: the market can remain irrational far longer than you can remain liquid.
An area graph illustrates the trajectory of the dot-com bubble. It spans from 0 to 900 and shows a gradual increase reaching 5000 around 2000, followed by a subsequent decline. Approximated values.
Fig. 14.3
The dotcom bubble, NASDAQ Composite Index, 1995–2002. Source: Nasdaq
×
Shiller developed a cyclically adjusted price-to-earnings ratio (CAPE) as a measure of over- or undervaluation of the market (Siegel, 2016). CAPE is defined as price divided by the average of 10 years of earnings (moving average), adjusted for inflation. The ratio is used to gauge whether a stock, or group of stocks, is undervalued or overvalued. At an average CAPE ratio of 15 for the twentieth century, a high CAPE ratio of 25 indicates overvaluation and is linked to ‘irrational exuberance’. Such a high CAPE ratio of 25 happened in 1929 (preceding the Great Depression), in 1999 (preceding the dotcom bubble), and in 2007 (preceding the Global Financial Crisis).
Incentives in the financial system, such as credit ratings paid by the issuers of securities and investment banks paid in fees for developing structured products, can contribute to overtrading and overvaluation of certain companies or products. This happened in the Global Financial Crisis of 2007–2009, when the banking system in the USA and Europe collapsed due to problems in the US housing market. The focal point of the crisis was the unravelling of the Sub-Prime Mortgage market (which was fuelled by rating agencies and investment banks), but the underlying cause was the decline in US house prices.
More general, over- and under-investment in new companies and new technologies is of all ages. There are always some stocks that are trading at very high prices, but these are individual cases. The concept of a bubble is a collective overvaluation of sectors or companies by investors. As discussed, the spotting of bubbles in real time can be difficult. And when spotted, it can still take quite some time before they burst.
14.3 Adaptive Markets Hypothesis and Sustainability Integration
Andrew Lo (2004, 2017) provides an alternative description of markets. His adaptive markets hypothesis states that the degree of market efficiency depends on an evolutionary model of individuals adapting to a changing environment:
Based on evolutionary principles, the Adaptive Markets Hypothesis implies that the degree of market efficiency is related to environmental factors characterising market ecology such as the number of competitors in the market, the magnitude of profit opportunities available, and the adaptability of the market participants.
Unlike the efficient markets hypothesis, the adaptive markets hypothesis allows for:
path dependencies;
systematic changes in behaviour; and
varying risk preferences.
It also means that the current state of markets maximising financial return subject to financial risk only may not last. Changing practices of market participants could result in social and environmental factors being priced in. But it will be an evolutionary process to get there. The speed of the process depends on the number of fundamental analysts covering these factors. The adaptive markets hypothesis can explain why new factors, such as social and environmental risks and opportunities, are not yet fully priced in, because not enough investors are examining these new factors and/or are expecting sustainable material risks to lead to financial effects.
Capital markets still have to adapt to sustainability-related information. The question is how to get sustainability-related information embedded into stock prices. This is the inward perspective as illustrated on the left side of Fig. 14.5 (in Sect. 14.4 below). There is evidence that analysts are slow to pick up sustainability-related information. Only after the high-profile Paris climate conference in 2015 are carbon emissions starting to be priced in. It is not yet clear to what extent other social and environmental factors, like labour practices across the value chain, water scarcity, and biodiversity loss, are reflected in stock prices.
In an adaptive market process, the social and environmental dimensions might become incorporated into investment allocation, as market participants start seeing and pricing their financial relevance. An investment analyst needs to investigate the materiality of social and environmental factors and their impact on an investee company (see Chaps. 2 and 5).
14.3.1 Transition Preparedness
As the UN Sustainable Development Goals are about transition, an investor needs to know how well or ill-prepared an investee company is: can the company’s business model be adapted to a sustainable economy? Such preparedness can be assessed at the industry and company level (see Chap. 2). This means that one needs an expert, like a fundamental analyst, to make a judgement call about a company’s preparedness.
Another implication of a renewed focus on companies and their preparedness is that the traditional tools do not suffice. Investors have to look at companies through a different lens and go beyond traditional financial statement analysis. Inserting ESG ratings does not measure companies’ preparedness for transition, as argued in Box 14.3. Rather, one needs to adopt new tools and data (and often invent them) to really assess the earlier-mentioned transformational challenge and its impact on the company’s value. This includes considering social and environmental factors in their own units, investigating governance and behaviour, and assessing their impact on companies’ strategies and business models. It is also helpful to apply advanced models like real option analysis to deal with the fundamental uncertainty of transitions (see Chap. 19).
The transition preparedness’ assessment requires an in-depth fundamental analysis of companies. Over time, sustainability reporting is expected to increase with new reporting initiatives like the EU Corporate Sustainability Reporting Directive and the International Sustainability Standard Boards, as explained in Chap. 17. With this increased information, markets will adapt and thus become more efficient. Accordingly, ESG ratings are expected to improve and more quant or passive investment strategies may work. Figure 14.4 provides a dynamic picture of the availability of qualitative and quantitative ESG data. The lack of available data is currently very large, but should diminish over time in line with the adaptive markets hypothesis, with pockets of poorly used (and poorly available) data as inefficiencies and opportunities to be exploited. Section 14.2 introduced the concept of alpha—return on active investment exploiting market inefficiencies. Increased attention for, and competition in, gathering socially and environmentally relevant information will reduce alpha to zero.
A schematic chart overlays quantitative and qualitative data. Three connected axes lines are labeled and included in E S G ratings, sustainability reports currently, and sustainability reports soon. Above the lines are dispersed squares. A set of lines develops from a point on the upper right to connect the squares.
Fig. 14.4
The increasing availability of ESG data
×
Box 14.3 Limitations of ESG Ratings
To analyse companies’ sustainability profiles, ESG ratings have been developed. ESG rating agencies like MSCI, Sustainalytics, Refinitiv (Asset4), and ISS (Oekom) score thousands of companies on several sustainability metrics within the E (environmental), S (social), and G (governance) domains. They provide scores and reports at the company level, to be used by investors with a subscription to their services. Typically, ESG ratings help indicate a company’s level of environmental, social, and governance risks. Therefore, it is important to understand that these ratings only indicate a company’s inward (risk) impact and don’t indicate the outward impact of the company in terms of ESG.
The rating agencies use publicly available information (i.e. from ESG reports) to determine the ratings, but can additionally use non-public information shared privately by the company with the agency to enhance the quality of the ratings. For example, Sustainalytics’ ESG Risk Rating can be a ‘core’ rating, which means it only uses publicly available information; or a ‘comprehensive’ rating, which means it received additional information directly from the company to improve the agency’s understanding of the company’s internal ESG risk management.
The advantage of these ESG ratings is that they provide investors with a quick approximation of a firm’s ESG risk, just like a price-earnings ratio provides investors with a quick view on a firm’s valuation (see Chap. 9). The disadvantage of ESG ratings is that they are difficult to compare, since each rating agency uses a methodology which differs in terms of scope and measurement (Berg et al., 2022).
The ESG rating methodology, at least for Sustainalytics and MSCI, contains an Exposure score and a Management score. The Exposure score depends on the operations of a company and its inherent risks (e.g. an oil company has higher exposure to ESG risks than a HR company) and typically cannot be impacted by the company. Therefore, this Exposure score is usually similar for firms operating in the same industry and sector. The Management score is associated with the firm’s management of its ESG risks (e.g. for carbon emissions, does it have a decarbonisation strategy?) and can therefore be impacted by the company. This Management score is divided into several ESG issues which are deemed material for the company. This means that companies in different industries will be assessed based on different ESG issues.
Design limitations
The ESG rating methodology leads to a number of limitations by design. First, companies’ ESG ratings cannot really be compared unless the company is operating in the same industry and has the same ESG issues (as determined by the rating agency). Second, there is no universally defined framework for deciding which ESG issues are material and how they should be weighted, which means rating agencies can assign different ESG issues for the same company and end up with a completely different rating. Third, as mentioned the rating only takes into account inward impact and not outward impact, which means companies with a lot of negative externalities can still have good ratings if they are (so far) good at protecting themselves from ESG risks.
14.4 Impact Perspective
The adaptive markets hypothesis states that social and environmental risks are increasingly incorporated in stock prices, as more parties in the market pay attention to these risks (top horizontal arrow in Fig. 14.5). That is the inward perspective. But what about the impact of companies on society and nature? This outward or impact perspective on sustainability (bottom horizontal arrow in Fig. 14.5) is not reflected in stock prices, which represent the financial value of companies. The impact dimension embodies the social and environmental value of companies, separate from financial value. It should be noted that, while these types of value can be calculated independently, they tend to be interdependent (see Chap. 2). This section discusses the main producers of impact information; impact pricing; and impact performance measurement.
A schematic of two circles. The left circle depicts the business and financial value impacting financial information and prices. The right circle exhibits society and nature's impact on information and prices. Arrows between the circles represent inward dependencies and impacts.
Fig. 14.5
Financial and impact perspectives on information and price formation
×
14.4.1 Impact Information Producers
Academic research has produced the planetary and social boundaries, introduced in Chap. 1. These overall boundaries show how we can keep the Earth system in a stable and resilient state. The aim is to safeguard Earth’s life support systems while ensuring that Earth’s benefits, risks, and related responsibilities are equitably shared among people. The Earth Commission, a group of leading scientists, assess the latest science to define a safe and just corridor for people and planet and underpin the development of science-based targets for systems like air, land, water, and biodiversity (Rockström et al., 2021). Although ‘safe’ and ‘just’ Earth system targets are interrelated, safe targets refer primarily to a stable Earth system and just targets refer to meeting human needs.
These scientific Earth system targets can be translated into science-based targets for actors, like nations, cities, and companies. While the science-based targets are aligned with scientific evidence, they may involve negotiations based on responsibility and feasibility (Andersen et al., 2021). In our case, this means practical downscaling of global scientific targets to specific science-based targets for sectors and companies. Box 14.4 provides an example of the application of science-based targets to reduce carbon emissions. Science-based targets make use of statistical agencies that produce impact information at country and sector level. Eurostat, the European statistical agency, produces, for example, detailed data on carbon emissions by country and sector.
Box 14.4 Applying Science-Based Targets
There are several alliances of investors, banks, and companies that aim for a net zero carbon 1.5 °C-aligned world. These alliances translate the planetary boundary of 1.5 °C global warming into specific targets for each of these groups. For example, more than 3000 businesses and financial institutions are working with the Science-Based Targets initiative (SBTi) to reduce their emissions in line with climate science. These companies are setting targets for reducing carbon emissions. These targets encompass both near-term targets for the next 5–10 years and long-term targets to achieve net zero by 2040/2050.
For example, in its 2022 annual report, Inditex discusses its 2040 net zero target, and its use of SBTi.
Non-governmental organisations (NGOs) are organisations that produce impact information, which is mostly about negative impacts. Amnesty International, for example, publishes overviews of human rights abuses by companies and governments across the world in their annual surveys and specialised reports. Box 14.5 provides an example. In a similar way, the World Wildlife Fund (WWF) is the source for information on company impact on biodiversity loss and the Carbon Disclosure Project (CDP) for company’s carbon emissions. In addition to the large well-known NGOs, like Amnesty, WWF, Greenpeace, and Oxfam, there are smaller NGOs. Box 14.6 shows the role of such a smaller NGO in exposing companies and banks linked to deforestation.
Box 14.5 Amnesty International on Oil Spills
In Bodo Creek in Ogoniland, Nigeria, two oil spills (August/December 2008) destroyed thousands of livelihoods. Oil poured from faults in the Trans-Niger Pipeline for weeks, covering the area in a thick slick of oil. Amnesty International and their partner, the Centre for Environment, Human Rights and Development, worked with the community to get the oil company responsible—Shell—to clean up its mess and pay proper compensation. Finally, in December 2014, the Bodo community won a long-awaited victory when Shell paid out an unprecedented £55million in compensation after legal action in the United Kingdom.
Agriculture is the main cause of deforestation. Cattle (beef), palm oil, and soy are the most important agricultural commodities contributing to land-use linked to deforestation. Global Witness (2021) has identified the top three companies active in these agricultural commodities:
1.
Cargill, the largest agricultural commodity trader of soy and beef, based in the USA;
2.
JBS, the leading exporter of beef from South America, based in Brazil;
3.
Wilmar, the largest refiner and trader of palm oil, based in Singapore.
While the annual reports of these companies contain statements that most, if not all, of their commodities are deforestation free, the reality is that these companies are major contributors to deforestation. NGOs, like Global Witness, are needed to produce this information. Global Witness (2021) also highlights the role of banks financing these companies. Again, these leading banks have statements on zero-deforestation policies in their annual reports.
Although the impact information produced by NGOs is highly valuable, it also has its limitations. NGOs (rightly) focus their attention on the worst offences, but they do not provide systematic coverage of the universe of listed companies. And only to a certain extent does their data find their way into datasets that do have such universal coverage. For example, Bartels and Schramade (2022) point out that human rights data in ESG ratings reports is limited and does not allow investors to make a good assessment of the damage being done, nor of its mitigation.
Reporting regulations are starting to require companies to report on impact information. Chapter 17 discusses these reporting regulations in detail and shows some examples of impact reporting by companies.
Rating agencies are also increasingly becoming producers of impact information. These are the traditional credit rating agencies, which have started to include sustainability into their credit risk analysis (see Chap. 8). And, of course, the ESG rating agencies, discussed in Sect. 14.3. There is a shift from measuring ESG risks (inward) to SDG impacts (outward). Oekom, a leading ESG rating agency, publishes, for example, SDG impact ratings of companies.
While the NGOs are providing broad ranging reports on impacts, rating agencies are starting to use this information in their analysis of specific companies. Moody’s has, for example, made an analysis of the reputational risk of deforestation (see Box 14.7).
Box 14.7 Moody’s on Reputational Risk of Deforestation
Moody’s (2021) notes that the main cause of deforestation is the conversion of forests for agriculture. In their report on Latin American and Caribbean corporates, they list the cattle-raising company, JBS, as one of the main culprits. Moody’s argues that deforestation and other climate-related risks can quickly become material to credit quality if societal and regulatory scrutiny intensifies. These concerns include reputational risks and reduced revenue from boycotts and bans. JBS is also one of the main companies identified by Global Witness (Box 14.6). Although Moody’s analysis is still an example of risk (the inward perspective), it shows that negative impacts are being highlighted by the rating agencies.
Ratings agencies complement NGOs by processing their data in a more investor friendly format for a wider investment universe. However, they do not yet fulfil their potential of doing it in a systematic way that allows investors to assess the effect on EV and SV. The data are still mostly limited to policies and past actions rather than quantified in units that are building blocks of EV and SV.
So far, we have discussed the production of negative impact information. An even-handed analysis would show the positive as well as the negative impacts of companies. As shown in previous chapters, this can be done—and some companies actually do this. The Big Four accounting firms (Deloitte, KPMG, PwC, and EY) have set up impact measurement divisions in their consultancy wing. Under brands like True Value (KPMG), these impact measurement divisions provide an integrated analysis of a company’s value covering financial, social, and environmental value. There are also specialist impact consultants, like Impact Institute. These impact consultants measure impact and apply shadow prices for impact to monetise social and environmental value (see Chaps. 5 and 17).
A good impact analysis meets the following criteria:
Holistic: it covers all material impacts, positive and negative; no cherry-picking;
Material: it focuses on material impacts avoiding distraction by immaterial issues;
Comprehensible: it is written in a concise and accessible way;
Assurance: it is reviewed by a certified audit firm.
As companies have a bias towards reporting good news and omitting bad news (‘the good news show’), assurance of impact reports is crucial. Assurance (or audit) is the independent review of company accounts by a certified audit firm. There is already an established tradition of auditing a company’s financial reports (see Chap. 17), which should provide clues for auditing a company’s impact information.
As stated in Chap. 5, measuring SV or EV takes a three-step process:
1.
Determining material S and E issues
2.
Quantifying the S and E issues in their own units (Q)
3.
Putting a monetary value on those S and E units with shadow prices (SP)
The third step of pricing is discussed in the next sub-section.
14.4.2 Impact Markets and Pricing
Impact prices should reflect the ‘true scarcity’ of resources or the ‘true price’ of human right breaches. These impact prices are also called shadow prices, as they don’t reflect current market prices but ‘shadow’ true prices. Consultants, like the Impact Institute, produce regularly updated lists of impact prices (called monetisation factors) for a whole range of social and environmental factors (IEF, 2022). Chapter 5 explains how these monetisation factors can be applied in impact measurement and valuation.
Impact prices translate the science-based targets from Sect. 14.4.1 into actionable inputs for a company’s decision-making and reporting. High impact prices, reflecting true scarcity, provide an incentive for companies to explore cheaper alternatives. Renewable energy, for example, is cheaper than fossil fuels, when the shadow carbon price is included in the analysis.
Markets reveal the preferences of their participants. By buying a certain type of product, consumers show their preference for this product and their willingness to pay. We review three ‘markets’ where participants (partly) pay for impact: product markets (consumers), capital markets (investors), and elections (voters). These markets provide an indirect way to assess impact prices, whereby prices are often still underestimated.
Product markets reveal consumer preferences for sustainable products and services—albeit in a distorted way, since unsustainable products are often not taxed for their negative externalities and are sometimes even subsidised such as in the case of fossil fuels and airline tickets. The transition model in Chap. 2 is built on shifting consumer demand for sustainable products and services. A shift in demand can set into motion the transition from unsustainable to sustainable products in an industry. See the example of the transition from combustion engines to electric cars given in Chap. 2. Product markets can be used to derive the price for social and environmental impact. However, consumers’ willingness to pay for impact has so far been limited to a small part of the population (Grant, 2020). Hence, one still needs thorough assessments of hidden costs and true prices such as is done by the Impact Institute.
In capital markets, one can examine investor preferences for impact investing, which aims for social and environmental value creation (impact) alongside financial value creation (profit). Impact investing data provides an indication of preferences for certain types of ‘impact-positive’ companies. In a similar way, engagement efforts (both on certain topics and on certain sectors) provide an indication of where impact can be improved. A recent trend is to investigate investors’ willingness to pay for impact by means of experiments (see Box 14.8): how much financial return are they willing to give up for a certain amount of impact? This is a mechanism to establish a price for impact (in the form of reduced financial performance).
Box 14.8 Willingness to Pay for Impact
Suppose a private investor has a €1000 investment that is expected to yield a 5% annual financial return, i.e., €50 per year. How much of that financial return is the investor willing to give up for impact?
The investor gets the following offer: switch to an investment that yields €10 per year less, but saves 1 tonne of CO2 per year. The hard part in assessing this offer is its poor comparability: how to trade off a €10 personal financial loss against saving 1 tonne of CO2 for the public good?
Assuming a €200 CO2 price per tonne, we can frame the choice much more intuitively: is the investor willing to give up €10 personal financial return for €200 in public return? And where is the cut off? How much public return needs to be generated per euro financial return given up? Let’s call this the willingness-to-pay ratio: personal financial return given up/additional public return generated. For example, the investor might want to give up €300 personal financial return for €5000 in additional public return. The willingness-to-pay ratio is then 300/5000 = 0.06. Most likely, this ratio will vary across people, with their present wealth, and with the amount of financial return already given up—i.e. the marginal willingness to pay is probably diminishing.
In the above example, we have assumed that (1) the investor knows the impact of the investment and that (2) the impact is non-negative. Typically, however, an investment’s impact is negative. And also typically, such an investor does not know the impact, and finding it out could be an eye-opener.
In a survey among pension fund participants, Bauer et al. (2021) find that two-thirds of participants are willing to invest sustainably, even when they expect sustainable investing to hurt the fund’s financial performance. A key reason is participants’ strong social preferences.
Another ‘market’ for impact is elections. In elections, voters reveal their preferences for policies, including sustainability policies (e.g. on carbon tax). Voting for certain parties can enhance, or hinder, support for sustainability policies. Box 14.9 shows how the 2019 elections for the European Parliament are behind the European Green Deal. A counterexample is the 2016 elections for the American president, which led to a (temporary) cancellation of the US participation in the Paris Climate Agreement.
Box 14.9 European Green Deal More Feasible Following Elections
Traditionally, the socialists, Christian democrats, and liberals form the largest parties in the European Parliament. In the 2019 elections, the greens gained more votes and emerged as fourth party. The European Commission invited a majority coalition of socialists, Christian democrats, and greens to support its policy programme. To secure a deal with the greens, the European Commission embarked on an ambitious green policy programme, the European Green Deal.
The overarching aim of the European Green Deal is for the European Union to become the world’s first ‘climate-neutral bloc’ by 2050. In addition to climate, the European Green Deal comprises a circular economy action plan and a farm to fork strategy (for healthy food and nature-positive agriculture).
As the production of impact information is further developed, we expect impact measurement and pricing to be improving over time. This process will be facilitated by requirements for companies to report on sustainability, such as the International Sustainability Standards Board and the EU Corporate Sustainability Reporting Directive (see Chap. 17).
14.4.3 Impact Performance
The planetary and social boundaries in Chap. 1 show the system thresholds within which companies should operate. However, current efforts to improve environmental and social impact are too incremental and fail to take a system approach (Thurm et al., 2018). As a result, we simply do not know whether individual companies are doing enough, or not; nor do we know by how much they are falling short. Instead, one could pursue context-based sustainability, which connects the micro (companies in a certain sector), meso (country), and macro (system) levels to determine individual company contributions. Such a system approach of thresholds and allocations has three steps:
1.
System level: determining the thresholds that should not be crossed; these thresholds are the planetary and social boundaries;
2.
Country level: allocating these thresholds to countries on an equal per capita basis; and
3.
Sector level: allocating resources to sectors and individual companies on a forward-looking basis.
The third and final step indicates a company’s normative impact NI, which is derived from the planetary and social boundaries. McElroy (2008) developed a footprint method to measure the sustainability performance SP of a company:
A company’s net actual impact AI is the final variable needed to calculate a company’s sustainability performance. Chapters 5 and 17 show how a company’s social and environmental impact can be measured and reported. Please note that the footprint method works with the original units of a variable (e.g. carbon emissions for climate change and wages for decent work). The SP scores work in the following way:
for environmental impacts: SPi ≤ 1 is sustainable; SPi > 1 is unsustainable.
for social impacts: SPi ≥ 1 is sustainable; SPi < 1 is unsustainable.
These opposite signs are consistent with doughnut economy proposed by Kate Raworth (see Chap. 1), which sets maximum values on negative environmental impacts (planetary boundaries) and minimum values on social impacts (social foundations). The SP score for environmental impacts means that a company’s emissions or water/land use should stay within environmental ceilings AIi ≤ NIi as \( {SP}_i=\frac{AI_i}{NI_i}\le 1 \) in order to operate in a sustainable way. The SP score for social impacts works the other way around: a sustainable company’s social outcomes should stay above social foundations AIi ≥ NIi as \( {SP}_i=\frac{AI_i}{NI_i}\ge 1 \).
The innovation of this system approach is that a company’s actual impact is measured against its normative impact derived from system thresholds. ESG ratings (see Sect. 14.3) measure at best components of the impact of a company (that is a part of the numerator of Eq. 14.4), but without relation to system thresholds (the denominator). The SP indicator puts a company’s performance in the appropriate context of the social or environmental system.
In principle, the sustainability performance indicator is static: it measures whether a company currently meets the sustainability threshold. It can be applied in a dynamic way to capture the transition perspective. While a company may currently transgress one or more sustainability thresholds, it can have transition potential. To assess a company’s transition potential, you need forward-looking estimates of a company’s social and environmental impacts. The new reporting standards require companies to report social and environmental targets, which are subject to a mandatory audit (see Chap. 17). For example, one can map not just a company’s current carbon emissions versus its budget, but also its future emissions in the next three decades against its future budgets (see Example 14.2 below). Ideally, future emissions will soon drop below future budgets.
14.4.4 Inditex Case Study
We can use the case study of Inditex, the fast-fashion retailer described in Chap. 11, to illustrate the application of the SP indicator to social impacts. Inditex is meeting social foundations at its headquarters and sales outlets, where Inditex pays appropriate salaries to its employees at or above the living wage SPInditex ≥ 1. However, Inditex fails to meet social foundations in its supply chain, where it pays salaries below the living wage to factory workers SPInditex < 1. On the environmental side, Inditex exceeds several planetary boundaries SPInditex > 1. On one planetary boundary, namely climate change, Inditex has set science-based targets with a pathway to reach net zero by 2040 (see Box 14.4).
14.4.5 Environmental Impact
Examples 14.2 and 14.3 show how the SP indicator can be applied to environmental impacts.
Example 14.2 Carbon Budget
Problem
Current efforts on carbon emission reduction are incremental. Companies can take a system approach towards climate change. Please explain (a) the relevant threshold for climate change based on the 1.5 °C limit, and (b) how this threshold can be allocated to a carbon pathway from 2020 to 2050 for the office of a German company.
You can use the carbon risk real estate monitor (CRREM) methodology for the building sector, which develops pathways to net zero in 2050: https://www.crrem.org/pathways/
Solution
(a)
In the 2015 Paris Agreement on climate change, countries reconfirmed the target of limiting the rise in global average temperatures relative to those in the preindustrial world to 2 °C (two degrees Celsius) and to pursue efforts to limit the temperature increase to 1.5 °C. Section 1.1 in Chap. 1 indicates that the global threshold is a remaining carbon budget of 500 giga tonnes (Gt) from 2020 onwards for the 1.5 °C scenario. The CCREM methodology uses a 468 Gt carbon emissions only budget from 2020 to 2050 for the 1.5 °C scenario. Note that the IPCC (500 Gt) and CRREM (468 Gt) figures are slightly different.
(b)
This global budget is allocated to the building sector on a global scale. The real estate proportion of the overall carbon budget is 19.5%. This is 91 Gt (= 19.5% * 468 Gt) for 2020 to 2050. The global budget for buildings of 91 Gt CO2 is allocated to countries based on the anticipated real estate stock (total m2) in those countries by 2050.
To measure and steer on actual performance of buildings, an emission intensity measure is used of CO2 per square meter. In 2020 the German intensity was 43 kg CO2/m2. For a company in Germany, this results in a decarbonisation pathway for its office, starting at the current intensity in Germany (43 kg CO2/m2 in 2020), following a gradual path to 15 kg CO2/m2 in 2030, 2 kg CO2/m2 in 2040 and 0 kgCO2/m2 in 2050.
This calculation requires detailed data (which CRREM has) and detailed calculations (which CRREM provides in an excel sheet). The aim of this example is to show that a global carbon budget can be allocated to a company, following the intermediary steps of a country budget and sector proportions.
Current sustainability practices on land use are incremental. Companies can take a system approach towards land-system change. Please explain (a) the relevant threshold for land-system change, and (b) how this threshold can be allocated to individual companies.
Solution
(a)
The system threshold for land-system change can be derived from the planetary boundaries framework in Chap. 1. Table 1.1 indicates that the planetary boundary (that is the system threshold) for forested land is 75%, while the current value is 62% and falling.
(b)
As the current level is below the system threshold, companies should avoid further deforestation (zero-deforestation). The allocation at industry and company level is thus zero-deforestation. This yields a normative impact on land-use of zero: NIi = 0. Using eq. 14.4 with the environmental ceiling \( {SP}_i=\frac{AI_i}{NI_i}\le 1 \), the actual impact on land-use should be equal or smaller than zero: AIi ≤ 0. So, companies should avoid deforestation at a minimum AIi = 0 and could strive for forest or land restoration AIi < 0 (please note that forest restoration AIi < 0 is the opposite of deforestation AIi > 0).
14.5 Impact Investors Looking for Integrated Return
A new breed of impact (or integrated) investors is emerging. This new breed started off as a niche with specialised impact investors, but it is now expanding to mainstream investors. Pension funds, as long-term investors, have started to expand the two-dimensional financial risk-return framework (i.e. the mean-variance framework of the CAPM in Chap. 12) to a three-dimensional risk-return-impact framework of integrated investing (Fig. 14.6). The rationale behind this trend is twofold:
1.
Impact: long-term investors see positive impact as a creator of long-term value and negative impact as a source of future risk (see Chap. 2);
2.
Responsibility: institutional investors feel the moral responsibility to invest responsibly and to be accountable to stakeholders (see Chap. 3).
A graph with the x, y, and z axes highlights the aspects of integrated investing. The x and y axes illustrate financial risk and integrated risk, respectively. The negative and positive sides of the z-axis indicate negative and positive impact returns, respectively.
Fig. 14.6
Integrated investing
×
Figure 14.6 shows the three-dimensional nature of the integrated investment framework: (financial) return, (social and environmental) impact, and (integrated) risk. Integrated risk is the risk of having a shortfall in financial return or a shortfall in impact (see Chap. 12 on risk-return analysis).
14.5.1 Impact-Adjusted Return
Impact investors look for financial return (profit) as well as social and environmental impact. Impact-adjusted return \( {r}_i^{iar} \) combines these dimensions: (1) capital gains (on stocks and bonds), dividend and interest; (2) monetised social impact (from Chap. 5); and (3) monetised environmental impact (from Chap. 5) during a given year, divided by invested capital:
The denominator is invested capital, which is a proxy for the financial value of the company. This reflects the idea that equity and bond investors ‘finance’ the company. This ratio reflects the investors’ ‘bang for their buck’ in the widest sense: what do they get in financial and impact benefits for the capital they invested? As explained in Chaps. 8 and 9, the financial value of the company is the enterprise value. The calculation of the impact-adjusted return is straightforward: just list the three value dimensions at the start of the year and the changes realised during the year. Table 14.1 provides an example of a company that is positive on all three dimensions (multivalue creation): both on starting value and on change during the year (realised profit and impact). As noted in Chap. 2, there are not many companies with such a profile. Table 14.1 calculates the return as △value for each separate value dimension—financial return, social return, environmental return—divided by invested capital. Table 14.1 shows that the impact-adjusted return for this company is 17.5%. The same result is obtained by filling in Eq. 14.5:
As this company has positive returns on its social and environmental dimensions, its impact-adjusted return (of 17.5%) is higher than its financial return (of 10%).
Table 14.2 shows a more realistic example: company Y with a mixed value creation profile: financially profitable, but still negative social and environmental value dimensions. Company Y’s financial return at 10% is higher than its impact-adjusted return at 5.0% (see Panel A of Table 14.2). The company is able to reduce its negative environmental impact to zero, but at a financial cost of 0.5. This action turns the tables: company Y’s financial return drops to 7.5%, while its impact-adjusted return improves to 7.5% (Panel B). A financially-minded investor would ask the company not to do the investment. By contrast, an impact investor would ask the company to do the improvement—and perhaps a long-term-oriented financially-minded investor would do so too. In this simplified example, it already becomes clear that the type of investor matters for companies (see Chap. 3): are companies encouraged to maximise shareholder value or to manage for integrated value?
Table 14.2
Company Y with mixed value creation
Dimension
Panel A
Panel B
Value
△ value
Return
Value
△ value
Return
Financial
20
2
10.0%
20
1.5
7.5%
Social
−1
0
0.0%
−1
0
0.0%
Environmental
−5
−1
20.0%
−5
0
0.0%
Invested capital
20
1
5.0%
20
1.5
7.5%
Note: Invested capital is the financial value
14.5.2 Inditex Case Study
Example 14.4 calculates the impact-adjusted return for Inditex. It shows that Inditex’s impact-adjusted return is 2.9%, well below its financial return of 6.1%. The lower impact-adjusted return reflects the overall negative annual social and environmental value flows of −€2.5 billion, which reduces the annual financial value flow (profit) of €4.8 billion by more than a half to €2.3 billion. So, there is big reduction in return.
Example 14.4 Computing the Impact-Adjusted Return of Inditex
Problem
Please assess Inditex’s financial and impact-adjusted return. The data for Inditex are provided in Table 11.18 in Chap. 11.
IV calculation
Value
Annual value flows
(Euro billions)
(Euro billions)
FV (enterprise value)
79
4.8
Positive SV
283
4.1
Negative SV
−137
−2.9
Negative EV
−183
−3.7
Invested capital
79
2.3
Solution
Taking the impact-adjusted return formula (Eq. 14.5), we can fill in the components:
The numerator takes the annual value flows in financial, social, and environmental value. We take the free cash flows of €4.8 billions (instead of the capital gains, dividend, and interest) for the financial value flows. The social and environmental value flows are also included in the right column. The denominator reflects the invested capital in Inditex of €79 billion in the middle column. The impact-adjusted return is 2.9%.
The financial return is \( \frac{4.8}{79}=6.1\% \). The financial return is higher than the impact-adjusted return.
14.5.3 Integrated Return
Impact-adjusted return changes only the numerator in Eq. 14.5: from financial profit to integrated profit (financial profit and impact) over the measurement period (often a year). Taking financial value for invested capital in the denominator is an intermediate step; this reflects the investor perspective. Another step would be to take integrated value for invested capital in the denominator; this reflects the societal perspective of all stakeholders. We then get integrated return \( {r}_i^{ir} \):
The denominator is now integrated value: IV = FV + SV + EV. Integrated return reflects thus the overall return from a societal perspective. Once investors get used to the new integrated value measure (used in the denominator), we expect that integrated return comes into vogue. In the meantime, impact investors use mainly impact-adjusted return.
14.5.4 Return on Active Ownership
The integrated return equation can guide impact investors’ action. If a company shows low performance (the numerator of Eq. 14.6) and/or has one or more negative value dimensions (the denominator of Eq. 14.6) in comparison with its peers in the same sector, an impact investor can demand a plan from the company to improve. This is called active ownership: the use of the rights and position as shareholder (‘owner’) to influence the activities or behaviour of investee companies.1 These plans to improve can be seen as transition pathways to restore a shortfall in performance or in a value dimension (see Chap. 2). The required plans can include new investments or hiving off a non-core division to improve the focus (and return) on core assets. If the company is not willing to act or is not improving, investors will increase pressure and may eventually demand removal of management.
Traditionally, financially-minded investors, like hedge funds, have been activist investors when they see (perceived) short-term financial underperformance, lack of focus, or underuse of assets. Having a more long-term orientation, institutional investors typically focus on environmental, social, and governance (ESG) issues in their engagement with companies (see Chap. 3). Active ownership is costly. So to determine the return on active ownership, we need to deduct its cost costao, as investors need to invest time in the engagements themselves, as well as in knowledge of:
1.
targeted sectors;
2.
relevant transitions affecting these sectors;
3.
relevant companies in targeted sectors.
The potential benefit is improved (long-term) financial, social, or environmental value; this boils down to improvement in integrated value that can be attributed to active ownership ΔIVao (though actual attribution to active ownership actions of individual investors is difficult in practice). The return on active ownership ROAO can then be defined as follows:
There is a need for a balanced approach in active ownership. Otherwise, some (financially driven) investors may want to improve financial performance at the cost of sustainability performance. The attempted takeover of Unilever by Kraft Heinz is a case in point, as highlighted in Chap. 18. And the other way around as well: there are limits to be minded in improving sustainability at the cost of long-term financial value creation. The integrated value measure of Eq. 6.3IPV = FV + b ∙ SV + c ∙ EV > 0 is the appropriate yardstick to assess overall value creation or destruction by activist investors or hostile takeovers. An interesting question is whether active ownership can bring about changes in the real economy. Box 14.10 provides a discussion.
Box 14.10 Transition in the Real Economy: Exogenous or Endogenous?
Active ownership by institutional investors can put pressure on companies to speed up the transition to sustainable business models. If successful on a large scale, investors can thus accelerate the transition to a new sustainable equilibrium in the economy (Kurznack et al., 2021). This would be an endogenously driven change in the economy. Endogenous means from inside the system.
By contrast, existing investing theories, like the CAPM, do not allow for the possibility of endogenous sustainability transitions bringing the economy to a new equilibrium. Investors hold the market portfolio in equilibrium. Shocks to companies’ financial, social, or environmental value are assumed to be exogenous, which means from outside the system. Any deviations from the CAPM equilibrium are called investor preferences, leading to ESG investors bidding up the stock price of high ESG companies today. The higher stock price leads in turn to lower expected returns tomorrow as the stock price is ultimately expected to move back to its original price in equilibrium (Pástor et al., 2021).
14.5.5 Impact Investors
Impact investors are a new breed of investors, who made a shift from focusing on financial return only to impact-adjusted return. These impact investors aim for financial return and social and environmental impact. Their behaviour differentiates from exclusively financially oriented investors. Impact investors are looking for ‘impact-positive’ companies with a positive financial return as well (Busch et al., 2021). The Global Impact Investing Network applies the following definition of impact investing:
Impact investments are investments made with the intention to generate positive, measurable social and environmental impact alongside a financial return. Impact investments can be made in both emerging and developed markets, and target a range of returns from below market to market rate, depending on investors' strategic goals.
Box 14.8 shows experiments to investigate investors’ willingness to pay for impact: how much financial return are they willing to give up for a certain amount of impact? While impact investors started off as niche players (less than 1% of the global AUM (assets under management) in 2016), they are growing very fast at a compound annual growth rate of 45% (see Table 14.3). Pension funds and insurance companies now also allocate parts, albeit very small ones, of their portfolio towards impact investing. Table 14.3 shows that impact investing accounted for 2.3% of global AUM in 2020, while the bulk of sustainable investing is in ESG integrated investing at 33% of global AUM. Remember that impact investing reflects the outward perspective, while ESG integrated investing only takes the inward perspective (see Figs. 14.1 and 14.5). The high compound annual growth of 45% over the last 4 years shows that impact investing is on the rise. For the impact dimension to come to full fruition, market participants need to adapt, as discussed in Sects. 14.3 and 14.4.
Table 14.3
The rise of sustainable investing (2016–2020)
Investment
2016
2020
% of market
Compound annual growth
USD trillions
USD trillions
Global AUM
81.9
98.4
4.7%
Sustainable investing
22.9
35.3
35.9%
11.4%
– ESG integrated
22.4
33.0
33.5%
10.2%
– Impact investing
0.5
2.3
2.3%
44.7%
Source: Global Sustainable Investment Alliance (2021)
Note: The compound annual growth rate measures the compounded growth from 2016 to 2020
14.6 Conclusions
The efficient markets hypothesis states that stock prices incorporate all relevant information instantaneously. And the consequence of the efficient markets hypothesis is that investors cannot consistently beat the market. However, efficient markets do require investors who try to beat the market. After all, the mechanism behind efficient markets is that a sufficient number of analysts pay attention to newly arriving information, judge it value relevant, and trade on that information. In that way, the new information gets priced in. But there is evidence that learning takes time and that adaptive markets are a better description than efficient markets. In particular, it seems that analysts are slow to pick up sustainability-related information. The adaptive markets hypothesis states the degree of market efficiency depends on an evolutionary model of individuals adapting to a changing environment. So, the more analysts start to pay attention to an issue, like carbon emissions or human rights violations, the more and faster its effect on stock prices will be priced in.
The valuation of impact is a different matter. Stock prices only reflect the effects of (sustainability-related) information on the financial value of companies. There is no ‘market’ yet for the diffusion of information on the social and environmental value (impact) of companies. Academic research and non-governmental organisations (NGOs) play a leading role in producing information on companies’ social and environmental impact. Markets on impact information and price-setting are evolving: product markets partly reveal consumer preferences for sustainable products; capital markets partly reveal investor preferences for impact investing; and elections partly reveal voter preferences for sustainable policies. These markets can be used to determine the willingness to pay for impact (and thus derive prices for impact). This is all becoming relevant to companies as well. Chapter 17 indicates that reporting regulations are going to require companies to report on their impact alongside their financials.
Investor behaviour is not always in line with theoretical predictions. Individual investors tend to own a few stocks with which they are familiar, leaving them undiversified. Both individual and professional investors trade too much, leading to high transaction costs without compensating return. An important anomaly is the existence of bubbles, whereby prices are above their ‘normal’ or fundamental values for a (long) period of time. Behavioural finance seeks to explain this irrational exuberance.
But irrationality is not the only reason why investor behaviour can deviate from theoretical predictions. Investors can have different goals than the exclusively financial one that theory assumes. An increasing number of investors also want impact. This results in different behaviour and the need for different metrics, such as impact-adjusted and integrated returns.
Key Concepts Used in This Chapter
Active ownership is the use of the rights and position as shareholder (‘ownership’) to influence the activities or behaviour of investee companies
Adaptive markets hypothesis implies that the degree of market efficiency depends on an evolutionary model of individuals adapting to a changing environment
Alpha is a measure of the active return on an investment and measures the performance of an investment compared with a suitable market index
Active investing refers to a portfolio management strategy where the manager makes specific investments instead of investing in the benchmark (see passive investing)
Impact refers to a company’s social and environmental value; impact can be positive or negative
Assurance (or audit) is the independent review of company accounts by a certified audit firm
Benchmarking in investment is the process of measuring an investment portfolio’s performance against a market index
Beta is an indication of a portfolio’s (or a stock’s) exposure to general market movements
Efficient markets hypothesis states that stock prices incorporate all relevant information and thus on average reflect the long-term fundamental value of the firm
Fundamental analysis is an approach to investing based on obtaining a good understanding of a company’s business model and valuation
Impact refers to social and environmental value; impact can be positive or negative
Impact investing (or integrated investing) is an approach to investing that deliberately aims for both social and environmental value creation and financial value creation as well as the measurement of social and environmental value creation
Irrational exuberance refers to investor enthusiasm that drives asset prices higher than those assets’ fundamentals justify
Market index represents an entire stock market and thus tracks the market’s changes over time
Passive investing is an approach to investing that buys widely diversified portfolios, often made up of entire market indices, and limits the amount of buying and selling, so as to steadily build wealth over time
Performance measure refers to an indicator to measure the success of an investment portfolio on return and risk, often related to a benchmark
Random walk is a stochastic or random process that describes a path that consists of a succession of random steps; stock prices following a random walk means that subsequent price changes are independent of each other and are thus not predictable
Sustainability performance refers to an indicator to measure a company’s actual impact in comparison with a company’s normative impact, which is derived from planetary and social boundaries
Tracking error is the difference in price behaviour of a portfolio and the price behaviour of a benchmark, reported as a standard deviation percentage difference
Open Access This chapter is licensed under the terms of the Creative Commons Attribution 4.0 International License (http://creativecommons.org/licenses/by/4.0/), which permits use, sharing, adaptation, distribution and reproduction in any medium or format, as long as you give appropriate credit to the original author(s) and the source, provide a link to the Creative Commons license and indicate if changes were made.
The images or other third party material in this chapter are included in the chapter's Creative Commons license, unless indicated otherwise in a credit line to the material. If material is not included in the chapter's Creative Commons license and your intended use is not permitted by statutory regulation or exceeds the permitted use, you will need to obtain permission directly from the copyright holder.