Social insects such as ants and termites communicate via pheromones which allow them to coordinate their activity and solve complex tasks as a swarm, e.g. foraging for food or finding their way back to the nest. This behavior was shaped through evolutionary processes over millions of years. In computational models, self-coordination in swarms has been implemented using probabilistic or pre-defined simple action rules to shape the decision of each agent and the collective behavior. However, manual tuned decision rules may limit the emergent behavior of the swarm. In this work we investigate the emergence of self-coordination and communication in evolved swarms without defining any explicit rule. For this purpose, we evolve a swarm of agents representing an ant colony. We use an evolutionary algorithm to optimize a spiking neural network (SNN) which serves as an artificial brain to control the behavior of each agent. The goal of the evolved colony is to find optimal ways to forage for food and return it to the nest in the shortest amount of time. In the evolutionary phase, the ants are able to learn to collaborate by depositing pheromone near food piles and near the nest to guide other ants. The pheromone usage is not manually encoded into the network; instead, this behavior is established through the optimization procedure. We observe that pheromone-based communication enables the ants to perform better in comparison to colonies where communication via pheromone did not emerge. Furthermore, we assess the foraging performance of the ant colonies by comparing the SNN-based model to a multi-agent rule-based system. Our results show that the SNN-based model can efficiently complete the foraging task in a short amount of time. Our approach illustrates that even in the absence of pre-defined rules, self-coordination via pheromone emerges as a result of the network optimization. This work serves as a proof of concept for the possibility of creating complex applications utilizing SNNs as underlying architectures for multi-agent interactions where communication and self-coordination is desired.
Hinweise
Cristian Jimenez Romero and Alper Yegenoglu have contributed equally to this work.
Publisher's Note
Springer Nature remains neutral with regard to jurisdictional claims in published maps and institutional affiliations.
1 Introduction
Communication using chemical signals is an efficient way to interact and collaborate within swarm colonies. For example, social insects such as ants and termites deposit pheromones to guide their cohorts while foraging for food. The coordination does not follow a top-down hierarchy, i.e. there is no directing leader. Instead, the coordination is self-organized and enables the swarm to solve complex tasks, such as finding the shortest path between the nest and the food source. This behavior is shaped through evolution over millions of years (Wilson et al., 1967; Smith et al., 2008; Wilson & Nowak, 2014; Boudinot et al., 2022).
From a computational point of view the self-organized behavior in swarms described in the literature has been implemented by using (simple) action rules which allow the agents to interact with other cohorts and the environment by depositing chemical signals. The self-coordination of the swarm emerges as a result of these interactions, allowing the agents to solve problems, e.g. finding the shortest path in an environment. Defining explicit rules may help the system to solve specific tasks yielding in a foreseen behavior, i.e. the system is guided to find a certain solution. Although this approach may converge into a solution it may not be the most efficient one. Moreover, defining rules, which lead to emergent interactions and self-coordination at the level of the swarm, may not be straightforward for complex tasks. In this work, we investigate the emergence of self-coordination and communication in evolved swarms without defining any explicit rules which describe the behavior of each agent. We are particularly interested in the application of spiking neural networks (SNNs), a type of artificial neural network that more closely mimics the behavior of biological brains by using discrete, temporal spikes of activity to process information (Gerstner et al., 2014). Further details on the working and characteristics of SNNs are provided in Sect. 2.2.2. Specifically, our research questions are:
Does self-organized coordination emerge within the swarm, based on the simulated physiological attributes of the agents, the spike-based information processing of the controlling SNN, and the environmental characteristics?
Could the presence of a self-organized coordination between the agents enhance the collaborative approach to solve specific problems?
To tackle these questions, we define a task and evolve an entire swarm of agents searching for food and bringing it back to the nest, resembling the ant colony foraging behavior. In particular, we are interested in exploring the role of stigmergy in the evolutionary emergence of communication within the swarm. Stigmergy refers to indirect interactions which take place via the environment for the purpose of navigation, communication or collaboration.
Anzeige
1.1 Related work
Ant colony foraging is a self-organized behavior which is well investigated within the literature. In these works several computational models replicate to some extent the dynamics observed in biological colonies.
For instance, the authors of Vittori et al. (2004) and similarly of Bandeira de Melo and Araújo (2008) compare the foraging behavior of the Argentine ants Linepithema with an implementation of a probabilistic model. Their models are able to find the shortest paths in a maze to a food source relying on self-organization based on pheromone trails. In Hecker and Moses (2015), the authors show the result of implementing an ant swarm algorithm to control simulated and real robots in environments, where the distribution of food changes. They control each robot using a rule-based probabilistic model mimicking the foraging behavior of seed-harvester ants and optimize the performance of the collective behavior using a genetic algorithm. They analyze how the collective strategies and communication are evolved. The model presented in Wilensky (1997) illustrates self-coordination and collaboration between ants through the use of pheromone. This model is utilizing simple, pre-defined rules to control the local decisions of the ants.
In an alternative approach, Duan and Sun (2014) propose a framework to control agents, called shills, which are able to follow designed update rules. Their task is based on an iterated prisoner’s dilemma game, where shills can update their strategies using particle swarm optimization (PSO) mechanisms. In their setting, shills can choose better performing strategies and provide those to other individuals. The frequency of the communication between the shills can be steered by different parameter configuration.
Swarms have also been combined with spiking neural networks (SNNs) in the past. In Chevallier et al. (2010), the authors implement a spatio-temporal model called “SpikeAnts” and depict the emergence of synchronized activities in an ant colony. They describe a sparsely-connected network of spiking neurons, where each ant is represented by two interconnected neurons. The network does not receive any external stimuli and does not incorporate learning rules. The emergent behavior shows a distributed learning process in the population of agents and it is concluded that in their setting the swarms is able to self-organize.
Anzeige
Artificial neural networks demonstrated to be a successful technique for controlling swarms. To optimize the architecture of these networks, evolutionary algorithms are often employed. For example, Christensen and Dorigo (2006) evolve a swarm of robots that performs hole-avoidance and phototaxis. In their work they compare different evolutionary algorithms, and conclude that evolutionary strategy performs best. Subsequently, they implement this technique on a group of three s-bot robots.
Similarly, Trianni and Nolfi (2009) use evolutionary algorithms to study the design of self-organizing behavior in swarm robotics. In their simulations, they run 20 independent instances of the design process. Following a similar approach to Christensen and Dorigo they apply the best instance on three s-bot robots.
Waibel et al. (2009) examine how various types of selection pressure (individual vs. collective) and swarm composition (homogenous vs. heterogeneous) affect the performance in a foraging task. Their investigation involves three task variants and 4 combinations of selection pressures/team compositions, tested through 20 independent runs using both simulation and real robots (Alice robots).
In a more recent study, Ericksen et al. (2017) utilize the Neuroevolution of Augmented Topologies (NEAT) algorithm to automate the design of a neural network controller which controls a swarm of homogeneous robots. They compare their system, called NeatFA (NEAT Foraging Algorithm), to existing swarm foraging algorithms, such as the Central Place Foraging Algorithm (Hecker and Moses, 2013, CPFA), and the Distributed Deterministic Spiral Algorithm (Fricke et al, 2016, DDSA). In their experiments involving large swarms, their evolved network outperforms the CPFA and DDSA when applied to a foraging task.
1.2 Our contribution
The aforementioned methods for controlling swarms rely on engineered probabilistic models, rule-based systems or the application of evolutionary strategies on control software to steer swarm interactions. While these methods successfully induce collaborative behavior within the swarm, they pose a challenge as designers often drive this process through iterative experimentation, relying on their intuition and prior experiences (Francesca & Birattari, 2016). Trying to formalize all the rules and interactions which address not only individual but also collective behaviors in a dynamic realistic environment becomes complex. This approach may also not scale well if the complexity of the task or the number of agents increases. This predicament is known in the literature as the design problem (Trianni et al., 2008). In contrast, recent efforts have aimed to address the design challenge by adopting connectionist models, wherein the swarm controller is built upon artificial neural networks. Furthermore, another promising solution may lie in the application of spiking neural networks. SNNs offer several distinct advantages, including sparse coding, precise spike timing encoding, and local plasticity rules. Sparse coding allows for efficient and economical representation of information within the network, reducing computational demands (Yamazaki et al., 2022). Local plasticity rules facilitate bio-inspired adaptive learning mechanisms within the network, potentially allowing swarms to adjust and optimize their responses to changing environmental conditions. SNNs have the capability to control agents and robots in dynamical environments (Nichols et al., 2010; Beyeler et al., 2015; Nichols et al., 2012). Moreover, SNNs hold the potential to leverage specialized neuromorphic hardware, which is designed to emulate the brain’s neural architecture efficiently. This hardware can significantly enhance the computational efficiency and real-time processing capabilities of swarm controllers based on spiking neural networks, further improving their overall performance in complex and dynamic environments (Basu et al., 2022; Ottati et al., 2023; Putra & Shafique, 2023).
Based on the aforementioned characteristics of SNNs, in our approach, the agents are controlled by SNNs and are not strictly bound by predefined rules to guide their behavior. Instead, we allow the optimization process the autonomy to explore solutions based on an objective fitness function to maximize the fitness measure. Each agent is controlled by an SNN composed of several neurons. We optimize the synaptic weights and spike time delays of the entire network using genetic algorithms, so that the network is able to control the agents to navigate in the virtual environment while searching and collecting food and bringing it back to the nest. At the beginning of the evolutionary process, the SNN is agnostic of the foraging task and there is no pre-defined communication or coordination mechanism encoded into the architecture of the SNN. There is no explicit mapping between the sensory input and the actions taken by the ants, e.g. visual information and pheromone depositing.
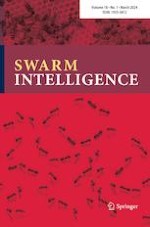
Fig. 1
Screenshot of the environment. The picture shows an ongoing simulation with an active foraging swarm. White/blue patches indicate the presence of pheromone. The brighter the color the higher the pheromone concentration. Food piles are depicted with green patches and leafs. The black hexagon in the middle is the nest. An impassable red wall is set around the environment (Color figure online)
×
The virtual environment, in which the simulations are run, is based on the ant-colony model by Wilensky (1997). In this model, the diffusion and evaporation of pheromone is simulated in a 2-dimensional grid world. This grid world is a suitable environment for our experiments due to its simplicity, which allows us to easily control and manipulate the variables, as well as the computational efficiency, which enables us to run multiple, parallel simulations in a relatively short amount of time. An example of this simulation is shown in Fig. 1, here a possible distribution of pheromone for an active swarm is depicted. The ants colored in red are exploring the world for food (green leaves) and depositing pheromones near the food patches and in the vicinity of their nest. While some ants are following the pheromone trail leading to the food patches or to the nest, others are exploring the environment. Every ant is steered by a spiking neural network. To optimize the network parameters and create the environment, we connect our own implemented Learning to Learn framework (L2L; Yegenoglu et al, 2022) with the multi-agent simulator NetLogo (Tisue & Wilensky, 2004) and the spiking neural network simulator NEST (Gewaltig & Diesmann, 2007).
1.3 Structure of our manuscript
Our manuscript is structured as follows. First, in Sect. 2, we introduce our toolchain and setup of the environment. We describe the experimental design, the structure of the agent network and how we employ a genetic algorithm to optimize the synaptic weights and delays over multiple generations. Then, in Sect. 3 we analyze the emergent communication via pheromones and compare our network structure to the base model implemented in Wilensky (1997) in terms of foraging performance. We examine how the pheromone usage and concentration is shaped by the evolutionary process which enhances the self-coordination and communication between the ants. Moreover, we investigate the correlation between the input and output spike activity produced by an agent’s network. This analysis shows us that certain input actions lead to specific output reactions. We measure the significance and relate these actions to each other. Finally, we discuss the results of the swarm simulations, with special interest on the emergent communication, and we mention some avenues for future work.
As a summary, in this manuscript we show that agents controlled by SNNs and without pre-defined rules can self-organize through evolutionary optimization which allows them to solve complex tasks as a swarm, leveraging their physiological capabilities. Interestingly, in our specific use case of an ant colony, we observe that the pheromone acts as an attractor rather than an event-based signalling mechanism, which resembles the behavior in biological colonies. This work provides a proof of concept environment which can be used to study learning and emergence of complex behavior in multi-agent settings.
2 Material and methods
Fig. 2
Optimization workflow. In each generation 32 individuals are simulated. Each individual corresponds to an instance of an SNN and consists of 15 ants with a copy of the same network. The genetic algorithm requires the calculated fitness of every individual to perform the optimization on the connection weights and delays
×
We carry out optimization of a spiking neural network to steer an ant colony foraging for food using a genetic algorithm (GA). The optimization workflow is depicted in Fig. 2. There are 32 individuals per generation. Each individual corresponds to an instance of an SNN (see Fig. 4). It is important to note, that an individual refers to the SNN instance and not to a simulated ant. There are 15 ants per simulation forming the colony and every ant is controlled by an SNN, which is a copy of the same individual (network).
Since there are 32 individuals we are running 32 simulations in parallel. Thus, we execute 15 identical networks during one simulation per individual and 480 networks in total per generation. Each colony is simulated within a 2D environment to perform the foraging task. After the simulation finishes, a fitness value is calculated to evaluate the performance of the run.
The GA orchestrates an exploratory process within the parameter space, specifically focusing on the weight and delay parameters associated with one-to-one synaptic connections between neurons in the network (see Sect. 2.2.2 for an explanation of weights and delays in the context of SNNs). Both parameters are instrumental in influencing the information transmission and processing dynamics within the neural network. The entirety of the weight-delay pairs associated with each connection in the network constitutes the genome of each individual within the population. Over successive generations and guided by mechanisms of selective pressure, the genetic algorithm iteratively fine-tunes the synaptic parameter values. This iterative process leads to the convergence of a configuration that maximizes the efficacy of the SNN with respect to the fitness function. An overview of the settings related to the optimization of the parameters can be found in the Appendix A.
2.1 Toolchain
Our main toolchain1 consists of three applications: The meta-learning framework Learning to Learn (L2L; Yegenoglu et al, 2022), the multi-agent simulator NetLogo (Tisue & Wilensky, 2004) and the spiking neural network simulator NEST (Gewaltig & Diesmann, 2007).
L2L (Version 1.0.0-beta) is the orchestrator of the workflow (see Appendix A for L2L optimization details). The framework requires the definition of the optimization algorithm, including its (hyper-)parameters, and the simulation whose parameters are going to be optimized. The software architecture consists of a two loop structure, the inner loop (optimizee) and the outer loop (optimizer). In the inner loop, the optimizee—for example a neural network with or without learning capabilities—is trained on a family of tasks. In our setting, the SNNs in the inner loop do not learn and only the performance on the foraging task is evaluated, the optimization is conducted in the outer loop. The performance of the training or simulation run is evaluated by a fitness function, yielding a fitness which can be a scalar or a vector value. In the outer loop, the (hyper-)parameters of the optimizee are optimized. For example, if the optimizee is a network, the parameters could be the learning rate and the weights. The aim is to reach an overall good performance and to enable faster learning on new, unknown tasks. In this work we use the L2L framework’s genetic algorithm as optimizer in the outer loop, which wraps the implementation from the DEAP (Fortin et al., 2012) library.
NetLogo (Version 6.2.0) is a multi-agent simulator. Every object in a NetLogo simulation is an agent and can be used as means of communication with other agents. With NetLogo it is easy to replicate the same simulation and agent. In our settings the agents are represented as ants and in the rest of the manuscript we will refer to the agents as ants. Each ant is controlled by one instantiation of a common spiking neural network. To communicate with each other the ants can deposit pheromones. Patches are used to represent the pheromone which is dropped by the ants on the environment. Each ant is also capable of sensing the presence of pheromones. NetLogo allows the simulation of the pheromone dynamics through its embedded language primitives.
The simulations uses the spiking neural simulator NEST (Version 3.0) as the back-end. NEST is a spiking neuronal simulator for biologically plausible, large-scale neural network simulations. Simple neuron models with biological realistic connection structures can be simulated in an efficient way in a variety of hardware from local machines up to High Performance Computing (HPC) systems (Jordan et al., 2018). NEST supports multi-threading and parallel execution with the message passage interface (MPI).
2.2 Ant colony foraging for food
The task of the ant colony is to search for food and return it to the nest. In order to achieve this, each ant is controlled by its own network, a copy of the individual SNN. In the following sections we describe the experimental setup of the NetLogo environment (Sect. 2.2.1), the neural model as well as the network architecture (Sect. 2.2.2) and the sensory and actuator mechanisms (Sect. 2.2.3) for the ants. Finally, we describe the colony fitness function (Sect. 2.2.4).
2.2.1 Experimental NetLogo environment
The experimental environment employs a grid-based system, where the world is represented as a discrete grid comprising individual cells. Within this setup, the agents are limited to navigating from one grid cell to another. The agent’s behavior during each simulation step is determined by the output of the controlling network, allowing it to move forward by one cell at the time and providing the option to rotate either clockwise or anticlockwise. Simultaneously, the pheromone dynamics also operate on the same grid as the agents’ navigation. The pheromone levels are updated and influenced by the agents’ actions and interactions with the environment. As the agents move through the grid, they deposit and sense pheromone levels at their current positions, influencing their decision-making processes and potentially affecting the behavior of neighboring agents. Furthermore, the pheromone in this environment is subjected to two additional processes: diffusion and evaporation. Diffusion allows the pheromone to spread from the cells where it was initially deposited to neighboring cells, leading to a gradual spread and potential concentration gradients. On the other hand, evaporation causes the pheromone levels in each cell to decrease over time, ensuring that old pheromone trails gradually diminish and do not persist indefinitely. The combination of agent movement, pheromone deposition, diffusion, and evaporation in this grid-based environment creates a dynamic and evolving system. These processes play a crucial role in shaping the overall behavior and emergent patterns observed in the model.
2.2.2 Neural model and network architecture
Fig. 3
Action potential of a neuron. Incoming currents progressively raise the membrane potential of a neuron until the firing threshold is reached, then a spike is initiated, marking a firing event. Subsequently, the neuron enters an absolute refractory state, during which the membrane potential stabilizes at the resting potential. Throughout this phase, the neuron remains unresponsive to incoming stimuli until the refractory period concludes. Adapted from Wikimedia Commons
×
NEST is employed to build the SNN and to simulate neural dynamics. Additionally, it simulates the application of electrical stimulation to the neurons through the utilization of direct current (DC) generators. Each neuron within these networks is represented by a leaky integrate-and-fire (LIF) model featuring alpha function-shaped synaptic currents (Gerstner et al., 2014). Neurons communicate via action potential or spikes, a visualization of this sequence is depicted in Fig. 3. The pertinent LIF parameters of our model can be found in Table 1 in Appendix A.
Fig. 4
Spiking network to control an ant of the colony. The topology comprises 12 neurons for the input, 20 all-to-all connected neurons in the middle and four neurons in the output
×
The overall structure of the SNN can be segmented into three distinct layers. Firstly, the input layer assimilates sensory data that an ant can perceive, for example, encompassing sensors designed for detecting pheromone signals, the scent of the nest, reward or nociceptive stimuli. Secondly, the middle layer is interconnected in an all-to-all manner. Lastly, the output layer reflects the available actions an ant can execute, including forward movement, rotation and depositing pheromone.
Each layer maintains connections with the subsequent layer through a comprehensive all-to-all connectivity. This architecture allows the optimization algorithm to discern the most efficient configuration for the SNN, tailored to the task at hand, without imposing any constraints.
In our setup each ant is controlled by its own network, a copy of the individual SNN. An example of such a network is shown in Fig. 4. The network consists of 36 neurons and 720 connections.
We optimize the weights and delays of each SNN. Weights and delays are critical parameters that determine how information is transmitted and processed between neurons. Weights regulate the strength of connections, influencing signal propagation, while delays manage the timing of these signals defining the time a spike needs to travel from the presynaptic (initiator) to the postsynapctic (target) neuron. Together, they shape the network’s behavior.
2.2.3 Sensory and actuator mechanisms
Fig. 5
Pheromone detection mechanism of the ant. The left side illustrates how the ant assesses the pheromone concentration in the three neighboring cells directly ahead. On the right side, each sensor corresponds to a distinct neuron. The sensor that detects the highest pheromone concentration will activate its corresponding neuron, while the other neurons remain inactive. If the pheromone concentration is identical in at least two of the cells, the neuron corresponding to the middle sensor is activated. This scenario accounts for cases where the ant encounters a relatively uniform distribution of the pheromone scent across the adjacent cells
Fig. 6
Nest detection mechanism of the ant. Similar to the ant’s mechanism for detecting pheromones, the process of nest detection involves the agent’s sensory system assessing the concentration of a distinct scent associated with the location of a nest. This scent, is emitted by the nest area itself. The ant employs sensors dedicated to perceiving this nest scent in the three adjacent cells directly ahead of its current position as shown on the left side. Each of these sensors corresponds to a unique neuron within the agent’s neural network as illustrated on the right side. Similar to the pheromone detection mechanism, the sensor that detects the highest concentration of the nest scent will activate its corresponding neuron. Meanwhile, the other neurons remain inactive, preserving the specificity of the sensory response. In situations where the concentration of the nest scent is identical in at least two of the cells, the neuron linked to the middle sensor is triggered
×
×
To encode the diverse sensory inputs, encompassing various stimuli such as food, walls, pheromones, nest scent, reward, and collision, originating from different sensor types, a direct current (DC) generator is linked to each input neuron. When the associated sensor is activated, the DC generator emits a consistent DC signal. Consequently, the input neurons that are activated can sustain a high-rate spike train as long as the corresponding sensory stimulus persists. These sensors are connected to the twelve neurons in the input layer. The top three neurons in Fig. 4 are sensory neurons which react to the direction of the pheromone.
Fig. 7
The Queen sensor is activated whenever the agent is situated within the nest area as shown on the left side. Upon activation, as depicted on the right side, it initiates the firing activity of its corresponding input neuron, maintaining this activity as long as the agent remains within the nest area
×
The pheromone detection mechanism is elucidated in Fig. 5. The next three neurons can locate the nest scent as depicted in Fig. 6. The queen sensor is activated when the ant is within the area of the nest, see Fig. 7. The reward and punishment for the ant are determined by the reward and collision sensors. The reward sensor is activated when the ant touches the food or returns it to the nest and the collision sensor is active whenever the ant collides with the red wall. The food and wall sensors enable the ant to detect objects within a range extending up to 5 patches directly ahead of it, this is exemplary illustrated in Figs. 8 and 9. Each of these sensors is connected to a neuron that, when the sensor is activated, initiates firing activity within the associated neuron.
The heartbeat neuron stimulates the network in every timestep by supplying a small direct current in order to maintain activity in the network.
Each ant can only collect one food patch at a time and must transport it back to the nest before looking for food again. There is no pre-programmed behavior to signal the ants that this is the activity pattern they should follow. This pattern is enforced by not allowing ants to carry more than one piece of food and rewarding ants when they bring the food to the nest, at which point they also regain the capability to pick up another piece of food. In every generation we change the position of the nest randomly, in order to avoid overfitting the network and make the colony more adaptable to the location of the food piles.
As depicted in Fig. 1, every agent can deposit pheromone which is represented by a white patch. The dropped pheromone spreads from the point (patch) of release to a certain amount of neighboring patches according to the diffusion rate, defined in the simulation parameters. Pheromone concentration also decreases (evaporates) exponentially over time. There is no predefined behavior that binds depositing pheromone to any action or sensor. Other agents can smell the pheromone and react to it. The response elicited in an agent by the pheromone emerges from the evolutionary process carried out by the genetic algorithm. For example, the sensing of pheromone at a certain location could modify the trajectory of an agent looking for a food source or the nest.
When an agent is positioned directly over a food patch, the reward sensor triggers spikes in the corresponding reward neuron. Concurrently, the amount of food within that patch diminishes by a single unit. Furthermore, this activity temporarily restricts the agent’s ability to decrease the food count in other patches. The restriction remains in place until the agent returns to the nest area, restoring the agent’s capability to engage with and decrease the food count in other food patches.
Fig. 8
Food detection mechanism. Food sources are depicted as green-colored patches in the environment. As shown on the left side the sensor detects food located 2 patches directly in front of the ant. This detection initiates the activation of the corresponding neuron, which is illustrated on the right side (Color figure online)
Fig. 9
Wall detection mechanism. Walls are represented by red-colored patches. The sensor detects a wall located 4 patches directly in front of the ant as depicted on the left side. This detection initiates the activation of the corresponding neuron as illustrated on the right side (Color figure online)
×
×
The output of the SNNs is determined by the firing rate of the output neurons during the network’s simulation. The interpretation of the output vector relies on the correlation between the neurons and their respective actions, a concept that is depicted in Fig. 10. The four output neurons are fully connected with the middle layer and control the movement (rotate left, rotate right, go forward) as well the activation to drop the pheromone.
Fig. 10
Actuation mechanism of the ant. The control network depicted on the left side, enables the ant to execute four distinct actions: advancing forward, rotating clockwise, rotating anticlockwise, and depositing a predetermined quantity of pheromones. To achieve this, each action is associated with its own dedicated neuron within the network. As illustrated on the right side, the ant turns 6 degrees clockwise in response to the activation of the neuron associated to the rotate-right action, which is shown on the left. When a neuron exhibits firing activity, it triggers the corresponding actuator, enabling the agent to carry out the desired action. Consequently, the agent has the capacity to engage in forward motion, rotation, and pheromone deposition concurrently. Notably, the rotational movements occur in discrete steps of 6 degrees per activation. Simultaneously, the agent’s forward motion progresses at a rate of 1 patch per activation, contributing to its ability to traverse the environment. However, it is important to note that exclusivity is observed only between the clockwise and anticlockwise rotation actions. In these instances, the neuron displaying the higher spiking activity exerts dominance and determines the direction of rotation that the agent will undertake, all while adhering to the 6-degree step increments (Color figure online)
×
2.2.4 Fitness calculation
The total fitness of the ant colony optimization is calculated by summing up the rewards and punishments received by each of its ants in the colony during the course of a simulation. An ant receives a small positive reward for touching a food patch, and a large reward for returning with food to the nest. This induces the ants to quickly return to their nest, whenever they find food. A small punishment is given at every time step to encourage the colony to complete the task as quickly as possible. At the same time, the ants receive a small punishment for every selected action to avoid excessive reactions, such as depositing too much pheromone or exhibiting too much movement.
The simulation takes \(T = 2000\) steps to finish; if the ants are able to collect all the food before the simulation ends they receive a reward as well. This reward is the result of the difference between the total simulation time and the time \(T_{s}\) the ants require to collect the food multiplied with a scalar \(\eta\). The whole process can be formalized as:
where \(t=1, \ldots , T_{s}\) is the simulation step with \(T_{s}\le T\) and T the total simulation time, \(\eta\) is a scalar to weight the speed of the ants collecting the food. Within the sum, i is a specific individual, \(j=1,\ldots , J\) is an ant and J is the total number of ants in a colony. \({\mathcal {N}}\) is the positive reward value for coming back to the nest with food, \({\mathcal {F}}\) is a positive value for touching the food and \({\mathcal {C}}\) is the punishment cost. The behavioral reward and cost values are specified in the Appendix (Table 2) and the other experimental parameters can be found in the Appendix (Table 3) as well.
3 Results
In the following, we show the result of executing simulations of the foraging task using the L2L framework. See Appendix A for further details on the execution. We explore and compare three models:
1.
an SNN-driven model (SNN model 1), where each ant is controlled by identical copies of a common network,
2.
the same SNN-driven model but with the pheromone pathway deactivated (sensing and depositing of pheromone is disabled, SNN model 2),
3.
a rule-driven model (rule based) based on the implementation in NetLogo by Wilensky (1997). In this model each ant follows a set of predefined simple rules.
3.1 Fitness and emergent usage of pheromone
Fig. 11
Fitness of the ant colony of two distinct simulation runs. In the first SNN-driven model the pheromone pathway is activated (top). However, the ants of the second SNN-driven model (bottom) cannot sense and deposit pheromones. While the blue data series depicts the evolution of the first model’s fitness, the green data series illustrates it for the second model. The dotted data series shows the best individual found in every generation. The blue/green solid line indicates the mean fitness and the blue/green shaded area is the standard deviation over all individuals (Color figure online)
Fig. 12
Performance of the best individual of the last hundred generations averaged over 100 trials starting from generation 1600. The shaded area depicts the confidence interval of \(95\%\). The thick line shows the mean
×
×
Figure 11 shows the evolution of the mean and best fitness over 1700 generations for the SNN-driven experiments mentioned above. In the first SNN-driven model the pheromone pathway is enabled, i.e. the capability of the ants to deposit and sense the pheromone is active (Fig. 11, top). For this model, we observe that the mean fitness is increasing over the generations. After the 1000th generation the mean converges and oscillates around a value of 8100 with a standard deviation of 3970. Specific individuals reach a fitness higher than 30000 with the highest fitness at 38004 in generation 1420 (see green data series). The second SNN-driven model has no active pheromone pathway, the ants are not able to perceive or deposit the pheromone (Fig. 11, bottom). Here, we observe an increasing mean, which converges after 700 generations around a value of 5800 with a standard deviation of 3950. In comparison to the first model, specific individuals reach a high fitness in early generations (e.g. generation 390 with a fitness of 21716) and the highest fitness at 24450 in generation 1150. Furthermore, the colonies that are able to communicate via pheromones can be adapted via learning to achieve a higher fitness and performance than the colony without the ability to utilize pheromone.
Figure 12 depicts the performance of the best individual of the last hundred generations averaged over 100 trials. Since the performance converges around the 1000th generation we take a sample of the last hundred generations. Each run is an independent simulation, where the position of the nest changes. As observable in the plot, the best performing individual is at generation 1600. The observed oscillation of the fitness during the evolutionary optimization may arise from various factors, including the dynamic nature of the search space, genetic operators like crossover and mutation, and the algorithm’s response to local optima. Stochasticity and population size also play a role.
Fig. 13
Pheromone concentration heatmap over different generations. The brighter the color the higher the pheromone concentration. The marginal plots at the sides are density plots, indicating the amount of the concentration with regards to the (x, y) position. The ants are colored in white, food patches in green. The brown hexagon in the middle is the nest (Color figure online)
×
Beyond the evolution of the fitness, we examined the emergence of coordination via pheromones. The heatmap in Fig. 13 shows the pheromone concentration for an example individual over different generations. Each simulation runs for 2000 steps and at step 1900 we take a snapshot of the best individual with the position of the ants, the pheromone and the food patches, as well as the pheromone concentration and the food amount.
In the early generations (Fig. 13a) the concentration is low, while most of the food patches are uncollected. The ants are exploring the environment in a random manner and, from visual observation (as seen in Fig. 13a), about half of the population is close to the nest as well as to the food pile on the right side (\(x=35, \, y=30\)). Small pheromone patches can already be observed around the nest and the closest food patch. This is also visible in the marginal plots depicting the pheromone density. The peaks are at the position of the nest (\(x=22, \, y=30\)) and the right food pile. In generation 200 (Fig. 13b) it can be observed that there is a correlation between the pheromone concentration and the position of the food piles and the nest. Given the pheromone concentration and the position we hypothesize that the ants are utilizing the pheromone to keep track of food locations. The marginal plots have 4 peaks, at the nest and at the left and right food piles (bottom left \(x=5, \, y=5\), top left \(x=5, \, y=52\), right \(x=35, \, y=28\)). In generation 600 a higher pheromone usage is visible (Fig. 13c) in comparison to generation 200. The concentration is nearly equally distributed over the environment, which is also visible in the density plots. Since the pheromone depositing has a negative cost in the fitness function, continuous evolution of the network should optimize the pheromone usage for important information that is useful to accomplish the foraging task. This becomes visible in Fig. 13d where the evolutionary pressure helps to transform the homogeneous pheromone distribution into well-defined pathways. These paths connect the relevant components of the environment, i.e. food location and the nest, such that foraging becomes faster and more efficient, leading to an overall higher fitness (see Fig. 11, top).
3.2 Performance comparison
Fig. 14
Performance comparison of different ant colony models. The boxes depict the number of food patches collected in 2000 simulation steps in 100 trials. Each box plot ranges from the first to the third quartile. The vertical bar in the box indicates the median and the whiskers depict the lowest or highest amount of collected food. The diamonds show outliers. In every trial the position of the nest is changed by setting a different seed
×
To assess the performance of the ant colony, we first selected the best performing individual of the last generation after the optimization procedure. Secondly, we calculated over 100 simulations (trials) the average amount of food foraged by the colony (and brought back to the nest) within the simulation time of 2000 steps. The trials have different seeds which determine the initial position of the ants in each trial. There are three piles of food positioned in different areas of the simulated 2D-world as shown in Fig. 13. Each pile contains 50 units of food making a total of 150 units, which is the maximum score that a colony can reach in this experimental setup.
We tested the three models introduced in the beginning of Sect. 3. Furthermore, we added a fourth experiment in which we impaired the pheromone pathway for the first SNN-based model. The results are shown in Fig. 14 as box plots. The first box illustrates the foraging performance of a rule-based system implemented in NetLogo (Wilensky, 1997), i.e. the ant foraging behavior follows pre-defined action rules. The self-organized behavior of the ants emerges from the interactions of individual colony members. In this setting, the colony reaches a median of 117.5 foraged units of food with a standard deviation of 19.6. We define the rule-based system as our baseline for comparison. The second bar depicts the SNN-based model 1 which reaches both a higher median score (137.0) and a lower standard deviation (9.0) than the rule-based system. To measure the effect of the pheromone on the colony coordination, we disable the pheromone sensing in the first SNN model after evolving it. We observe that the foraging performance drops significantly and the ants are not able to collect the food (median: 0.0, SD: 0.9) as shown in the third bar. The fourth bar shows the performance of the second SNN-based model. It reaches a median of 97.0 with a standard deviation of 60.0 and performs less efficient than the first SNN-based model and the rule-based one.
Notably, while we observe that SNN model 2 performs less effectively in food foraging compared to both SNN model 1 and the rule-based model, it still demonstrates the swarm’s ability to explore the environment in search of food and return it to the nest.
Several possibilities could explain this phenomenon: 1) Random chance. In a relatively small environment or with ants having a longer sensing range, ants might discover food sources by random chance, even without the guidance of pheromones. This could lead to effective foraging without the need for pheromones. 2) Alternative sensing mechanisms. SNN model 2 may have evolved synaptic pathways that exploit sensory information other than pheromones to locate and retrieve food. For example, ants might rely more on the food and wall sensors. 3) Parallel evolution. It is possible that the evolution process in SNN model 2 favored solutions that did not critically rely on pheromones. These solutions could involve more robust and versatile strategies that didn’t require pheromone communication.
The key question then arises: why doesn’t SNN model 1 evolve to exploit the same information as SNN model 2 reducing its reliance on pheromones? The answer may lie in the initial conditions and random variations inherent in evolutionary processes. SNN model 1 may have initially favored or stumbled upon solutions that heavily rely on pheromones due to the specific genetic and environmental conditions it encountered during the evolution process. It might not have explored or discovered alternative strategies or pathways as effectively as SNN model 2.
Overall, this situation underscores the complexity of evolutionary processes and the role of environmental factors in shaping the behavior of evolved agents in swarm systems. It also highlights the adaptability of spiking neural networks in finding effective solutions in different scenarios.
Based on these results, we observe our evolved model with a self-coordination system is able to forage for food in a comparable amount of time as the rule-based system but faster than the second SNN model which is evolved solely using the visual sensory pathways to navigate and forage for food. The ants are able to learn to communicate via pheromones, which increases their performance when foraging for food, despite the fact that there is no hardwired mapping that defines the usage of pheromones for communication purposes. The communication emerges within the ant colony over the generations as a swarm strategy.
3.3 Input–output correlation analysis
Fig. 15
Correlation heatmap between the network input and output spike trains. The mean Pearson product-moment correlation coefficients between the input and output spike trains of all ants from the best individual are calculated
×
In order to better understand how the ant behavior changes over the generations, we correlate all input spike trains with all output spike trains for all ants of the best individual for specific generations. The results of this correlation analysis are limited and provide just an initial overview of the relationships between input and output in the network. A more complete assessment of the correlations in a recurrent network with dynamic inputs requires a complex analysis which considers not only snapshots of inputs and outputs but also the internal state of the model and its transitions through time. This type of analysis is out of scope for this work and will be the topic of further publications.
First, we create a histogram to bin the input and output spike trains using the Electrophysiology Analysis Toolkit (Elephant2; Denker et al., 2018). As a second step, we obtain the mean Pearson product-moment correlation coefficients. Figure 15 depicts the correlation heatmap for the input (x-axis) and the output (y-axis) activity (see also Fig. 4 for the network description) for four different generations. While a red color indicates a high correlation, a blue color denotes a negative correlation. The nomenclature follows the naming scheme in Fig. 4, i.e. for the output activity Left is rotate left, Move means move forward etc. and similarly for the input activity.
As optimization of the network takes places we observe that a correlation between smelling and moving in the same direction emerges. Given this observation we hypothesise that the ants develop a mechanism to attract other ants to specific locations of interest using pheromones. Across all generations, Smell Middle is positively correlated with Move, with a value of 0.265 in generation 10 and a reduced value of 0.116 in generation 1600. One can also see that e.g. Smell Right is negatively correlated with Move, it has a value of \(-0.487\) in generation 10, but at generation 1600 the strength of this anti-correlation is reduced to \(-0.182\). Interestingly, Smell Left is negatively correlated with Left in generation 10 (\(-0.213\)) but shows a positive correlation in later generations (0.219 in generation 1600). A similar observation can be made for Smell Right and Right.
We observe in early generations a negative correlation between Move and On Nest (\(-0.478\) in generation 10), while in later generations there is a trend towards becoming uncorrelated (\(-0.0017\) in generation 1600). Nest Middle and Left are anti-correlated in early generations (\(-0.187\) in generation 10) and positively correlated in later generations (0.135 in generation 1600). The relationship between Food and Pheromone indicates a slight positive correlation in early generations (0.136 in generation 10) but increases in later generations (0.313 in generation 1600). The observation that ants tend to deposit pheromones when they encounter a green patch suggests that they likely use pheromones to attract other ants to interesting locations, such as food sources. This relationship between visual stimuli and pheromone sensing appears to have developed and improved over the course of evolution, eventually leading to ants relying more on pheromone signals than visual cues. To test this hypothesis we disabled the pheromone sensing from good individuals which were originally evolved with both visual and pheromone sensors. The results of this experiment confirmed that the presence of pheromone sensing became essential for these ants to successfully accomplish their foraging task (see Sect. 3.1). The fitness function punishes an extensive pheromone drop which leads to a rather restrained usage. The input–output relationship is changing continuously across the generations due to the evolutionary algorithm, i.e. certain input–output relationships get enhanced or weakened. Some of these mappings align with observations in nature, e.g. Food and Pheromone have an increasing correlation value across the generations, which reflects the positive reinforcement when the ant perceives food. This is also in agreement with the attractor effect of the pheromone and links to the correlations between smelling pheromones and ant movement, serving as guiding signals to take the ants back to the food patches.
3.4 Correlation analysis over all generations
Fig. 16
Correlation coefficients of input and output spike trains for the first ant of the best individual every ten generations. A linear regression is calculated for the data (solid lines). A low p-value rejects the null-hypothesis that the slope of the curve is zero. s is the slope of the curve and \(\sigma\) the standard deviation of the points
×
Although the pheromone heatmap provides insight into ant behavior for specific generations, we wanted to see how the behavior evolves over all generations. In order to compare different input-to-output correlations and validate our results obtained from the heatmap, we calculate the correlation coefficients between input and output spike trains for the first ant of the best individual every tenth generation. We then fit a linear regression on the coefficients, which returns a p-value and the slope s; a low p-value rejects the null-hypothesis that the slope of the curve is zero, i.e. there is not a correlation. Additionally, we calculate the standard deviation \(\sigma\) of all points.
The visualization in Fig. 16 enables us to determine trends in the ant behavior over generations. Note, that only plots with a p-value below 0.005 are displayed. We hypothesise that the ants progressively learn to avoid the red walls and turn away when approaching them. In contrast, they seem to move towards the food patches and the nest based on sensing the pheromones or on visual stimuli. For example, we observe that Wall is initially positively correlated to Move but there is a trend towards anti-correlation over the generations. While Food and Move show an increasing trend, Wall and Move become increasingly negatively correlated over the generations. Likewise, Smell Right shows a trend towards an increasing positive correlation with Right and a negative correlation with Left. Smell Left is initially positively correlated to Move, but this correlation decreases for later generations. In contrast, the correlation between Smell Left and Nest Left increases, while it decreases for Nest Right. It appears that the ants developed a perception for the nest and turn towards the corresponding direction. The sensor for Smell Middle shows an increasing trend towards positive correlation with Move. Nest Middle has an increasing positive correlation with Left, while Nest Right has an increasing negative correlation with Left as the colony evolves. We further hypothesize that the ants have a tendency to move after they visited the nest in order to explore the environment or forage for food. At the end of the evolution there is a positive correlation between Move and On Nest and a negative correlation with Left or Right and On Nest. Pheromone is initially dropped in the vicinity of the nest. However, the pheromone output activity, when the ant is in the middle of the nest, decreases over the generations. In contrast, Food and Pheromone show an increasing positive trend.
While observing the performance of the ant colony especially at the end of the evolutionary process, pheromone trails emerge and form attractors with higher pheromone concentration. This results from a combination of the evolutionary pressure of the fitness metric towards the pattern: explore, get food, return to nest, as well as the optimized actions which includes sensing the pheromone and exploiting the pheromone dynamics (evaporation and diffusion). This resembles the actual behavior of ant colonies observed in nature.
4 Discussion and conclusion
In this work we discussed an implementation of a virtual environment where the behavior of swarms of agents controlled by SNNs could be optimized using evolutionary algorithms. The implementation combines NEST simulations for the SNNs, an environment described with NetLogo and an optimization with genetic algorithms using the L2L framework. This implementation is open source (see Appendix A) and can be used or extended to explore a variety of scientific questions regarding swarm optimization as well as emergent communication and organization. In particular, it could be of high interest to study the coordinated emergent behavior and communication between agents in neurorobotics and cobotics applications (Krichmar, 2018; Knott et al., 2022; Vella et al., 2023), where it is essential to ensure safety, optimal resource usage, and adaptation to dynamic environments.
We demonstrated that we could use genetic algorithms to successfully evolve spiking neural networks to control agents (here, ants) to solve a multi-agent food foraging task. Our approach shows emerging self-coordination via pheromone as a result of the network optimization, without defining action rules or probabilistic state models. This work serves as a proof of concept to illustrate multi-agent interactions with emergent communication and self-coordination utilizing SNNs as underlying architectures. We provide a short summary of our methods in the following:
Our SNN architecture encodes the inputs from the environment and steers the behavior of the ant when foraging for food.
Based on the fitness function, which evaluates the foraging performance, we utilize a genetic algorithm to optimize the synaptic weights and delays. This allows the network to achieve an efficient foraging behavior.
Our analysis investigates the emergent relationship established by the SNN between the inputs and outputs to trigger certain actions during the evolutionary process.
By applying the methods mentioned above, we observed an emergence of stigmergy, i.e. the communication and collaboration via pheromones. In our evolved network we proved that communication became essential for the efficient performance of the ants during the foraging task. Impairing the pheromone sensing capabilities of the ants drastically hindered the performance of the collective. This highlights the importance of stigmergic communication, which emerged through the optimization process, for the effective collaboration between the agents. In our experiments we showed that agents using pheromones were able to quickly forage for food even when the position of the nest was changed. It is important to note that the release of pheromone does not obey any pre-defined rule or manual synaptic pre-configuration in the network. Instead, the stigmergy is an emergent behavior that is triggered under certain conditions established during the evolutionary process.
Furthermore, we would like to highlight that the sensing of the pheromone is not associated with any kind of pre-defined behavioral response in the network. There is no hard-coded synaptic communication that explicitly maps the sensory input of pheromone with a certain action. Instead, the observed behavior is completely based on emergent communication resulting from the collective evolution of the colony. What we observe is that the optimization operates directly on the structure (synapse weights) of the brain networks of the ants, but there is also a higher level optimization in order to create a functional network created by the collaborative behavior of the agents. This behavior is achieved by the development of communication strategies between the agents using the pheromone signals. In essence, the ants form a new network where pheromone signals are used to coordinate the movement of the agents as a whole to efficiently solve the task. We can see this emergent functional effect as the correlations and anti-correlations between directed movement and the sensing of pheromone increase with each generation (see Sect. 3). Based on Fig. 15 it is possible to arrive at the conclusion that the pheromone dropping is uncorrelated to actions and sensing of the environment. However, optimized movement based on pheromone signals makes it possible to have higher concentrations of pheromone around the areas of interest and thus enhance the ability of the swarm to collectively solve the task. We also confirmed the emergence of this functional network when we disabled the pheromone sensor and the colony was not able to efficiently solve the task anymore (see Sect. 3.2).
Interestingly, the emergent communication via a simulated chemical signal resembles the use of positive (attractor) pheromones observed in real ant colonies. Although attractive trails of pheromone are more commonly found in nature, it has been observed that negative (repelling) pheromones are also used in certain species of ants (Robinson et al., 2005). This negative pheromone also known as a “no-entry” signal is used by the ants to mark unrewarding paths to prevent other cohorts from using them. It opens the question of whether further experimentation simulating different evolutionary trajectories could lead to the emergence of negative repelling pheromones among other sophisticated coordination mechanisms in self-organized simulated swarms. Another related question would be to study which environmental and evolutionary requirements are necessary for different signals to emerge within the swarm’s communication repertoire. The usage of the L2L framework allows the modification of the outer loop optimization algorithm, opening the possibility to explore the impact of different evolutionary optimization features in the resulting communication patterns.
At the beginning of this work we formulated two research questions. The results presented in the previous sections answer these. First, the usage of pheromone as a mean of communication and self-organized coordination between agents can emerge in the absence of predefined rules. Neither the mechanism to trigger the release of pheromone nor the mechanism of interpreting these signals was engineered as part of the behavior of the agents. Through this we can infer that the simulated embedded physiological properties of the agents and the characteristics of the environment are exploited by the optimization algorithm. To answer the second research question, the results in Sect. 3.2 illustrate the difference in the performance of the colony in terms of foraging efficiency.
The evolved SNN-based colony with stigmergic communication achieved a performance comparable to the multi-agent rule-based colony.
We would also like to address some of the main shortcomings of our work. First, the genetic algorithm requires several hundreds of generations until it provides a parameter setting which leads to a suitable task performance. We want to investigate other optimization techniques which may decrease the number of generations and result in a similar performance. Second, in this work we use a manually defined network architecture for all individuals. This limits the optimization process and the potential functional capabilities of the ants. Future work optimizing the network architecture could help find new strategies of the ants to use their physiology to efficiently perform the foraging task. Third, even if we did not define any rule about the relationships between input and output actions of the ants, the fitness function used to optimize the network is static and manually defined. This imposes evolutionary pressure on the ants towards specific solutions. Exploring other combinations of the fitness metrics will help us, in future experiments, understand better the strength of such pressure in the emergence of specific behavior and solutions by the colony. Finally, as discussed in the results section, our analysis of the correlations between input and output is also limited and further work needs to be done to fully understand the relationships within the ant networks and the colony as a whole through time.
5 Future work
As future work we want to analyze further the emergence of the communication features in the functional network created by the collective of ants and how this evolves through time guided by the genetic algorithm. In particular, we want to measure the effect of pheromone concentration and evaporation rate in the communication strategy. A way to do this would be to represent the whole colony as functional network where connectivity is defined by spatial coincidence in the environment between one or more ants, signals are represented by pheromone concentration and delays by the pheromone evaporation rate. We also want to explore the usage of plasticity within the ant networks and optimize the learning capabilities of the ants in the inner loop of L2L and see if this capability could further enhance the performance of the swarm. For example, we want to learn the foraging task utilizing synaptic plasticity in the inner loop and optimize the model’s hyper-parameters in the outer loop. In particular, the emergence of connectivity motifs, as emerging from the usage of STDP in Ocker et al. (2015), could be further studied and correlated to specific communication functions in the colony.
During pilot experiments (not shown in this manuscript) we observed that the emergence of stigmergy could be influenced by the number of neurons in the network of each agent. As future work we want to explore the minimal structural requirements (number of neurons, topology, types of synapses, etc) for the SNNs to enable the emergence of collective communication and its effect on functional efficiency of the swarm as a whole.
The emergent foraging behavior that has been described in this work resembles to some extent the self-organisation observed in social insects. Self-organisation is a process, where high order structure emerges (Kauffman et al., 1993). The emergent behavior allows the swarm to collectively adapt to changing environments where the colonies become robust systems even if some individuals fail to perform their tasks. Robustness and adaptability are desired characteristics in the application of robotics, specially for the deployment in changing environments with harsh or extreme conditions where single agents are more prone to failure (e.g. space exploration, undersea navigation, disaster areas (Staudinger et al., 2018; Dorigo et al., 2020)).
Acknowledgements
CR and AY would like to thank Chiara Segala for her input and feedback regarding the correlation analysis. We would like to thank Wouter Klijn and Michael Herty for their ideas, support and useful input. We acknowledge the use of Fenix Infrastructure resources, which are partially funded from the European Union’s Horizon 2020 research and innovation programme through the ICEI project under the grant agreement No. 800858. The authors gratefully acknowledge the Gauss Centre for Supercomputing e.V. (www.gauss-centre.eu) for funding this project by providing computing time on the GCS Supercomputer JUWELS at Jülich Supercomputing Centre (JSC).
Declarations
Conflict of interest
The authors declare that the research was conducted in the absence of any commercial or financial relationships that could be construed as a potential conflict of interest.
Ethical Approval
Not applicable.
Open Access This article is licensed under a Creative Commons Attribution 4.0 International License, which permits use, sharing, adaptation, distribution and reproduction in any medium or format, as long as you give appropriate credit to the original author(s) and the source, provide a link to the Creative Commons licence, and indicate if changes were made. The images or other third party material in this article are included in the article's Creative Commons licence, unless indicated otherwise in a credit line to the material. If material is not included in the article's Creative Commons licence and your intended use is not permitted by statutory regulation or exceeds the permitted use, you will need to obtain permission directly from the copyright holder. To view a copy of this licence, visit http://creativecommons.org/licenses/by/4.0/.
Publisher's Note
Springer Nature remains neutral with regard to jurisdictional claims in published maps and institutional affiliations.
Parameters of the leaky-integrate-and-fire neuron model
Parameter
Setting
Resting potential
\(-70.0\) mV
Spike threshold
\(-55\) mV
Reset potential
\(-70.0\) mV
Refractory duration
1.0 ms
Default amplitude
2000 pA
Table 2
Cost values corresponding to the behavior of an ant utilized in the fitness function
Behavior
Cost
Dropping pheromone
\(-\)0.05
Rotation
\(-\)0.02
Movement
\(-\)0.25
Return nest
220
Touch food
1.5
\(\eta\)
30.0
Every movement, rotation and pheromone drop induces a small punishment while returning to the nest with food and touching the food is rewarded
A.1 L2L: Technical description of the inner loop
The simulations of our models run in the inner loop. After every simulation the performance of the agents is evaluated. To execute the simulation in L2L three functions have to be defined.
create_individual(): One individual is a set of parameters which is to be optimized. In our case we have connections weights and delays. This function is called only once in the initialization phase of the optimization process.
simulate(): In this function the model is invoked and a simulation starts. Additionally, the simulation workflow is steered here.
\(\texttt{bounding\_func()}\): It is possible that in the optimization process parameter ranges can be exceeded (e.g. negative delays). In our setting, this function clips the parameters to defined ranges.
First, the optimizee instantiates an individual within the create_individual() function. Here, weights and delays are created. Weights are uniformly distributed in the range of \([-20, 20]\) and delays are in \([1, \ldots , 7]\). A min-max normalization can be applied on the parameters. Before the simulation is started the parameters are saved into a csv file and later read in by the simulation when creating the network. To run the simulation we use the Python subprocess routine in the simulate() function to invoke the headless mode of NetLogo which then starts the simulation and returns a fitness value after the simulation ends. The specific fitness parameters are defined in Table 2. The optimizee waits until the simulation is finished and collects the results, which are stored in the same aforementioned csv file. Furthermore, to restrict the parameters to not exceed certain ranges we restrain them using the \(\texttt {bounding\_func()}\) function. Weights are clipped to the range of \([-20, 20]\) and delays to [1, 7].
It is important to note that one inner loop has several individuals, i.e., each simulation of one individual is executed in parallel on the high performance computing system (HPC). We conducted our experiments on the JUSUF HPC3 and on a workstation with an AMD Ryzen Threadripper CPU (32 cores), 64GB RAM and Ubuntu OS 21.04.
A.2 L2L: Outer loop optimization
Table 3
Genetic algorithm parameters
Parameter
Value
Cross-over probability
0.7
Blend Cross-over \(\alpha\)
1.0
Mutation probability
0.5
Probability of mutation of each element in individual
0.08
Tournament size k
8
Standard deviation for the Gaussian addition
0.5
Hall of Fame
20
The optimization process which is started after the simulation is run and the optimizee sends the parameters to the outer loop. We optimize utilizing the genetic algorithm (GA). The GA also has its own hyper-parameters, which are initialized in the beginning. In Table 3 we provide the hyper-parameters.
A high cross-over probability ensures a higher cross-over rate and favors a recombination of values (i.e. the chromosomes) between parent and child individuals. The cross-over is applying the blend cross-over method which picks values between the parent chromosomes, but also allows to set a range (\(\alpha\)) outside the parent values. In the tournament selection, the best k individuals are chosen for the cross-over. Best individuals in terms of fitness are stored in the Hall of Fame (HoF). The mutation is responsible for keeping a diversity between the individuals by adding Gaussian noise to the individuals which go into the cross-over step. In the mutation step every value of the individual can be perturbed if a randomly drawn probability is below a given threshold. Higher values ensure a bigger variety in the chromosomes and enable a wider exploration for better performing individuals.