Companies can change the composition of their capital structure by adding (issuing) or reducing (paying out) types of funding. In issues, cash is raised from providers of capital and their claim is increased accordingly. Conversely, payouts refer to those situations in which cash is paid to providers of capital and the value of their claim is reduced accordingly. Both issues and payouts compete with alternative uses of corporate cash, such as investments and building cash reserves.
The impact of environmental (E) and social (S) factors on financial issues and payouts is most obvious through their impact on business models and operations, which in turn affect risk, debt capacity, and cash flows, thereby affecting the degree to which companies can and want to payout cash or issue new capital. As for issues and payouts of E and S themselves, the question is if they exist at all. After all, issues and payouts concern changes in claims that involve cash transfers, but it is not clear what the equivalent of cash could be in E and S. Still, an integrated view on issues and payouts makes sense: given that E and S liabilities affect integrated leverage, they are likely to have implications for integrated payouts as well. The question then is: how to manage issues and payouts, financial in nature, when managing for long-term value? It calls for caution on payouts in the presence of significant liabilities on E or S.
Overview
The previous chapter was about capital structure and its implications for risk. While that chapter mainly discusses given levels of capital structure, this chapter focuses on deliberate changes in capital structure, i.e. those that do not follow directly from operations and their financial results. Companies can change the composition of their capital structure by adding (issuing) or reducing (paying out) types of funding. And in dire situations they may be forced to restructure and replace debt with equity.
In issues, cash is raised from providers of capital and their claim is increased accordingly. Conversely, payouts refer to those situations in which cash is paid to providers of capital and the value of their claim is reduced accordingly. In the various stages of its development, a company might benefit from different types of capital. In aggregate, more companies are likely to succeed if these channels are wide open in a diverse ecosystem of capital providers. Both issues and payouts compete with alternative uses of corporate cash, such as investments and building cash reserves.
Anzeige
In perfect markets, issues and payouts have no value relevance: the change in cash exactly equals the change in the financiers’ claims. However, in practice they may become value relevant due to imperfections such as taxes, information asymmetries, financial distress, and bankruptcy costs.
The impact of environmental (E) and social (S) factors on financial issues and payouts is most obvious through their impact on business models and operations, which in turn affect risk, debt capacity, and cash flows, thereby affecting the degree to which companies can and want to payout cash or issue new capital.
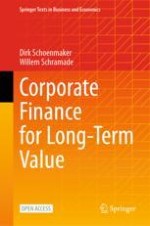
As for issues and payouts of E and S, the question is if they exist at all. After all, issues and payouts concern changes in claims that involve cash transfers, but it is not clear what the equivalent of cash could be in E and S. Even if issues and payouts in E and S do not exist, that shouldn’t stop us from having an integrated view on issues and payouts. Given that E and S liabilities affect integrated leverage, they are likely to have implications for integrated payouts. The question then is: how to manage issues and payouts, financial in nature, when managing for long-term value? It calls for caution on payouts in the presence of significant liabilities on E or S (Fig. 16.1).
An illustration of chapter overview. The first and second chapters have sustainability unaware. The third chapter has E S G integrated or inward view. The fourth chapter has impact or outward view. The fifth chapter has integrated value.
Fig. 16.1
Chapter overview
×
Learning Objectives
After you have studied this chapter, you should be able to:
explain how issues and payouts of equity and debt work, what drives them, and how they affect financial capital structure and value
do basic calculations on the effects of payouts and issues
demonstrate how E and S can affect a company’s payout and issuing policies
explain the relevance and challenges of issues and payouts from the perspective of integrated value
Anzeige
16.1 Issues of Financial Capital
When companies are in need of extra capital, for example to fund investments, they might issue additional capital, in bonds (debt) or shares (equity). They can sell equity either privately in a so-called private placement or in public equity markets. If the equity issue is the first one in public equity markets, it is called an initial public offering (IPO). An IPO changes the status of the company from a private to a public company, which entails additional reporting requirements and costs. For example, in April 2018 the Swedish music streaming company Spotify went public on the New York Stock Exchange. This allowed Spotify employees to sell some of the (hitherto illiquid) shares they had received as compensation since the company’s founding in 2006. It also meant that Spotify had to start disclosing much more information about its financials and operations to the public than it had done previously (see Chap. 17).
While there are over 300 million companies worldwide, only around 40,000 of these companies (0.01%) are stock market listed (source: Statista 2023). Quite a few of those companies also issued shares after listing. Such subsequent equity issues, when the company is already publicly listed, are called seasoned equity offerings (SEOs).
16.1.1 How Issues Work
When companies issue shares or bonds in public markets, they usually do so with the help of a syndicate (group) of investment banks acting as the underwriters or bookrunners of the issue. The underwriters assess the market’s (i.e. their clients’) appetite for the issue to see what amount of bonds or shares can be issued at what price. On a pre-issue roadshow, the underwriters organise meetings between company management and prospective buyers, and they provide an indicative price range. The company itself publishes a prospectus, which is a document that contains detailed information on the issue. Box 16.1 shows what such a prospectus looks like. The underwriters then sell the shares to the ultimate investors at their own risk by giving a ‘firm commitment’. The remaining unsold shares remain on their book. Alternatively, the underwriters can agree to sell as much as possible on a ‘best efforts’ basis.
Box 16.1 Basic-Fit IPO Prospectus
When fitness club chain Basic-Fit did its IPO on the Amsterdam stock exchange in 2016, it published a 288-page prospectus.1 The summary page gives an overview of the amount of shares issued; the expected price range; and the investment banks that make up the syndicate:
Offering of up to 30,666,667 ordinary shares in the capital of Basic-Fit N.V. (the ‘Company’) with a nominal value of €0.06 each (the ‘Ordinary Shares’).
The price of the Offer Shares (the ‘Offer Price’) is expected to be in the range of €15.00 and €20.00 (inclusive) per Offer Share (the ‘Offer Price Range’).
ABN AMRO Bank N.V. (‘ABN AMRO’) and Morgan Stanley & Co. International Plc (‘Morgan Stanley’) are acting as joint global coordinators for the Offering (the ‘Joint Global Coordinators’), and, together with Barclays Bank PLC (‘Barclays’), Deutsche Bank AG, London Branch (‘Deutsche Bank’), and ING Bank N.V. (‘ING’), as joint bookrunners for the Offering (the ‘Joint Bookrunners’). Coöperatieve Rabobank U.A. (‘Rabobank’), KBC Securities NV (‘KBC’), and NIBC Bank N.V. (‘NIBC’) are acting as co-lead managers for the Offering (the ‘Co-lead Managers’). The Joint Bookrunners and the Co-lead Managers, in their respective capacities, are together also referred to herein as the ‘Underwriters’. Lazard is acting as the financial adviser for the Offering (the ‘Financial Adviser’).
The table of contents illustrates the contents of the prospectus:
Summary
Risk factors
Reasons for the offering and use of proceeds
Dividend and dividend policy
Capitalisation and indebtedness
Selected consolidated financial information
Operating and financial review
Our industry
Our business
Management and employees
Selling shareholders
Corporate governance
The offering
Plan of distribution
Selling and transfer restrictions
Taxation
Independent auditors
The parts on ‘our industry’ and ‘our business’ are important for investors to understand the nature of the company’s business model, competitive positions, and value creation process. This allows investors to build informed expectations about the company’s value drivers (sales, margins, capital costs) and hence its valuation.
Just like M&A deals (see Chap. 18), issues tend to come in waves: there are often more issues during times of strong stock market performance. These are called hot markets. Conversely, in times of falling stock prices, called cold markets, fewer issues are done.
Some equity issues are done as rights issues. A rights issue is essentially an invitation to existing shareholders to purchase additional new shares in the company. The idea is to give current shareholders the first ‘right’ to buy, so they can avoid dilution of their shares. Rights issues are often done by companies that need new capital fast due to sudden liquidity problems. The existing shareholders get a claim right, i.e. an option (see Chap. 19 for the valuation of options) to buy the new shares at a discount to what new shareholders pay. This claim right is often tradeable.
Issues in Perfect Capital Markets
As discussed in Chap. 15, Modigliani and Miller (1958, MM) showed that capital structure is irrelevant in perfect capital markets. And the same applies to changes in capital structure, such as issues. Assuming perfect capital markets, let’s see how an equity issue works in terms of its effect on the market value balance sheet of tech company AI-lab. Table 16.1 gives the situation before the equity issue. The company has 5 million shares outstanding.
Table 16.1
The market value balance sheet of AI-lab, in € millions—before an equity issue
A table has the following values. In the first column, F assets 25 and total F assets 25. In the second column, F debt 5, F equity 20, and total F liabilities 25.
Now suppose the company does an equity issue, where it raises €10 million in cash for €10 million in equity (at market value, no discount). Since it has 5 million shares outstanding at a value of €20 million, the value per share is €4. To raise €10 million, the company will have to sell 2.5 million shares (=€10 million/4). As a result, the number of shares rises to 7.5 million, F assets (which includes cash) rises by 10 million, and so does F equity. See Table 16.2.
Table 16.2
The market value balance sheet of AI-lab, in € millions—after an equity issue
A table has the following values. In the first column, F assets 35 and total F assets 35. In the second column, F debt 5, F equity 30, and total F liabilities 35.
The issue in Table 16.2 is value irrelevant, in that the increase in cash exactly equals the claim of the new shareholders. The stock price remains €4 (=€30 million/7.5 million shares). What does change are total capital (assets) and the company’s capital structure. Due to the higher amount of equity and assets, and with debt staying the same, the debt/asset ratio (leverage) falls from 0.2 (= 5/25) to 0.14 (= 5/35).
The Costs of Issues in the Presence of Imperfections
The flipside of the MM argument is that capital structure and issues may be value relevant if capital markets are not perfect. Due to the presence of taxes and the tax deductibility of interest payments, adding debt might create financial value, up to a point where bankruptcy and distress costs start to outweigh the tax benefits (see Chap. 15 and Fig. 16.2 below). This suggests a point (or range) for the optimal capital structure. This point is where the WACC (weighted average cost of capital) is the lowest, because a lower WACC increases enterprise value (see Chap. 13).
A graph of W A C C versus D over V. The W A C C curve initially decreases and then increases. At the point at which W A C C is minimum, horizontal and vertical lines are drawn to the x and the y-axes. The curve is labeled R u at the origin.
Fig. 16.2
Issues and capital structure
×
It depends on one’s starting point, then, to determine if it is better to add or reduce debt. And regardless of the starting point, information asymmetries may play a role: investors may assume management to have superior information and to be selling them lemons (i.e. selling stock without revealing company problems or flaws), and hence they may apply a discount to the value of an equity issue.
Let’s reconsider the equity issue of our company AI-lab and assume that information asymmetries result in a −3% stock price reaction at announcement of the issue (see Tables 16.1 and 16.2 for the situation without information asymmetries). Assuming no change in the value of F debt, the −3% means that both F equity and F assets fall by €0.6 million. The percentage drop in F assets is smaller (0.6/25 = 2.4%). With 5 million shares outstanding before the issue, the share price drops to €3.88 (=19.4/5), a fall, of course, of 3% from €4 (Table 16.3).
Table 16.3
The market value balance sheet of AI-lab, in € millions—at announcement of the equity issue
A table has the following values. In the first column, F assets 24.4, and total F assets 24.4. In the second column, F debt 5, F equity 19.4, and total F liabilities 24.4.
Again, the company aims to raise €10 million in cash for €10 million in equity. However, since that equity just got valued 3% lower, the company will need to offer more shares to raise that €10 million in cash. The company will have to sell 2.57732 million shares (= 10 million/3.88) instead of 2.5 million. As a result, the number of shares rises to 7.57732 million, F assets (which includes cash) rises by 10 million, and so does F equity. See Table 16.4.
Table 16.4
The market value balance sheet of AI-lab, in € millions—at completion of the equity issue
A table has the following values. In the first column, F assets 34.4, and total assets 34.4. In the second column, F debt 5, F equity 29.4, and total F liabilities 34.4.
Of course, this example is quite stylised, as the stock price can change (for all kinds of reasons) in the time period between the announcement and the completion of the issue. Moreover, the value of debt may increase, since debt has become less risky due to the equity issue.
The impact of the abovementioned information asymmetries on the value of the company depends on where the company is in Fig. 16.2. If the company is on the left, issuing equity reduces value. If it is on the right, issuing equity may add value. The overall impact depends on the net effect of the benefit of more equity (reducing WACC) and the cost of information asymmetries.
There are other costs of issues as well. For example, there are the direct transaction costs of hiring the investment banks, law firms, and auditors needed to do the issue. And for companies doing their first public issue, there are the additional costs of going public: all of a sudden, the company needs to meet much higher standards of disclosure. The flipside is that the company becomes more visible (including to its customers) because of its stock listing and related disclosures.
Why Do Companies Issue Capital?
Imperfections make issuing capital costly to companies—but they do still issue. Why? There are two obvious reasons why companies issue equity or debt in spite of the costs. First, they may need cash for investments, and the NPV of the investments can be higher than the negative APV (adjusted present value) of the issue. Companies may, in particular, issue stock to fund large acquisitions (see Chap. 18). Second, the owners of a privately owned company (i.e. existing shareholders) may want to (partially) exit their holdings through an IPO. Once the company is listed on the stock market, owners can sell their remaining shareholdings in the stock market.
Roell (1996) listed additional long-term factors for issuing equity:
Reduce leverage of the company: the equity basis is strengthened and leverage is reduced; companies typically do this to rebalance their accounts after high investment and growth;
Improve liquidity of shares: enhanced liquidity reduces the cost of trading stocks;
Enhanced company image and publicity: the publicity surrounding the flotation and the on-going publicity of a listing are seen as a major advantage;
Motivate employees and management: companies can issue stock to management and employees as part of variable pay to align incentives;
Exploiting mispricing: Sect. 16.1.2 discusses behavioural reasons for issues.
The same author also mentioned important disadvantages:
High costs of issues: transaction costs and need for additional disclosure (in the case of an IPO);
Loss of control and ownership: owners/founders of companies may not want to lose decision-making control of their company (and thus prefer bank funding).
Transaction costs and asymmetric information costs can be substantial for issuing equity. Fama and French (2005) argued that these costs are not always high. Issues to employees, rights issues, and acquisitions financed with stock, for example, have lower transaction costs and minor asymmetric information problems.
The Aggregate View: The Role of Issues in Society
There is also a role for issues beyond the individual company level. Ideally, sufficient funding is available to foster companies in going to their next stage of maturity (see Chap. 10). Companies tend to go through several stages of development, at which they have different funding needs. In advanced economies, there is a plethora of funding types for companies at all stages of development. This allows for more complex and advanced networks (‘ecosystems’) of companies that mutually reinforce each other and society and the local economy. Conversely, if there are gaps in funding, the development of small business (and hence of large business later) can be hampered.
The funnel for stock listings is formed by medium-sized businesses that are typically owned by their founders or by venture capital firms. If a company goes public, it issues equity—an initial public offering (IPO)—to obtain external funding. At a later stage, public companies may also issue equity—a seasoned equity offering (SEO)—for expansion, exits, or covering losses. But as we learned in Chap. 15, companies’ preferred financing method is first retained earnings, then debt and lastly equity, according to the pecking order theory. Yet, more mature companies might generate more cash flows than they need for their investments, and they will do more payouts (see Sect. 16.2) than issues.
In aggregate, in a dynamic and growing economy, most companies are net issuers (i.e. issuing more capital than they payout) and in most years the stock market will on an aggregate basis be a net issuer of equity. In recent decades, however, many developed stock markets have seen negative net issues, suggesting low investment levels.
16.1.2 Behavioural View on Issues
Behavioural issues can also affect issuing activity, both due to internal errors (i.e. by corporate management) and external errors (i.e. by market participants).
Internal Errors
As stated in the earlier chapters, internal errors can occur if management overestimates cash flows or underestimates risk. In terms of capital structure decisions (Chap. 15), this could result in managers levering up by underusing equity. In issues, the effect is likely (but not always) downward: managers that overestimate CF and/or underestimate risk will overvalue their own company and are more likely to judge their company undervalued in the stock market. In that case, they will find issuing equity too costly and might refrain from doing an equity issue.
We can analyse the attractiveness of an issue using the APV (adjusted present value) method, which goes beyond the NPV by considering the funding costs of a transaction. Suppose the manufacturing company ProductCo wants to issue $300 million of new shares at 5% transaction costs. The company is fairly valued by the market (i.e. the company’s market value equals its intrinsic value, which is its valuation based on a fair assessment of expected cash flows and cost of capital). What is the management’s APV of this issue, if management’s valuation of the company’s value versus its intrinsic value is (1) 20% overvalued; (2) 10% undervalued? See Table 16.5 for the calculations.
Table 16.5
APV of equity issue with internal errors
APV components
20% overvalued by management
10% undervalued by management
Plus: cash in
300
300
Minus: management’s valuation of the shares
−360
−270
Minus: transaction costs
−15
−15
Sum: management’s perceived APV
−75
15
In the case in which management overvalues the company (the typical overconfidence/overoptimism case) by 20%, the APV is negative: management feels it is giving away shares for 300 that are worth 360 (120% of 300) and has to pay transaction costs on top of that. This gives a loss of 75. Conversely, in the much-less-typical case of pessimistic management that undervalues the company by 10%, the APV turns positive. Of course, the transaction costs still come in negatively; but they are offset by a perceived gain in value from selling shares for 300 that are worth only 270 (90% of 300) in management’s view.
Please note, however, that this APV calculation might not be complete: management is doing the issue for a reason. It might have an attractive investment project, with a positive NPV. If that NPV is higher than the APV hitherto calculated, the APV turns positive after all. For example, in the case of 20% undervaluation and an APV of −75, management may still do the issue if it allows management to do an investment that (it thinks) has an NPV above 75.
While we show here that managers may underuse equity (because of overvaluation of cash flows and/or underestimation of risk), there are also other behavioural factors at work. Managers in publicly listed companies tend to underuse debt because they opt for a situation without demanding profit targets. High interest payments require sufficiently high profits to meet these payments. So, managers may opt for less disciplining power of debt (see also Sect. 16.2).
External Errors
External errors mean that serious behavioural mistakes are made by the market in aggregate: it may over- or undervalue specific companies, groups of companies or entire market indices. Corporate managers, who might have better information than market participants, can benefit from such misvaluations, for example by issuing equity when their stock is overvalued. And indeed, there is evidence that more companies do stock issues after strong stock performance (e.g. Hovakimian et al., 2001). Corporate executives also admit that they try to time the market: in a survey of CFOs, Graham and Harvey (2001) find that CFOs issue equity when they think their stock is overvalued. Prominent historical issuing examples are the ‘tronics’ boom of the early 1960s (companies with names ending with ‘tronics’) and internet IPOs of the late 1990s (see Fig. 12.7).
Let’s return to our earlier-mentioned company ProductCo that wants to issue $300 million of shares at 5% transaction costs. Now let’s assume that there are no internal errors, but instead external errors, and management is aware of them. What is the APV of this issue, if the market’s assessment of the company’s value is (1) 20% overvalued; (2) 25% undervalued? See Table 16.6 for the calculations.
Table 16.6
APV of an equity issue with external errors
APV components
20% overvalued by the market
25% undervalued by the market
Plus: cash in
300
300
Minus: intrinsic value of the shares
−250
−400
Minus: transaction costs
−15
−15
Sum: APV
35
−115
In the case where the market overvalues the company by 20%, the APV is positive: management knows it will get 300 for shares that are worth only 250 (=300/1.2), a gain of 50 that is higher than the transaction costs of 15. But in the case of a market that undervalues the company by 25%, the APV turns negative. Then, the company knows it will be selling shares for 300 that are actually worth 400 (=300/0.75), a loss of 100. With the transaction costs of 15 on top of that, the resulting loss is 115.
Again, as in the internal errors case, please note that this APV calculation may not be complete, since there could be an investment project involved that affects the APV.
16.2 Payouts to Financial Capital
In payouts, companies return capital to the financiers; payouts are therefore the opposite of issues. Among payouts on equity, one can distinguish dividends and repurchases (also called buybacks). For companies, payouts are a potential use of free cash flow: an alternative to using free cash flow to invest in new projects, to build cash reserves, or to redeem debt in debt buybacks (see Fig. 16.3). As explained later, investments in new projects can be value creative or value destructive. For investors, payouts in the form of dividends and buybacks are a way to get income from their invested funds.
A block diagram lists the corporate uses of free cash flow as follows. Invest in value creative and destructive projects or M and A. Retain to build cash reserves to invest later. Dividends and share or debt buybacks.
Fig. 16.3
Payouts and other corporate uses of free cash flow
×
We start with defining the payout ratio, as payouts divided by net income (net profit):
$$ Payout\ ratio=\frac{Payouts}{Net\ income\ } $$
(16.1)
16.2.1 Payouts in Perfect Capital Markets
Why do companies do payouts? Remember that Chap. 15 presented the MM argument about capital structure irrelevance, which rests on investors’ homemade dividends. Of course, this applies to dividends themselves as well: investors can create their own dividends by selling shares. Just like there is MM capital structure irrelevance, there is also MM dividend (and repurchases) irrelevance (Miller & Modigliani, 1961): dividend policy and repurchases are irrelevant to company value in perfect capital markets. In a perfect capital market, the dividend payment equals the stock’s price drop after the dividend payment, as explained below in Sect. 16.2.3. On the asset side, assets are reduced with the cash amount paid out as dividend. On the liabilities side, equity value is reduced through a drop in the stock price (which is equal to the dividend per share). Leverage (measured as debt to assets) increases, changing the company’s capital structure, but that is irrelevant for company value according to MM.
16.2.2 Payouts with Imperfections
Again, just as with capital structure, the potential value relevance of payouts lies in imperfections and behaviour. Non-behavioural potential explanations for payouts include Free Cash Flow theory, signalling, and taxes.
Free Cash Flow Theory
According to Jensen (1986), managers have a tendency to waste Free Cash Flow (FCF) on negative NPV projects and overconsumption of perks, such as corporate jets. To reduce that waste, Jensen argues, one should reduce FCF, and a way to do so is to (self)discipline management with a dividend policy that reduces its leeway to waste cash in value destructive projects or M&A. Figure 16.4, which is an adaptation of Fig. 16.3, illustrates how that works in the context of corporate uses of cash.
A block diagram of corporate uses of free cash flow. The corporate uses of free cash flow are for investing in value creative and destructive projects or M and A, retaining to build cash reserves to invest later, and payouts for dividends and buybacks of shares and debts.
Fig. 16.4
FCF theory: dividends reduce leeway for value destructive investments
×
But, of course, the counterargument is that it may not only reduce leeway for value destructive investments, but can also hamper value creative investments.
Signalling
Another explanation for the value relevance of payouts lies in their signalling role in alleviating the costs of asymmetric information. Since managers are supposed to have better information about the prospects of the company than outside investors, high and rising dividends effectively signal high company quality, as opposed to low-quality companies that cannot afford to make the signal (Bhattacharya, 1979). Companies may engage in dividend smoothing: they don’t link dividends directly to earnings but make sure that they pay a dividend that is at least as high as in the year before. And indeed, as early as seven decades ago, Lintner (1956) found in a survey that companies establish long-run target payout ratios. Given these target payout ratios, managers prefer to smooth dividends (i.e. no changes to the existing payout ratio) except when there are good reasons which investors would understand (e.g. a major loss). And the survey by Brav et al. (2005) finds that little has changed. Smoothing makes dividends less volatile than earnings. Dividend smoothing suggests there is information in dividends: it’s an indication of management’s expectation of future earnings. After all, the future dividends will have to be paid out of future earnings. In the Brav et al. (2005) survey, 75% of executives see dividends as a conveyor of information.
Signalling also means that dividend cuts are received in a very negative way, with negative stock price reactions, since they are interpreted as a change for the worse in prospective earnings. And indeed, dividend cuts are often the result of disappointing profits, as in the headline of this Fortune article:2 ‘Mining Giant Rio Tinto Scraps Boom Time Dividends as Profits Plunge’. The signal is even stronger if it comes after decades of stable dividends, such as in this CNN article:3 ‘Royal Dutch Shell has slashed its dividend for the first time since World War II after profits were wiped out by a historic collapse in oil demand caused by the coronavirus pandemic’. The article reports an 8% price drop in the Royal Dutch Shell stock price on that day (30 April 2020).
16.2.3 Dividends
Cash dividends are cash payments to shareholders, often on an annual basis, without getting something in return. The number of shares stays the same, but their value drops. In repurchases (also known as buybacks), the company buys back shares from its shareholders. So, cash leaves the company and the number of shares is reduced. Because some investors have to pay income tax on received dividends, share repurchases are often more tax-efficient than cash dividends.
How Do Dividends Work?
A company’s board of directors determines the amount and timing of the dividends paid by the company. Box 16.2 shows the timeline of a particular dividend payout by Telenor.
Box 16.2 Timeline of the Telenor 2020 Dividend
Telenor, a Norwegian telecom operator with operations across the globe paid a NOK 5 and a NOK 4 dividend on its 2020 fiscal year. The timeline of the NOK 5 dividend payment is shown below:
A timeline of Telenor dividend. Proposed, 2 February 2021. Approved, 27 May 2021. Ex-dividend, 28 May 2021. Record date, 31 May 2021. Payout, 9 June 2021.
×
The dividend was proposed in February of 2021, i.e., after the closing of the 2020 results. Almost 4 months later, the dividend was approved. The next day, the share went ex-dividend (i.e. the share price drops by the dividend amount). The ex-dividend date is the trading date on (and after) which the dividend is not owed to a new buyer of the stock. The record date, 3 days later, is the cut-off date used to determine which shareholders are entitled to a corporate dividend. Nine days later than that, the dividend was paid to all eligible shareholders.
Source: based on data on the Telenor investor relations website
A dividend payout is typically part of a dividend policy, which is the policy of a company to structure its dividends. For example, a company might have the policy of paying 30% of its net income in dividends (‘a 30% payout ratio’); or it can have the policy of always paying at least as much dividend as the previous year (‘a stable dividend policy’). Such stability can be expressed either in fixed amounts or in fixed payouts (see Box 16.3 on Komatsu for an example of a fixed payout ratio). A dividend policy can be maintained for a very long time: a Nasdaq article4 gives the examples of PPG, Target, and Sysco, which are ‘dividend kings’, companies that have increased their dividend payouts for 50 consecutive years.
Box 16.3 Komatsu Dividend Policy
Komatsu (ticker: 6301 JP) is a Japanese machinery company that builds heavy equipment for construction, mining, forestry, and industrial applications. The company has the following stated dividend policy:
Komatsu is building a sound financial position and enhancing its competitiveness in order to increase its sustainable corporate value. Concerning cash dividends, Komatsu has the policy of continuing stable payment of dividends after comprehensively considering consolidated business results and reviewing future investment plans, cash flows, and the like. Specifically, Komatsu has the policy of maintaining a consolidated payout ratio of 40% or higher.
Source: Komatsu investor relations website.
Let’s consider the dividend calculations for fictional Swiss company Pasteur Pharma, for which the market value balance sheet is shown in Table 16.7. Table 16.8 provides further financials that allow for the calculation of the dividend metrics of Pasteur Pharma.
Table 16.7
The market value balance sheet of Pasteur Pharma, in CHF millions—before a dividend payment
A table has the following values. In the first column, F investment projects 760, F cash 63, and total assets 823. In the second column, F debt 112, F equity 711, and total F liabilities 823.
Table 16.8
Dividend calculations for Pasteur Pharma
Number of shares outstanding, millions
3
Value per share, CHF
237
Net profits, CHF millions
66
Payout ratio
50%
Total dividend paid, CHF millions
33
Dividend per share, CHF
11
Dividend yield
4.6%
Pasteur Pharma has 3 million shares outstanding, with a per share value of CHF 237 (=CHF 711 million/3 million). The company has a dividend policy of maintaining a 50% payout ratio. In the most recent fiscal year, the company made a profit of CHF 66 million. Hence, it proposes, approves, and pays a dividend of CHF 33 million (=50% × CHF 66 million). The rest of the net profit is retained. Per share, the dividend is CHF 11 (=CHF 33 million/3 million). This gives a dividend yield of 4.6% (=CHF 11/CHF 237).
In comparison with Table 16.7, the results of the dividend payment for Pasteur Pharma’s market value balance sheet are a drop in cash of CHF 33 million and, if the stock price reaction exactly equals the dividend payment, a drop of the same size in F equity. In the above example, the company has sufficient cash to pay its dividends. However, there are also companies whose cash flows and cash positions are not sufficient to meet their dividend commitments. They will have to cut their dividends or borrow to pay their dividends.
A special dividend is a one-off dividend payment that is not part of a company’s dividend policy of recurring dividends. Special dividends are typically paid after a windfall profit or another type of one-off cash flow, such as the disposal of a business unit. For example, in 2017 the UK utility company National Grid Plc had £4 billion in proceeds from the sale of a 61% stake in the UK Gas Distribution business. The company paid out the £4 billion to its shareholders through a £3.2 billion special dividend and the remainder through share buybacks.5
Stock Dividend: Not a Real Payout
Companies can also pay dividends in stock instead of shares. For example, a shareholder may receive one additional share for every share already owned. However, this is not really a payout: no cash goes from the company to the shareholders. The only thing that changes is the number of shares outstanding. The total value of the shares stays the same, and the value per share falls. Something similar happens in a stock split, but with more dramatic numbers: instead of each shareholder receiving say one share per 30 shares owned, each share is replaced by say 15.
So, the number of shares rises marginally in a stock dividend (by 3.3% in the case of a 1:30 stock dividend), but dramatically in a stock split (by 1400%, i.e. [15–1]/1 × 100% in the case of a 15:1 stock split). What both cases have in common is that existing shareholders get new shares in proportion to their current holdings, and no cash. Table 16.9 shows the impact of a stock split on the share price and on the number of shares if there is no value effect. The number of shares increases indeed with 1400% from 80 to 1200: 1120 = 80*1400%.
Table 16.9
Stock split example
Value before the 15:1 stock split
Value after the 15:1 stock split
Stock market value, € billions
26
26
Number of shares, millions
80
1200
Value per share, €
325
21.67
Stock splits are typically undertaken on shares with a high price per share, so as to improve tradability and access for small shareholders. It is not possible to buy fractional shares. For example, in the case of Nintendo’s 2022 10-for-1 stock split, retail investors ‘had been asking for a split for months to boost liquidity, affordability and reach’, according to a Forbes article,6 and: ‘The split reduced the per-share price from around 59,700 yen (about $413) on Wednesday to 6,043 yen (about $41.76) by Thursday’s close’. Other companies that did stock splits in the early 2020s include Apple, Amazon, Alphabet, and Tesla; all companies with a large increase in market value resulting in high prices per share.
16.2.4 Share Repurchases
Instead of paying dividends, a company can also pay out cash to its shareholders by buying shares in a share repurchase—also known as a share buyback. There are two ways to do buybacks: open market operations; and tender offers. Since a buyback results in extra demand for the shares, it can drive up the share price.
In open market share repurchases, a company buys back shares in the market. The actual buying is typically done by a specialised investment services provider. See the Bekaert example in Box 16.4.
Box 16.4 Bekaert Share Buyback Programme
Belgian company Bekaert is a producer of steel wires and coatings. In February 2022, in the press release on its 2021 Full Year Results, Bekaert outlined its payouts policy, consisting of an increase in its (fixed) dividend and an open market share buyback programme:
The Board of Directors seeks to maintain a balanced approach between funding future growth and enhancing shareholders’ returns.
The Board will propose to the Annual General Meeting of Shareholders in May of 2022 a 50% gross dividend increase to €1.50 per share.
In addition, the Board has approved a share buyback program of an amount up to € 120 million, to be initiated in the coming weeks. Under the program, Bekaert may repurchase outstanding shares for a maximum consideration up to €120 million, over a period up to twelve months.
The purpose of the program is to reduce the issued share capital of the company. All shares repurchased as part of this arrangement will be cancelled. The program will be conducted under the terms and conditions approved by Bekaert’s Extraordinary General Meeting of 13 May 2020. Bekaert will appoint an investment services provider to execute the repurchases of shares in the open market during open and closed periods.
Seven months later, the company issued a press release to give an update on the buyback programme. The update said that company’s investment services provider, KeplerCheuvreux, had bought 64,030 shares for €1,883,734 over the 1–7 September period, in the context of the third tranche (part) of €30 million.
In a tender offer, shareholders receive an offer that asks them to submit (tender) a portion of their shares within a certain time frame. The offer usually states the number of shares and the price or price range to be paid. For example, in November 2021, Irish mining company Kenmare Resources, listed in London, made a tender offer to purchase up to 13.5% of the company’s outstanding shares at £4.17 per share.7
Taxes on Dividends & Buybacks
Taxes are generally an argument against dividends and in favour of share repurchases. This is because in most tax regimes, dividends are more heavily taxed than capital gains and repurchases. This tends to favour buybacks over dividends. However, there is a twist: tax rates on dividends and capital gains differ across shareholders, with some (institutional) shareholders, such as pension funds, even being tax-exempt. This allows for dividend capture and tax clienteles. Dividend capture theory says that in the absence of transaction costs, investors can trade shares at the time of the dividend so that non-taxed investors receive the dividend. Corporate management can cater to this and optimise its dividend policy for the tax preference of its investor clientele (clientele effects).
Additional Reasons for Buybacks
In addition to the above reasons, companies may also engage in buybacks for lack of investment opportunities or to cover for compensation plans. For example, in June 2022 Dutch medical equipment maker Philips announced it would repurchase up to 3.2 million shares to cover long-term incentive and employee stock purchase plans.8 Another reason to do buybacks is to boost EPS (earnings per share, which rise as there are less shares outstanding) and hence compensation tied to EPS. The survey by Brav et al. (2005) found that ‘Many managers now favor repurchases because they are viewed as being more flexible than dividends and can be used in an attempt to time the equity market or to increase earnings per share. Executives believe that institutions are indifferent between dividends and repurchases and that payouts policies have little impact on their investor clientele’.
Edmans et al. (2022) investigated the long-term consequences of actions induced by vesting equity. In line with Brav et al. (2005), they found that vesting equity, which is a short-term compensation measure, is positively linked to the probability of a company repurchasing shares and the amount of shares repurchased. Vesting equity is also associated with more negative long-term returns over 2–3 years following repurchases.
Dividends Versus Share Buybacks
Figure 16.5 shows that share buybacks are most common in the USA, where they account for around 3% of total market capitalisation and bigger than dividend payouts, which are 2% of total market cap in the USA. Next are the European countries with buybacks between 1 and 2% of total market cap. Finally, the Asian-Pacific countries have share buybacks of less than 1% of total market cap. Countries with lower share buybacks typically have higher dividend payouts. Figure 16.5 reports numbers for the year 2018 (FCLT Global, 2020). Since then, share buybacks have become more popular in Europe as well overtaking dividends in size, like in the USA.
A double bar graph of share buybacks and dividends of 7 countries. The buybacks in the United States are the highest at 3.2%, and the lowest in China at 0.1%. The dividends in Australia are the highest at 4.3%, and the lowest in the United States and Japan at 2%.
Fig. 16.5
Dividends and share buybacks as a % of total market capitalisation (2018). Source: Adapted from FCLT Global (2020)
×
Total payouts (dividends and buybacks) fluctuate between 3 and 6%. So, the key difference between the countries is the composition of payouts (dividends or buybacks) and not the level of payouts.
16.2.5 Behavioural View on Payouts
In Sect. 16.1 we explained how internal errors, i.e. management overestimating CF or underestimating risk, could affect issue activity. Likewise, management could be tempted to pay too-high dividends or do too-big share repurchases as they overestimate future earnings and underestimate risk (e.g. DeAngelo et al., 1996). However, management’s overoptimistic view could also result in more investments, which leave less cash on the table for payouts. It’s not obvious which effect dominates. At any rate, payout policy under internal errors can give a distorted signal on the company’s prospects.
Dividends can also be seen as a reaction to external errors, i.e. irrational market behaviour. According to Shefrin and Statman (1984), a strong rationale for paying dividends lies in catering to three investor needs:
Self-control (Thaler & Shefrin, 1981): the act of exercising control over one’s impulses, usually to delay gratification. Dividends make people less reliant on the tough job of self-control in that they make the payouts automatic, so that people do not have to produce the dividends themselves by selling a proportion of their shares on a regular basis;
Mental accounting: this is the segregating of the overall gain or loss into several components, so as to have manageable pieces. A specific case is hedonic editing: people prefer to experience gains separately rather than together. Dividends help people in their hedonic editing by providing a separate component of gains;
Regret avoidance: people hate to feel regret, which is typically stronger for acts of commission than for acts of omission. This means that people feel more regret over selling shares too early (too cheaply) than for not reinvesting dividends in that same stock.
The need for catering provides the following dividend heuristics (Shefrin, 2007):
Pay a severe ‘penalty’ (in the form of damaged trust of investors) for cutting dividends;
Meet investors’ expectations (set according to the company’s history and its stability of earnings) about the magnitude and form of payout;
Do not deviate from competitors;
Maintain a good credit rating.
Like dividends, repurchases can also be made to benefit from external errors. A survey by Brav et al. (2005) finds that 87% of CFOs admit that they try to time their repurchases to benefit from their company’s overvaluation by the market. And the findings of Ikenberry et al. (1995) indicate that repurchasers seem to time successfully. From management’s perspective, the value of doing a repurchase can be assessed using an APV analysis. Example 16.1 shows the impact of over- and undervaluation on repurchases.
Example 16.1 Repurchases with over- and Undervaluation
Problem
Suppose a company wants to buy back $300 million of its own shares at 5% transaction costs. What is the APV of this repurchase, (a) if the company is 20% overvalued by the market; (b) if the company is 30% undervalued by the market?
Solution
Let’s first calculate the APV. As in Sect. 16.1, we can make a table to calculate the APV components (see Table 16.6).
Table 16.10 shows an APV of −$65 million in the case of an overvaluation of 20%. That is a combination of the negative valuation effect of −$50 million (= −$300 + S250 million) and the transaction costs of −$15 million. In the case of undervaluation, the APV is $85 million, which is the sum of an overvaluation of $100 million and transactions costs of −$15 million. The $100 million gain from a company perspective comes at the expense of the shareholders from whom the company is repurchasing the shares.
Table 16.10
APV of an equity repurchase with external errors: overvalued vs undervalued
APV components
20% overvalued by the market
25% undervalued by the market
Minus: cash out
−300
−300
Plus: intrinsic value of the shares
250
400
Minus: transaction costs
−15
−15
Sum: APV
−65
85
16.3 Relevance of E and S for Issues and Payouts of Financial Capital
The previous sections discussed the drivers of issues and payouts on financial capital. It is mostly through those drivers that E and S affect issues and payouts on financial capital. As E and S affect business models and operations, they also affect risk, debt capacity (that is the amount of debt that the company can sustainably service), and cash flows, thereby affecting the degree to which companies can and want to payout cash or issue new capital.
16.3.1 Internalisation of Risks
There are various ways in which S and E hit issues and payouts. The most obvious way is in the sudden internalisation of E and S risks when they materialise in litigation payments. For example, Bayer made dividend cuts in 2021, after litigation on E issues hit 2020 profits and cash flows. The Bayer litigation costs are discussed in Box 18.3 in Chap. 18. Another example of cutting dividends and adjusting dividend policy is BP after the Deep Horizon oil spill, as discussed in Box 16.5.
Box 16.5 BP Cuts Dividend After Deep Horizon Oil Spill
The example of the Deep Horizon oil spill was mentioned in Chap. 1. One of the consequences of that disaster was that BP had to adapt its financial policies, including a curtailment of its dividend payments. In a press release on 16 June 2010,9 the company announced that it established a $20 billion claims fund for the Deepwater Horizon spill. Moreover, BP explained how it will fund that $20 billion. Firstly, by drastically reducing investments and increasing divestments:
To further increase the Company’s available cash resources, the Board intends to implement a significant reduction in organic capital spending and to increase planned divestments to approximately $10bn over the next twelve months.
In addition, it says it cuts dividends:
As a consequence of this agreement, the BP Board has reviewed its dividend policy. Notwithstanding BP’s strong financial and asset position, the current circumstances require the Board to be prudent and it has therefore decided to cancel the previously declared first quarter dividend scheduled for payment on 21st June, and that no interim dividends will be declared in respect of the second and third quarters of 2010.
The announcement resulted in a positive stock price reaction, which is atypical. This reflected a relief with the market that there was more clarity on the financial size of the disaster, and the company’s realism to react to it.10
BP’s dividends (in pound sterling per share) over the 5 years surrounding the disaster were as follows:
A bar graph of B P quarterly dividends plots a fluctuating trend. The dividend is the highest at 9.9 in the fourth quarterly, 2008, followed by 9.8 in the first quarterly, 2009. There are no dividends from the first quarterly to the third quarterly, 2010. Values are estimated.
×
Dividends resumed in the fourth quarter of 2010, but at a structurally lower level than before the oil spill. The lower dividend payouts constitute a change in BP’s dividend policy.
A less obvious way for E and S to hit issues and payouts is through internalisation over time. This is similar to the airline example in Chap. 15, where the company’s debt capacity was reduced by internalisation of an E liability, which would also reduce the company’s sustainable payout ratio. As described in Chap. 2, internalisation can be driven by regulation, technological change, or changing consumer preferences—or a combination thereof. For example, high carbon prices and other types of climate change mitigation regulation can make certain business models unviable and force companies to invest in new technologies. Higher capex (investment) reduces FCF. Reduced FCF in turn reduces the scope for dividend payments and stock buybacks and increases the need for debt or equity issues. See the example in Table 16.11 of hypothetical company Philtronics whose profits plunge. It takes Philtronics 3 years and heavy capex to rebuild its business model and restore profitability.
Table 16.11
Cash flow statement of Philtronics—without dividend cut
2022
2023
2024
2025
2026
2027
Net profit
140
−45
−58
−33
76
187
Depreciation
20
20
22
22
22
22
Capex
−25
−86
−94
−67
−23
−23
FCF
135
−111
−130
−78
75
186
Dividend (fixed)
60
60
60
60
60
60
Payout ratio
43%
−133%
−103%
−182%
79%
32%
Cash position without dividend cut
247
76
−114
−252
−237
−111
In spite of its negative FCF, Philtronics continues to pay its dividend. As a result, its cash position goes negative, and Philtronics will be forced to borrow. Philtronics can also choose to cut its dividend and suspend it until both its FCF and its cash position turn positive—as illustrated in Table 16.12. Both paths are visualised in Fig. 16.6.
Table 16.12
Cash flow statement of Philtronics—with dividend cut
2022
2023
2024
2025
2026
2027
Net profit
140
−45
−58
−33
76
187
Depreciation
20
20
22
22
22
22
Capex
−25
−86
−94
−67
−23
−23
FCF
135
−111
−130
−78
75
186
Dividend (fixed)
60
0
0
0
0
60
Payout ratio
43%
0%
0%
0%
0%
32%
Cash position with dividend cut
247
136
6
−72
3
129
A line graph of the cash position of Philtronics in million dollars versus years. The lines of cash position with and without dividend cut decrease from (2022, 250) to the lowest in 2025, and increase to (2027, 30) and (2027, minus 99), respectively. Values are estimated.
Fig. 16.6
Cash position of Philtronics—with and without dividend cut
×
Whether the negative cash position is tenable or not will also depend on Philtronics’s starting leverage: if it is already quite levered, it might not be able to re-finance. It may be forced to restructure, i.e. shareholders give up power to creditors and debt is swapped for equity.
Effectively, this means that the debt capacity of companies with large negative externalities should be limited. After all, such negative E and S exposures might force companies to go through a painful business model change that requires them to invest more in solutions while profits plunge. This could have happened to carmaker VW, which made heavy investments in electric vehicles (EVs) after the Dieselgate scandal. The Forbes headline at the time (31 January 2022) said: ‘VW is making an $180 billion bet to dominate EVs and catch Tesla’. However, as VW profits did not plunge, it could afford the heavy capex while maintaining its dividends.
As value destruction on E and S puts future cash flows at risk, this should make payouts less likely for a prudent and ethical manager. An example with a perverse spin is Unilever, which chose a path of conservative payouts and capital structure, making it a takeover target for Kraft Heinz (see Chap. 18).
However, value destruction on E and S probably makes payouts more likely for an imprudent and short-term minded manager who wants to ‘milk the cash’ and maximise his bonus. Examples of this perverse effect are the US airlines that emerged from Chapter 11 bankruptcy, then used their cash flow to make about $200 billion in stock repurchases before they collapsed during the Covid-19 pandemic, and had to be bailed out.
16.3.2 Internalisation of Opportunities
While E and S risks can affect payouts and increase the need to do issues (to raise fresh funding), E and S opportunities work in the opposite way. A positive contribution to E and S creates value, which is embodied in E and S assets. These assets strengthen a company’s capital structure. Furthermore, internalisation of E and S opportunities is likely to increase a company’s financial position in the future.
A company example of E assets is the Danish company, Novozymes, which produces bioenergy for low-carbon fuels for the transport sector. The transport sector plays an important role in the energy transition (see Chap. 2), as transport counts for 37% of global CO2 emissions from end-user sectors (source: IEA). The transport sector is, just like other industries, adopting net zero targets for their carbon emissions. At the same time, carbon taxes are rising to the tune of €100 per tonne of CO2 in the European Union. So, the demand for low-carbon fuels is likely to increase. Box 16.6 calculates that Novozymes’ annual E flows amount to €1.16 billion, compared to an annual profit of €0.40 billion. The expected (partial) internalisation of these E flows will likely strengthen Novozymes’ financial position. If that happens, Novozymes can increase its dividend payouts and redeem debt. If needed, Novozymes is also able to issue debt (or equity) to finance expansion of production, given its strong asset position.
Box 16.6 Environmental Assets at Novozymes
Novozymes, a Danish enzyme maker (see Box 9.1), reports that its bioenergy solutions helped the transport sector save 60 million tonnes of CO2 emissions in 2021 by enabling the production of low-carbon fuels. Novozymes’ own CO2 emissions were only 0.3 million tonnes, which it aims to halve by 2030.
We can calculate Novozymes’ net E flows, as sum of E assets (saved client emissions) minus E debt (its own emissions). To be conservative, we attribute 10% saved client emissions to Novozymes. Net E flows are 5.7 million tonnes of CO2 emissions: 10%*60 million tonnes—0.3 million tonnes. As in Chaps. 5 and 11, we use a shadow carbon price of €204 per ton of CO2 in 2021. This results in a net annual E flow of €1.16 billion.
Another example of E assets surprisingly comes from the construction sector. Construction companies are currently using very carbon-intensive cement as a main building material. In contrast, timber, an alternative building material, is carbon-positive because it stores carbon (as trees grow they absorb carbon; when they are used for construction, the carbon is preserved or ‘stored’). In the transition to a circular economy (see Chap. 2), construction companies that are ahead in wood construction systems in the building process can financially capitalise on their E assets.
There are also opportunities on S. A company that invests in training its staff thereby creates an S asset. A bottleneck in the transition to electric vehicles is access to sufficient software engineers, as discussed in Chap. 2. Car manufacturers that are ahead in retraining their mechanical engineers (for producing combustion engine vehicles) into software engineers (for producing electric vehicles) are creating an S asset. This S asset may give them a competitive advantage in the transition to electric mobility. This may in turn improve their financial position and enable them to increase dividend payouts and/or redeem debt.
16.3.3 Impact of Governance and Organisational Capital on Payouts
A more subtle impact of S factors on issues and payouts is through governance and the nature of organisational capital and (intangible) assets. Organisational capital represents the knowledge, capabilities, and business processes that integrate human skills with physical capital to enhance organisational efficiency. On governance, Ye et al. (2019) find that higher board gender diversity facilitates better corporate governance and results in higher dividends. Similarly, Chen et al. (2017) find that companies with a larger fraction of female directors have higher dividend payouts. On organisational capital, Hasan and Uddin (2022) find that both the likelihood, and the levels, of cash dividend distribution and share repurchases are significantly higher for firms with more organisational capital.
16.4 Issues of and Payouts to Social and Natural Capital
Whereas the shareholders provide (financial) equity capital, the other stakeholders provide social and natural capital to the company. These other stakeholders include employees, customers, suppliers, and local communities in which the company operates. The broad definition of stakeholders adopted in this book (see Chap. 3) also covers future stakeholders, representing the environment and people not yet born.
Transfers to and from stakeholders are made in the course of companies’ operations. Hence, the value of E assets, E liabilities, E equity, and their S equivalents change over time, just like their F equivalents. However, it is not clear whether such transfers also take the form of payouts and issues as described in the previous sections, i.e. happening outside the context of the operations, in explicit and deliberate transactions. Perhaps the restoration of damages can be seen as such, but we are not sure. What is clear is that there is one crucial difference between the financial balance sheet, on the one hand, and the E and S balance sheets, on the other hand: the presence of cash on the F balance sheet that allows for issues and payouts.
Table 16.13 illustrates the role of cash in changes in F debt and F equity, as discussed in the previous sections of this chapter. The general rule is that issues of F debt or equity increase the amount of cash, while payouts on F debt or equity draw down cash. Of course, a company can issue debt to repurchase equity. But even that transaction is conducted through cash holdings, as the issue is typically scheduled ahead of the repurchase.
Table 16.13
Issues and payouts in the market value financial balance sheet
A chart of issues and payouts in the market value financial balance sheet. The N P V of projects and cash are under assets. The F debt and F equity are under liabilities and equity. The F debt and F equity affect the cash. There is a bidirectional relation between F debt, F equity, and cash.
Table 16.14 illustrates the E balance sheet, which can also be drawn for the S balance sheet. Of course, deliberate changes to the balance sheets of E and S are possible. For example, a company could decide to adopt a much less carbon-intensive production process, thereby drastically reducing its future emissions and hence reducing its E debt. However, this improvement (in the form of lower E liabilities) takes place in the company’s operations and cannot be considered as a payout (see Table 16.15).
Table 16.14
Absence of the equivalent of cash in the E balance sheet
A table has E assets and assets in column 1 and E debt, E equity, and liabilities and equity in column 2.
Table 16.15
Changes in the E balance sheet through business model changes
A table has E assets and assets in column 1 and E debt, E equity, and liabilities and equity in column 2. A downward arrow is near E debt and an upward arrow is near E equity.
And what about strategic changes, such as selling polluting business units and thereby reducing E debt? This means that those assets are shifted outside the boundaries of the company. However, the E debt still exists and no E payout can be identified. If such a business unit is closed down instead of sold, the E debt to (future) stakeholders does disappear. But still, it is hard to see a payout.
There may not be an E or S equivalent of cash itself, but there are E and S equivalents of cash flows: value flows on E and S (see Chap. 5). The value flows are the flows of E and S generated by company’s activities. They are the drivers of the E and S assets and liabilities. In sum: business operations determine changes in F value, S value, and E value, which accrue to (or are taken from) relevant stakeholders. Both financial issues and payouts, as discussed in this chapter, are cash transfers with financial stakeholders.
16.5 Integrated View on Issues and Payouts
In Sect. 16.4, we concluded that there do not seem to be payouts and issues on E and S, due to the absence of cash or an equivalent on the balance sheets of E and S. However, there are value flows on E and S; and E and S can affect financial payouts and issues (Sect. 16.3). These insights allow us to build an integrated perspective on payouts and issues. This should help to answer the following question: how to manage financial issues and payouts, when managing for long-term value?
This perspective should help with avoiding highly value destructive payouts that hurt either the company or its stakeholders, or both. Some go even further, Lazonick et al. (2020) argue that stock buybacks are dangerous for the economy and society: ‘Stock buybacks made as open-market repurchases make no contribution to the productive capabilities of the firm. Indeed, these distributions to shareholders, which generally come on top of dividends, disrupt the growth dynamic that links the productivity and pay of the labor force. The results are increased income inequity, employment instability, and anaemic productivity’. And: ‘When companies do these buybacks, they deprive themselves of the liquidity that might help them cope when sales and profits decline in an economic downturn’.
However, this universally negative verdict on stock buybacks might be too negative. Rather, we would prefer to take an integrated perspective, which allows one to reach a verdict that is better tailored to a specific company and its context. We therefore introduce the integrated payout ratio, defined as payouts divided by net integrated income:
The net integrated income is a company’s integrated profit, which can be derived from its integrated profit & loss account (see Chap. 17). Similar to the financial payout ratio in Eq. 16.1, an integrated payout ratio that (structurally) exceeds 100% indicates payouts to financial stakeholders at the expense of social and environmental stakeholders.
To illustrate how the net integrated income can be calculated, we provide the net flows for each component (E, S, and F) for fictitious company FootPrint (see Table 16.16). The integrated flows statement allows us to calculate an integrated payout ratio.
Table 16.16
Integrated flows statement of company FootPrint
Positive
Negative
Net
Payouts
E value flows
1
−12
−11
S value flows
9
−2
7
F value flows
6
0
6
Payout
4
Financial payout ratio
67% (= 4/6)
Net integrated flows
16
−14
2
Payout
4
Integrated payout ratio
200% (= 4/2)
Company FootPrint has net positive integrated value flows (i.e. net integrated income) that are composed of net positive value flows on S and F, but net negative value flows on E. The negative E flows are clearly the company’s main problem. From a purely (and narrowly) financial perspective, FootPrint’s payouts of 4 look reasonable since they are below its net profit (net financial income) of 6. This gives a (financial) payout ratio of 67% (= 4/6).
However, from an integrated perspective, the company’s payouts look excessive since they are twice as high as its net integrated value flows of 2. The integrated payout ratio is 200% (= 4/2). Moreover, it seems irresponsible to return cash to shareholders if value flows on E or S are highly negative, as they are in FootPrint’s case for E (−11 on a net basis).
16.5.1 Integrated Payout Test
The negative E flows make FootPrint’s high financial payout (67% of net profit) questionable. Would it not be better for management to cut the dividend and raise investments to fix the net negative E flows? And ideally, this is done in such a way that the business model is changed to become resilient and future fit. This is not an extreme example: many companies have a seemingly reasonable financial payout ratio while consistently destroying value on E and/or S.
Ang and Lambooy (2022) argue that society should not tolerate that. They propose an integrated payout test: let payout policy depend not just on the level of financial capital (i.e. driven by financial metrics) but also on a test of the level of social and natural capital. This integrated payout test is based on financial, social, and environmental metrics.
Of course, one could argue that we are still a long way from companies reporting at this level. Nevertheless, auditing rules already require companies to take provisions when they are aware of contingent social or environmental liabilities which can turn into payment for damages (e.g. through court cases). And data on social and environmental liabilities are improving. Investors and other stakeholders can make educated guesses on the sizes of these flows. And internally too, managers could and should do this analysis to determine appropriate payout levels.
16.5.2 Inditex Case Study
We can now calculate the payout ratios for Inditex. Example 16.2 gives the basic data and shows the calculations. While Inditex’s financial payout ratio looks quite common at 67%, Inditex’s integrated payout ratio is 296%. The high integrated payout ratio, which is well above 100%, indicates that Inditex’s large payout to its financial stakeholders is at the expense of other stakeholders, such as workers in its supply chain and future generations.
Example 16.2 Calculating the Payout Ratios of Inditex
Problem
For 2021, Inditex made a net profit of €3.25 billion and paid €2.19 billion in dividends (Inditex Annual Report 2021). Inditex’s social and environmental value flows are as follows: positive social flows €4.10 billion; negative social flows −€2.88 billion; and negative environmental flows −€3.73 billion (all numbers from Chap. 11).
Please calculate Inditex’s financial payout ratio and its integrated payout ratio.
Solution
Let’s first make an overview of Inditex’s value flows, like in Table 16.16. Table 16.17 provides the integrated value flows statement of Inditex for 2021.
Table 16.17
Integrated value flows statement of Inditex, in € billions, 2021
Table 16.17 shows net integrated flows of $0.74 billion for 2021. Inditex’s financial payout ratio is 67% (= 2.19/3.25) and its integrated payout ratio is 296% (= 2.19/0.74). The integrated payout ratio is far higher than the financial payout ratio, because the net integrated flows are lower than the net profit.
16.5.3 Novozymes Case Study
We can also calculate the payout ratios for Novozymes, introduced in Box 16.6. Table 16.18 provides an overview of the financial and environmental flows, which enable us to calculate the payout ratios. The financial payout ratio is 53%, which is quite common. The integrated payout ratio is very low at 13%, which is caused by the large net E flow. This low integrated payout ratio leaves ample scope for future payouts. Novozymes thus offers an attractive investment opportunity from an integrated perspective.
Table 16.18
Integrated value flows statement of Novozymes, in € billions, 2021
In issues, cash is raised from providers of capital and their claim is increased accordingly. Conversely, payouts refer to those situations in which cash is paid to providers of capital and their claim is reduced accordingly. In the various stages of its development, a company might benefit from different types of capital. In aggregate, more companies are likely to succeed if these channels are wide open in a diverse ecosystem of capital providers. Both issues and payouts compete with alternative uses of corporate cash, such as investments and building cash reserves.
In perfect markets, issues and payouts have no value relevance: the change in cash exactly equals the change in the financiers’ claims. However, in practice they may become value relevant due to imperfections such as taxes, information asymmetries, financial distress, and bankruptcy costs.
The impact of E and S on financial issues and payouts is most obvious through their impact on business models and operations, which in turn affect risk, debt capacity, and cash flows, thereby affecting the degree to which companies can and want to payout cash or issue new capital.
As to the issues and payouts of E and S, the question is if they exist at all. After all, issues and payouts concern changes in claims that involve cash transfers, but it is not clear what the equivalent of cash could be in E and S.
Even if issues and payouts in E and S do not exist, that does not need to stop us from having an integrated view on issues and payouts. We develop an integrated payout ratio, which calculates payouts as percentage of integrated value flows. The question then is: how to manage issues and payouts, financial in nature, when managing for long-term value? At the very least, it calls for caution on payouts in the presence of significant liabilities on E or S. An integrated payout ratio over 100% suggests that payouts to financial stakeholders take place at the expense of social and environmental stakeholders.
Key Concepts Used in This Chapter
Adjusted present value (APV) goes beyond the NPV by considering the funding costs of a transaction
Catering means choosing a dividend policy with the purpose of responding (catering) to investors’ psychological or tax needs
Dividends are cash payments to shareholders
Dividend capture theory means that in the absence of transaction costs, investors can trade shares at the time of the dividend so that non-taxed investors receive the dividend
Dividend signalling hypothesis refers to the idea that dividend changes reflect managers’ views about the company’s future earnings prospects
Dividend yield is dividends as a percentage of equity value
Hedonic editing means that people prefer to experience gains separately rather than together
Integrated payout ratio is payouts (in the form of dividends and/or share buybacks) divided by net integrated income (which combines net social and environmental value flows and net financial income)
IPO is an Initial Public Offering, the first public equity issue of a company
Open market share repurchases mean that a company buys back shares in the market
Payout ratio is payouts (in the form of dividends and/or share buybacks) divided by net income
Rights issue is an invitation to (or ‘right’ for) existing shareholders to purchase additional new shares in the company
SEO is a Seasoned Equity Offering, a public equity issue of a company that is already stock listed
Share buyback (or share repurchase) refers to a company that pays out cash to its shareholders by buying back shares; there are two ways to do buybacks: open market share repurchases; and tender offers
Share repurchase see share buyback
Special dividend is a one-off dividend payment that is not part of a company’s dividend policy of recurring dividends
Stock split is a corporate action in which a company increases the number of its outstanding shares by issuing more shares to current shareholders by the specified ratio (e.g. 15 to 1 split means that each shareholder receives 14 additional shares for each share)
Syndicate is a group of investment banks acting as underwriters or bookrunners of an issue
Tax clientèle effects refer to optimising dividend policy for the tax preference of its investor clientèle
Tender offer refers to a corporate action in which shareholders receive an offer that asks them to submit (tender) a portion of their shares within a certain time frame
Underwriting is the process where an investment bank raises capital for a company from investors in the form of equity or debt securities
Open Access This chapter is licensed under the terms of the Creative Commons Attribution 4.0 International License (http://creativecommons.org/licenses/by/4.0/), which permits use, sharing, adaptation, distribution and reproduction in any medium or format, as long as you give appropriate credit to the original author(s) and the source, provide a link to the Creative Commons license and indicate if changes were made.
The images or other third party material in this chapter are included in the chapter's Creative Commons license, unless indicated otherwise in a credit line to the material. If material is not included in the chapter's Creative Commons license and your intended use is not permitted by statutory regulation or exceeds the permitted use, you will need to obtain permission directly from the copyright holder.