To support countries implementing CSA solutions, the Economics and Policy Innovations for Climate Smart Agriculture (EPIC) group at FAO uses a methodology based on building a solid evidence base. The knowledge gained from datasets that combine household, geographical and climate data helps design policies that enhance food security and climate resilience while also taking advantage of mitigation opportunities to obtain financing. Appropriate application of CSA principles depends on specific conditions that vary between and within countries. Demographic, environmental, economic and institutional factors are all important determinants of the effectiveness of any particular policy. This chapter builds upon econometric results obtained from previous analyses by developing a conceptual model that introduces the temporal aspects of household vulnerability. The method is based on a factorial design with two vulnerability levels (high and low) and two production methods (conventional or business as usual, and improved agricultural management with high CSA potential). Farms are classified into groups based on cluster analysis of survey data from Zambia. Results provide a baseline consisting of probability distributions of yields, labor use, cash inputs and profit for each of the four combinations of vulnerability level and production system. This is useful for stochastic dominance analysis, but additional work is required to incorporate the temporal aspect of the problem. The chapter identifies data gaps and additional analyses required to capture the spatio-temporal aspects of household vulnerability and adaptive capacity.
1 Introduction
In its most general definition, resilience is the ability of a system to react or cope with change. More specifically, the concept refers to the ability of a system to respond to shocks (temporary) or more persistent adverse trends (stressors) (Hoddinott 2014). In the context of food security, resilience means being able to achieve or maintain food security in spite of shocks or permanent stressors. This implies reducing the risk of becoming food insecure, increasing adaptive capacity to cope with risks and effectively respond to change over time.1
From the standpoint of CSA, of which food security is one key pillar, the importance of understanding resilience arises from the need to address the vulnerability of farm households to climate change, which is determined by a combination of adaptive capacity and exposure to shocks and slower changes (Adger et al. 2004; IPCC 2007a; OECD 2009; IPCC 2014).
Anzeige
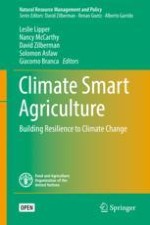
A conceptual framework for thinking about resilience is illustrated in Fig. 1. Adaptive capacity is affected by both the internal state of the farm household (education, age, farm area, assets owned, land productivity) and the external state experienced at the local level (technologies available, institutions, policies, infrastructure, markets).
Fig. 1
Conceptual model illustrating the key relationships of concern in this study
×
This is a dynamic system where the internal state changes over time depending on the outcomes of household decisions such as the crop mix, input use, production methods and off-farm activities. The outcomes are affected by climate (through yields) and markets (through prices) which are out of the control of the household. For example, a good season combined with strong markets helps build financial capital reducing vulnerability, whereas a string of poor seasons may result in loss of financial or human capital (by the selling of assets or migration of family members to the city), increasing vulnerability of the household.
Both the internal and external states can change over time depending on policies, for example education and extension improve the internal state (human capital), whereas R&D and transport infrastructure improve the external state by providing new technologies and improving access to markets. Climate change affects the internal state indirectly by changing the yield probability distributions, for example due to increasing frequency of dry spells, floods and storms. It can also affect the external state, as in the case of severe storms destroying transport and communication infrastructure.
Individual households make decisions based on the options available to them (Fig. 1), and their actions result in outcomes (i.e. profits) whose probability distribution is determined by both the internal and external state as well as by the changing climate. These influences are represented as dotted lines in Fig. 1. The dynamic aspect of the problem is represented by the solid arrow between outcomes and the internal state. The outcomes at the end of each growing season will determine whether the household is able to improve its state (i.e. build human and natural capital), thus enhancing its resilience.
Anzeige
The empirical implementation of the model illustrated in Fig. 1 requires a number of relationships to be known for the particular situation of interest. The options available to households depend not only on the technologies that are suitable for the area, but also on their ability to access these technologies through knowledge and investment capital. This suggests that understanding constraints at the household level is a key to assessing vulnerability. A behavioral model is required to understand the decisions taken by households given the constraints they face. The standard approach is to assume utility maximization, where utility is a function of expected profits and risk (Moschini and Hennessy 2001).
The propensity of households to adopt given technology packages, and the probability distributions of outcomes, can be inferred empirically from existing data. Estimating the effects of climate shocks on the shape of these distributions is more difficult as it would require panel data for a number of years involving a range of different climatic conditions. In the absence of these, it may be possible to infer changes in outcome distributions using crop simulation models.
Many CSA practices can increase food production and the adaptive capacity of the food production system, while at the same time reducing net greenhouse gas emissions by capturing carbon in biomass and soils. However, capturing these long-term synergies may entail significant costs in the short term, and other barriers to adoption of CSA may be present, particularly for smallholders (McCarthy et al. 2011).
According to FAO (2011) the pillars of adaptation in agriculture are soil health, water conservation, diversification and local institutions. The Economics and Policy Innovations for Climate Smart Agriculture (EPIC) programe at FAO has been addressing these issues for a number of years, formally grounded on a substantial evidence base that continues to grow (Arslan et al. 2014, 2015; Asfaw et al. 2014). In this study we focus on the first two factors: soil health and water conservation, both of which are related to farming methods involving minimum soil disturbance (MSD). MSD, while contributing to soil health, increases water retention and moisture and is considered as one of the practices with potential to contribute to the CSA pillars. This chapter contributes towards building up an empirical model for the conceptual framework illustrated in Fig. 1 as a useful tool for policy analysis. This paper forms a base from which the temporal aspects of the problem can be addressed through simulation of climate scenarios in future research.
2 Data and Methods
The data used in this analysis come from a household survey conducted by EPIC in 2013 to support a detailed cost benefit analysis of crop practices in Zambia, with the purpose of comparing agricultural practices with CSA potential to conventional ones (see Branca et al. 2015). Given the low adoption rate of agricultural practices with CSA potential encountered in the country (Arslan et al. 2014), the need for an ad hoc study emerged to understand the performance of households who adopt the recommended practices as well as related costs and benefits.
The first step required identifying a sample that allowed such comparison, starting with defining what was “conventional” for Zambia as opposed to “alternative practices,” whose CSA potential had to be assessed. Initial screening of the farming practices in use in the country was conducted through literature review, key informant interviews and qualitative analysis. The screening allowed identification of the most common farming practices defined as “conventional”. Conventional practices were then contrasted with the “alternative practices” identified by compiling a list of various farming practices in different combinations with sustainable land management as a common factor (see Branca et al. 2015).
Households were randomly selected from the population of adopters of “alternative practices”, maintaining representativeness of agro-ecologies in different districts, provinces and camps. Households were selected so as to cover enough agricultural camps with adopters of improved practices in a diversity of agro-ecological regions while also ensuring a balanced presence of non-adopters. The final sample included 695 rural households randomly selected within the population of adopters and non-adopters in eight districts of two agro-ecological regions (AER IIa and AER III, see Fig. 2).2 The data collected include detailed information on household structural characteristics, farming practices adopted, quantities and costs of all inputs (including hired or family labor), yields and marketed returns, and input and output farm-gate prices. This information provides a baseline to study the adaptive capacity of different types of households based on a factorial design whereby we compare two vulnerability levels (high and low) and two production methods (conventional and MSD). Farms are classified into groups based on cluster analysis as described later.
Fig. 2
Map of study area and sample points (Source: Branca et al. 2015)
×
The data suggest that a wide range of combinations of practices are being used by farm households in Zambia, and these have been grouped into two main categories based on the tillage method applied: (1) farmers that use conventional (CONV) tillage techniques (including oxen ploughing and hand hoe ploughing, ridging and bunding) as opposed to (2) farmers that adopt sustainable land management practices based on the principle of MSD and water conservation (including planting basins and potholes and ripping with oxen/tractor). Later in the analysis MSD is further split according to its emphasis on labor or capital inputs.
Previous work has shown that MSD generates higher average benefits in drier areas (Branca et al. 2013) and that adoption rates are higher in these areas, especially under high rainfall variability, both of which are conditions that characterize AER I, IIa and IIb in Zambia (Arslan et al. 2014). However, it should be noted that various SLM practices (including MSD, crop rotations with legumes, residue retention and agroforestry) have been primarily promoted in AER IIa, likely due to its proximity to the railway line and to Lusaka and other urban centers. Region IIa has received more assistance from government, NGOs and donor organizations, and is the geographic focus of outgrower schemes and conservation farming. This is also reflected in our sample as MSD fields are found only in AER IIa, which runs east-west through the center of the country on the plateau of the Central, Lusaka, and Eastern Provinces and parts of Western and Southern Provinces. The region is sometimes referred to as Zambia’s maize belt, as almost half of all maize produced in the country is grown in twelve of its districts (MAL 2007). AER IIa is also recognized as a vulnerable area. About 41% of Zambian farm households live in this region and are mostly engaged in crop production.3 The area is characterized by a semi-arid climate, where maize yields are projected to decrease significantly as a result of increased frequency of droughts and hot days and nights based on country-specific climate change models (Kanyanga et al. 2013).
Given the sampling frame of the data and evidence of expected benefits of the practices analyzed here under climate change,4 we focus our analysis only on AER IIa. Moreover, given the key importance of maize for food and nutrition security in the country (MAL 2007), we restrict our sample to maize producers, resulting in a subset of 487 households.
The heterogeneity of the farm populations means that vulnerability is expected to differ significantly between households. To capture vulnerability differences that are relevant to policy choices, it is convenient to identify segments of the household population with common attributes, and to conduct analysis for these farmer groups. Cluster analysis provides a method to identify the appropriate number and description of farmer typologies (Acosta-Michlik and Espaldon 2008).
We conduct our analysis for two types of smallholder households that were clearly identified based on cluster analysis: (i) smaller farms with few assets (hypothesized to be more vulnerable), and (ii) larger farms with more assets (hypothesized to be less vulnerable). We first conduct analyses of means to detect differences between the probability distributions of the production methods (CONV and MSD) between these two farm types. Variables analyzed include maize yields, labor use, fertilizer use, cash inputs, profits and returns to labor.
Given the baselines obtained from the analysis of household types (low and high vulnerability) and production systems (CONV and MSD) it was clear that there are two distinct types of MSD applications in the sample: one that relies mostly on labor (using hand hoes to dig planting basins/potholes) and another that uses capital (oxen or machinery) for ripping. We denote these groups as MSD-L and MSD-K, respectively. This classification conforms with reports in the literature that find labor requirements for planting basins as one of the main constraints for the adoption of this practice in the region (Baudron et al. 2007; Mazvimavi 2011; Ngoma et al. 2014).5 No distinction regarding emphasis on capital or labor was identified in the case of CONV, which consisted of a relatively small sample.
The analysis concludes by comparing the full probability distributions of key variables between farm clusters and production methods. The key variables are compared in terms of stochastic dominance to determine whether any one practice would be preferred to others independently of the risk aversion level of the decision maker. The chapter concludes by identifying the additional information and analyses that would be required to implement an analytical model such as illustrated in Fig. 1.
3 Results and Discussion
Descriptive analysis
Analysis of unconditional means (Table 1) provides evidence that farms using MSD have significantly higher average yields than farms using conventional till (CONV) in the study area (2101 vs 1675 kg/ha). However, this is accompanied by higher labor requirements (108 vs 80 days/ha) and cash inputs (274 vs 207 $/ha). The amount of fertilizer used by farmers practicing MSD tended to be higher (211 vs 180 kg/ha) but not significantly (p = 0.12).
Table 1
Tests of differences in means of key variables between farms using conventional till (CONV) and those using sustainable land management (MSD)
Variable
CONV
MSD
Total
p(|T| > |t|)
Number of farms
84
370
454
Maize yield**
Mean
1674.52
2101.47
2022.47
(kg/ha)
SE
170.49
82.34
74.47
0.03
Labor**
Mean
80.49
107.97
102.88
(pd/ha)
SE
8.41
5.46
4.74
0.01
Fertilizer
Mean
179.81
211.33
205.50
(kg/ha)
SE
17.39
8.79
7.86
0.11
Cash inputs***
Mean
206.85
273.57
261.22
($/ha)
SE
15.53
9.47
8.32
0.00
Gross margin
Mean
139.12
160.49
156.53
($/ha)
SE
32.22
14.88
13.50
0.54
Profit
Mean
58.54
49.67
51.31
($/ha)
SE
32.86
15.10
13.71
0.80
Labor productivity*
Mean
71.63
40.64
46.37
(kg maize/pd)
SE
34.19
3.34
6.88
0.08
Return to labor*
Mean
6.64
2.99
3.67
($/pd)
SE
4.23
0.48
0.87
0.10
Means are significantly different at p<0.1 (*); p<0.05 (**); or p<0.01(***)
The combination of higher yields and higher input use still results in higher average gross margins under MSD ($160/ha) than under conventional till ($139/ha), but this difference is not statistically significant (Table 1). When the imputed cost of family labor is included in the calculation, profits are quite similar (50 vs 58 $/ha for MSD against CONV) (see also Branca et al. 2015). Return to labor is significantly lower for MSD than for CONV (2.99 vs 6.64 $/pd), corresponding to lower labor productivity (40.6 vs 71.6 kg maize/pd).
Using nationally representative data from 2004 to 2008, Arslan et al. (2014) found that the adoption rate of MSD was quite low, and that it had decreased significantly between the two years. The only province with increased adoption levels was the Eastern province, which is mostly in AER IIa with a high density of projects promoting conservation farming, of which MSD is the main component. Possible reasons for low adoption in general include that farmers face labor and capital constraints, or that they do not perceive MSD to be more profitable than using tillage – at least in the short run during which there may be no significant yield difference until the soil quality is improved, which requires 3–5 years of repeated MSD practice (McCarthy et al. 2011). Although average gross margins and average profits were positive for both systems, they were quite low (Table 1), and a high proportion of farms experienced negative profits, suggesting that the opportunity cost of their labor is lower than the wage rate used in the calculations,6 perhaps because there are no alternative employment opportunities.
Cluster analysis
Cluster analysis revealed two distinct groups of farms as described above and illustrated in the dendogram in Fig. 3, consisting of 55 and 45 percent of the sample. There are clear differences in the mean values of variables used to form the clusters (Table 2). Although all the farms in the sample are smallholders, Cluster 1 has larger farms than Cluster 2 (with means of 4.02 ha vs 2.21 ha). Farmers in Cluster 1 tend to be better educated, have more livestock, more wealth and larger households. The difference in wealth is especially obvious, with an average wealth index7 of 0.64 for Cluster 1 compared to −0.47 for Cluster 2. All household heads are male in Cluster 1, whereas 30 percent of them are female in Cluster 2. These results suggest that farms in Cluster 2 are potentially more vulnerable to shocks, as they have fewer assets to draw from in emergencies (particularly livestock) and have less wealth. This means they are likely to be less resilient than farms in Cluster 1.
Fig. 3
Dendogram of cluster analysis
Table 2
Mean values and standard errors (SE) of variables used in cluster analysis and results of t test of differences between means
Cluster 1
Cluster 2
Total
p(|T| > |t|)
Number of farms
251
203
454
Female head***
Mean
0.00
0.30
0.13
SE
0.00
0.03
0.02
0.00
Age of head
Mean
45.71
46.00
45.84
SE
0.78
0.91
0.59
0.81
Average education*
Mean
7.27
6.91
7.11
SE
0.11
0.16
0.10
0.06
Adults per ha***
Mean
1.55
2.18
1.83
SE
0.08
0.12
0.07
0.00
Dependency ratio
Mean
1.25
1.23
1.24
SE
0.06
0.07
0.04
0.81
Household size***
Mean
8.38
6.57
7.57
SE
0.20
0.17
0.14
0.00
Farm size***
Mean
4.02
2.21
3.21
SE
0.20
0.11
0.13
0.00
Cattle***
Mean
9.56
0.62
5.56
SE
0.87
0.18
0.53
0.00
Goats and sheep***
Mean
9.90
3.79
7.17
SE
1.37
0.60
0.82
0.00
Wealth index***
Mean
0.64
−0.47
0.15
SE
0.07
0.03
0.05
0.00
Means are significantly different at p<0.1 (*); p<0.05 (**); or p<0.01(***)
×
Table 3 shows that, on average, Cluster 1 farms have higher maize yields (2172 kg/ha vs 1838 kg/ha) and higher profits (85.69 vs 8.80 $/ha) than Cluster 2 farms. In contrast, Cluster 2 farms use more labor (124 vs 86 pd/ha on average) and less cash inputs (241 vs 277 $/ha), reflecting the presence of cash constraints. This becomes more evident in the distribution analyses presented later. The large difference in profits between clusters (Table 3) reflects the higher reliance on labor experienced by Cluster 2, which combined with lower labor productivity (28.7 vs 60.7 kg maize/pd) results in lower returns to labor (2.18 vs 4.87 $/pd).
Table 3
Means of selected variables related to maize production and t test of differences between clusters
Variable
Cluster 1
Cluster 2
Total
p(|T| > |t|)
Practicing MSD
Mean
0.81
0.82
0.81
SE
0.02
0.03
0.02
0.71
Maize yield**
Mean
2171.87
1837.75
2022.47
(kg/ha)
SE
105.67
102.10
74.47
0.03
Labor***
Mean
85.63
124.21
102.88
(pd/ha)
SE
5.34
8.05
4.74
0.00
Fertilizer
Mean
215.43
193.22
205.50
(kg/ha)
SE
10.04
12.43
7.86
0.16
Cash inputs**
Mean
277.25
241.41
261.22
($/ha)
SE
10.35
13.40
8.32
0.03
Gross margin
Mean
171.84
137.61
156.53
($/ha)
SE
19.73
17.76
13.50
0.21
Profit ***
Mean
85.69
8.80
51.31
($/ha)
SE
19.80
18.09
13.71
0.01
Labor productivity **
Mean
60.69
28.68
46.37
(kg maize/pd)
SE
11.95
4.02
6.88
0.02
Return to labor
Mean
4.87
2.18
3.67
($/pd)
SE
1.48
0.66
0.87
0.13
Means are significantly different at p<0.1 (*); p<0.05 (**); or p<0.01(***)
Tests of differences between CONV and MSD within each cluster (Table 4) indicate that the patterns observed above for the pooled data are also present within each of the two clusters: MSD produces higher yields on average, but it requires more labor and cash inputs. As a result, MSD has lower returns to labor, with the lowest return ($2.15/pd) experienced by Cluster 2 farms.
Table 4
Tests of differences in means of key variables between farms using conventional till (CONV) and those using sustainable land management (MSD)
Variable
Cluster 1
Cluster 2
Prob > F
CONV
MSD
CONV
MSD
Cluster
Method
Interaction
N
48
203
36
167
Maize yield
1925.74
2230.07
1339.55
1945.15
**
**
(kg/ha)
227.07
110.42
262.20
121.74
0.02
0.02
0.43
Labor
78.77
87.25
82.78
133.15
**
***
*
(pd/ha)
14.22
6.92
16.42
7.63
0.04
0.01
0.08
Fertilizer
214.54
215.64
133.50
206.10
**
*
*
(kg/ha)
24.06
11.70
27.78
12.90
0.03
0.07
0.08
Cash inputs
244.03
285.11
157.28
259.54
***
***
($/ha)
25.19
12.25
29.09
13.50
0.01
0.00
0.15
Gross margin
152.90
176.32
120.74
141.24
($/ha)
41.56
20.21
47.99
22.28
0.34
0.53
0.97
Profit
73.99
88.46
37.96
2.51
*
($/ha)
41.93
20.39
48.41
22.48
0.09
0.77
0.48
Labor productivity
101.61
51.01
31.66
28.04
***
($/pd)
21.00
10.21
24.25
11.26
0.01
0.13
0.19
Return to labor
9.87
3.68
2.34
2.15
**
(kg maize/pd)
2.67
1.30
3.09
1.43
0.05
0.16
0.18
Means are significantly different at p<0.1 (*); p<0.05 (**); or p<0.01(***)
It is difficult to draw general conclusions from the analysis of differences between means presented in Table 4. In some cases there are significant differences between clusters or between production methods, but these differences are not always consistent. This suggests that further partitioning of MSD is required as explained in the Methods section. The remaining analyses distinguish between MSD-L and MSD-K to indicate emphasis on the use of labor or capital respectively.
Table 5 presents average values for the variables of interest, partitioning the data by cluster and by production system. These results show the logic behind distinguishing between MSD practices based on their labor intensity. The average labor required by MSD-L (140 and 174 pd./ha for clusters 1 and 2 respectively) is considerably higher than that required by MSD-K (76 and 99 pd./ha). In fact, the labor used in MSD-K is comparable to that of CONV in both clusters (79 and 83 pd./ha). This indicates the extent to which the availability of capital (oxen in this case) helps overcome labor constraints of adopting MSD. As before, return to labor tends to be higher for CONV than for MSD (Table 5), with the exception of MSD-K in Cluster 2, which is higher than for CONV (2.63 vs 2.34 $/pd).
Table 5
Mean values of key variables related to maize production by cluster x production system
Cluster 1
Cluster 2
CONV
MSD-L
MSD-K
CONV
MSD-L
MSD-K
N
48
35
168
36
77
90
Maize yield
1926
2188
2239
1340
2097
1815
Labor
79
140
76
83
174
99
Fertilizer
215
197
220
133
187
222
Cash inputs
244
250
292
157
233
282
Gross margin
153
204
171
121
194
96
Profit
74
64
94
38
17
−10
Labor productivity
102
32
55
32
19
36
Return to labor
9.87
3.28
3.76
2.34
1.59
2.63
Figure 4 presents cumulative distribution functions (CDF) for yields, labor and fertilizer use. The left sections of the yield distributions for MSD are to the right of those for CONV in both clusters (Fig. 4a, b), except for the lowest-yielding farms under MSD-K in Cluster 1. The higher labor requirements of MSD identified above in terms of means are also evident when looking at the full distributions (Fig. 4c, d). These differences apply for MSD-L but not for MSD-K, which has similar distributions to CONV in both clusters.
Fig. 4
Kernel density estimates of cumulative distribution functions for maize yields (a, b), labor use (c, d) and fertilizer use (e, f) for farmers in clusters 1 or 2 and using conventional tillage (CONV) or minimum soil disturbance (MSD-L, MSD-K)
×
It is interesting to note that the distributions of fertilizer use are very similar in Cluster 1 across all three production systems (Fig. 4e), but in the case of Cluster 2 the distributions for MSD are to the right of those for CONV (Fig. 4f). This is a clear indication of the constraints faced by farmers in this cluster. Many of these farmers can only afford to apply fertilizer when they participate in MSD promotion programs that provide fertilizer as part of an MSD package described in this paper.
Figure 5 presents cumulative distribution functions for cash inputs, gross margins and profits. It is clear that MSD requires more cash inputs than CONV, and the differences are larger in Cluster 2 (Fig. 5b) than in Cluster 1 (Fig. 5a), once again suggesting the constraints faced by small farmers in adopting MSD. Regarding gross margins, both MSD options dominate CONV in terms of second degree stochastic dominance in the case of Cluster 1, (Fig. 5c).8 This dominance disappears when expressed in terms of profit (Fig. 5e), which considers the cash value of family labor. In contrast, there is no clear dominance relationship in Cluster 2 in terms of either gross margins (Fig. 5d) or profits (Fig. 5f).
Fig. 5
Kernel density estimates of cumulative distribution functions of cash inputs (a, b) gross margins (c, d) and profits (e, f) for farmers in clusters 1 or 2 and using conventional tillage (CONV) or minimum soil disturbance (MSD-L, MSD-K)
×
In general, about one-third of farms experienced a loss in terms of gross margins (Table 6), except for the case of MSD-L in Cluster 2, where only about one-fifth of farms experienced a loss. This is an interesting finding that shows that poor farms use family labor to cope with risk.
Table 6
Probability of losses in terms of gross margins and profits by cluster and production method
Cluster 1
Cluster 2
CONV
MSD-L
MSD -K
CONV
MSD -L
MSD -K
N
50
181
52
93
96
37
P(GM < 0)
0.32
0.26
0.32
0.30
0.20
0.37
P(PROFIT < 0)
0.43
0.43
0.44
0.47
0.50
0.60
P(GM < $50)
0.41
0.32
0.40
0.42
0.29
0.49
P(PROFIT < $50)
0.54
0.50
0.52
0.58
0.58
0.69
In both clusters, when the high labor requirements of MSD-L are priced at market rates to calculate profits, there is no clear preference relative to CONV on stochastic dominance grounds.
4 Implications and Further Work
From a policy standpoint the main issue arising from this analysis is that small, vulnerable farms are more likely to face labor and cash constraints, which may prevent them from adopting technologies that have the potential to sustainably improve food security and enhance their adaptive capacity, i.e. be climate-smart. Widespread adoption, however, will require policies that address the barriers identified here to provide: (i) improved techniques that are less labor intensive, (ii) improved availability of fertilizers, and (iii) credit to cover the up-front costs of investing in soil health that takes several years to bear fruit.
Some agronomists argue that switching from ‘conventional’ to MSD technologies increases crop yields after a few years of declining or stable yields (e.g. see Erenstein et al. 2008). Also farmers may need a few years of experience to acquire the additional knowledge and management skills necessary for more diversified operations. Most farmers adopt alternatives gradually. In the sample, an average number of 3–4 years of adoption is recorded, which is generally considered not enough for ‘conservative’ practices to generate the full expected benefits (Erenstein et al. 2008). Unfortunately not enough observations were available to for a disaggregated analysis by categories of number of years since adoption (e.g. up to 2 years and above 3 years).
The outcome distribution in Fig. 1 can be replaced with actual profit distributions such as Fig. 5e, f, using a different distribution for each combination of vulnerability (high or low) and production method (CONV, MSD-L or MSD-K). These distributions provide a baseline from which the dynamic aspects of the problem may be addressed.
The analyses presented in this chapter provide baselines to identify the most vulnerable farm households based on the whole distribution of the farm households in the sample. The potential contribution of MSD practices to enhanced resilience of households faced with climate change is better understood by focusing on particular segments of the farm population: the most vulnerable households. The distributions of yields and profits illustrated in this paper would shift in response to changes in climate, and the nature of these shifts may differ between CONV and MSD. The hypothesis is that more vulnerable households (Cluster 2) will have lower average yields under uncertain weather events than less vulnerable households (Cluster 1), and that MSD will lessen this negative effect during dry spells.
The expectation that MSD will show its true worth in dry years could not be tested because that source of variation is not included in the data. Studies of adaptation to climate change in Sub-Saharan Africa have found that smallholders are already using a range of strategies to deal with climate variability (Skjeflo 2013), many of them related to sustainable land management. However, evidence also shows that the key variables explaining adoption of these practices are availability of financing and risk management instruments, availability of technical information to enable the adoption process, collective action at the local level, and tenure security (McCarthy et al. 2011). Some of these constraints have been considered in this chapter by focusing on the most vulnerable households, but additional work is needed to estimate changes in the probability distributions of yields and profits caused by alternative policies in the presence of climate change.
The probability distributions derived in this study are useful for stochastic-dominance analysis but they tell only part of the story. The data are for a single cropping season and so do not cover variations in time. To get the full picture we need data on a variety of climate years, including dry and wet years. This can be obtained from panel data or from simulations using crop and livestock production models. These data are required to implement the conceptual model (Fig. 1) proposed in this chapter. Resilience is a dynamic concept implying adjustment through time as climatic, economic and social conditions change. Future empirical work on this topic should focus on introducing alternative climate scenarios and undertaking dynamic analysis by combining econometric results and crop simulation models.
Open Access This chapter is distributed under the terms of the Creative Commons Attribution-NonCommercial-ShareAlike 3.0 IGO license (https://creativecommons.org/licenses/by-nc-sa/3.0/igo/), which permits any noncommercial use, duplication, adaptation, distribution, and reproduction in any medium or format, as long as you give appropriate credit to the Food and Agriculture Organization of the United Nations (FAO), provide a link to the Creative Commons license and indicate if changes were made. If you remix, transform, or build upon this book or a part thereof, you must distribute your contributions under the same license as the original. Any dispute related to the use of the works of the FAO that cannot be settled amicably shall be submitted to arbitration pursuant to the UNCITRAL rules. The use of the FAO’s name for any purpose other than for attribution, and the use of the FAO’s logo, shall be subject to a separate written license agreement between the FAO and the user and is not authorized as part of this CC-IGO license. Note that the link provided above includes additional terms and conditions of the license.
The images or other third party material in this chapter are included in the chapter’s Creative Commons license, unless indicated otherwise in a credit line to the material. If material is not included in the chapter’s Creative Commons license and your intended use is not permitted by statutory regulation or exceeds the permitted use, you will need to obtain permission directly from the copyright holder.
The statistical surveys conducted by the Ministry of Agriculture and Livestock in collaboration with the Central Statistical Office in 2002/03 show that more than 97% of households residing in AER IIa are engaged in crop production activities.
MSD is effective in keeping soil moisture, therefore it can be expected to be adopted more widely in dry areas that are projected to get even drier – as reported in Arslan et al. (2014).
MSD primarily based on planting basins is the integral part of the Conservation Farming packages that have been heavily promoted in Zambia since 1990’s. In recent years there is a shift towards promoting CF based on ripping, which require less labor compared to planting basins.
Labor costs were estimated at the prevailing wage rate in the rural labor market in the study area using rates that differ by farm activity type collected through a Community level questionnaire.
The wealth index is constructed using principal component analysis. It includes the following variables representing key assets owned by the household: number of ploughs, number of harrows, number of cultivators, number of rippers, number of tractors, number of cars, number of bikes.
Second degree stochastic dominance occurs when the area under the CDF for MSD is ≥ than the area under the CDF for CONV throughout the distribution (Anderson et al. 1977).