2000 | Buch

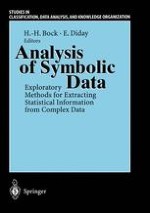
Analysis of Symbolic Data

Exploratory Methods for Extracting Statistical Information from Complex Data

herausgegeben von: Prof. Dr. Hans-Hermann Bock, Prof. Edwin Diday

Verlag: Springer Berlin Heidelberg

Buchreihe : Studies in Classification, Data Analysis, and Knowledge Organization

insite
SUCHEN

Über dieses Buch

Raymond Bisdorff CRP-GL, Luxembourg The development of the SODAS software based on symbolic data analysis was extensively described in the previous chapters of this book. It was accompanied by a series of benchmark activities involving some official statistical institutes throughout Europe. Partners in these benchmark activities were the National Statistical Institute (INE) of Portugal, the Instituto Vasco de Estadistica Euskal (EUSTAT) from Spain, the Office For National Statistics (ONS) from the United Kingdom, the Inspection Generale de la Securite Sociale (IGSS) from Luxembourg 1 and marginally the University of Athens . The principal goal of these benchmark activities was to demonstrate the usefulness of symbolic data analysis for practical statistical exploitation and analysis of official statistical data. This chapter aims to report briefly on these activities by presenting some signifi­ cant insights into practical results obtained by the benchmark partners in using the SODAS software package as described in chapter 14 below.
Inhaltsverzeichnis

Frontmatter
1. Symbolic Data Analysis and the SODAS Project: Purpose, History, Perspective
Abstract
In many domains of human activities it is now quite common to record huge sets of data in large data bases. It becomes a task of first importance to summarize these data in terms of their underlying concepts in order to extract new knowledge from them. These concepts can only be described by more complex type of data which we call symbolic data as they contain internal variation and they are structured. In this context, we have a rapidly increasing need to extend standard data analysis methods (exploratory, graphical representations, clustering, factorial analysis, discrimination,…) to these symbolic data.
Edwin Diday
2. The Classical Data Situation
Abstract
The classical methods of statistical data analysis were designed for a relatively simple situation. First, the data were obtained for single individuals (persons, objects, products,…) which were the basic entities of the data gathering process by using interviews, experiments, archives, etc. Second, the recorded data concerned a list of one or several well defined variables and, third, these variables were single-valued insofar as the observation of each variable for a given individual resulted in just one single ‘value’ or ‘category’ such as in the statements: ‘the height of a person is 170 cm’, ‘the colour of a car is red’ etc. Depending on the situation, these variables were classified into quantitative (continuous or discrete) and qualitative (ordinal or nominal) ones.
Hans-Hermann Bock
3. Symbolic Data
Abstract
In Chapter 2, we have described the classical data analysis paradigm: a rectangular data matrix \(\underset{\raise0.3em\hbox{$\smash{\scriptscriptstyle\thicksim}$}}{X} = {\left( {{x_{kj}}} \right)_{n \times p}}\) defines the relation between the set Ω = {1,…, n}of n individuals or elementary objects and a series of variables Y1,…, Yp, where each variable Y j assumes one single category from a range y j such that each cell (k,j) of the data matrix \(\underset{\raise0.3em\hbox{$\smash{\scriptscriptstyle\thicksim}$}}{X}\) contains one single value xkj only.
Hans-Hermann Bock
4. Symbolic Objects
Abstract
In the previous Chapter, we have presented various types of symbolic data. We recall that these data types are generalizations of classical data types in the following respects:
  • The set E of ‘objects’ or ‘elements’ for which the variables are defined is not necessarily a universe Ω of individuals,but may also be a system {C1,…, C m } of classes of individuals;
  • The properties of each object u of E are described by symbolic variables Y1, …, Y p which are typically: multi-valued, interval-type or modal (probabilistic) variables.
Hans-Hermann Bock, Edwin Diday
5. Generation of Symbolic Objects from Relational Databases
Abstract
In former chapters, we have defined the concept of a ‘symbolic object’ in a formal way (with various levels of generality) and illustrated these definitions and the related terminology by many examples. Thereby we have emphasized the two-level-paradigm where symbolic objects were created quite naturally when aggregating single individuals (described by classical single-valued variables) into classes, and describing the more or less complex properties of these classes. Here, we focus on the generalization process from a classical dataset extracted from a relational database. We also define a specialization step which aims at reducing over-generalization. Finally, we present how to build a symbolic dataset from several datasets by applying a join operator.
Véronique Stéphan, Georges Hébrail, Yves Lechevallier
6. Descriptive Statistics for Symbolic Data
Abstract
The intention of this chapter is to extend the concept of frequency distribution, and the standard definitions of descriptive statistics for real-valued data, such as the empirical mean the empirical standard deviation and the median, to the general framework of symbolic variables. We denote by E={1,…, n} the set of units that are described by p symbolic variables Y1,…, Yp. The domain of each variable Y j for j = 1,…, p, is denoted by Y j and S = × j=1 p y j denotes the whole domain space. We will examine different types of symbolic variables, namely:
  • cases where each symbolic variable Y j is multi-valu ed or interval-valued;
  • including the case wher e logical rules may exist among the values taken by Y1,…, Y p
Patrice Bertrand, Françoise Goupil
7. Visualizing and Editing Symbolic Objects
Abstract
In this chapter, we propose a means to visualize symbolic objects (SO’s). Graphical representations are a well-known solution for identifying relevant information in large and complex information spaces. Symbolic objects are a new type of statistical data that are characterized by their complexity. Therefore, it was necessary to design a corresponding graphical representation that allows all the necessary information to be concisely visualised without overloading the graphic. After a short review of the literature relating to this domain, we shall describe our graphical solution, which we have named Zoom Star (Noirhomme 1997a,b). It provides different levels of detail according to the user’s needs. Afterwards, we shall show, by means of examples, how the graphical representation can be used in practice.
Monique Noirhomme-Fraiture, Manuel Rouard
8. Similarity and Dissimilarity
Abstract
Several classical or symbolic data analysis techniques start from the assumption that there are some means for assessing and quantifying the similarities (or dissimilarities) which may exist between the underlying objects (individuals, classes, symbolic objects, etc.), by a recourse to the observed data matrix. They use these similarities as their data input. For example, in cluster analysis where we look for ‘homogeneous’ classes C1, C2,… of objects, it is typically required that pairs of objects from the saine class have a large similarity (i.e., a small dissimilarity) and, conversely, that the similarity is small for pairs of objects fromdifferent classes (see Section 11.1).
F. Esposito, D. Malerba, V. Tamma, H. H. Bock
9. Symbolic Factor Analysis
Abstract
In the present chapter we propose an extension of the standard principal component analysis method which takes as input a symbolic data matrix \(\underline X = ({\xi _{ij}})\) of interval type (Chouakria 1994, 1995, Cazes 1997; see section 3.2). Each ‘value’ \({\xi _{ij}}\) is an interval containing all the possible values of the feature Y j for an object iE (or i ∈ Ω). Instead of representing each object i and its description x i by a single point on a factorial plane in \({\mathbb{R}^2}\) (or \({\mathbb{R}^s}\)) as in classical principal component analysis (PCA), the proposed method visualizes each object i by a rectangle in \({\mathbb{R}^2}\) . Whereas the classical PCA is briefly sketched in section 9.1, we describe our generalized method in section 9.2. Thereby, we present a typical example concerning oils and fats in order to illustrate the effectiveness of the proposed symbolic PCA method.
Hans-Hermann Bock, A. Chouakria, P. Cazes, E. Diday
10. Discrimination: Assigning Symbolic Objects to Classes
Abstract
Kernel density estimation is a tool which allows the statistician to construct a density on any sample of data. Recent references on density estimation with a probabilistic background are numerous (e.g., books by Hand 1982, Silverman 1986, Devroye 1985). These methods compute a weighted sum of kernels centered on each data point.
Jean-Paul Rasson, Sandrine Lissoir
11. Clustering Methods for Symbolic Objects
Abstract
One of the most common tasks in (classical as well as symbolic) data analysis is the detection and construction of ‘homogeneous’ groups C1, C2,… of objects in a population Ω or E such that objects from the same group show a high similarity whereas objects from different groups are typically more dissimilar. Such groups are usually called ‘clusters’ and must be constructed on the basis of the (classical or symbolic) data which were recorded for the objects.
Marie Chavent, Hans-Hermann Bock
12. Symbolic Approaches for Three-way Data
Abstract
The increasing amount of information proposed to statisticians includes, in many applications, quantitative, qualitative or symbolic data which are observed at different time points t = 1,…, T. This implies three-way data, i.e. a sequence \({\underline X _1}\),…, \({\underline X _T}\) of T two-dimensional symbolic data arrays \({\underline X _t}\), = (X kit ) where k indexes individuals and j indexes variables. The investigation of such data requires to adapt and generalize classical and symbolic data analysis methods to the case of time series.
Mireille Gettler-Summa, Catherine Pardoux
13. Illustrative Benchmark Analyses
Abstract
The development of the SODAS software based on symbolic data analysis was extensively described in the previous chapters of this book. It was accompanied by a series of benchmark activities involving some official statistical institutes throughout Europe. Partners in these benchmark activities were the National Statistical Institute (INE) of Portugal, the Instituto Vasco de Estadistica Euskal (EUSTAT) from Spain, the Office For National Statistics (ONS) from the United Kingdom, the Inspection Générale de la Sécurité Sociale (IGSS) from Luxembourg and marginally the University of Athens1.
Raymond Bisdorff
14. The SODAS Software Package
Abstract
SODAS is a modular software in which each statistical method is manipulated as an icon and icons are linked in a chaining. A method is a module of statistical computation which is predefined in SODAS. A method is inserted (or suppressed) in a chaining using the ‘drag and drop’ procedure between two windows: the method window and the chaining window.
Alain Morineau
Backmatter
Metadaten
Titel
Analysis of Symbolic Data
herausgegeben von
Prof. Dr. Hans-Hermann Bock
Prof. Edwin Diday
Copyright-Jahr
2000
Verlag
Springer Berlin Heidelberg
Electronic ISBN
978-3-642-57155-8
Print ISBN
978-3-540-66619-6
DOI
https://doi.org/10.1007/978-3-642-57155-8