In parallel with the increasing availability of multiregional input–output (MRIO) tables, there has been a growing concern on IO modelling at lower levels of spatial disaggregation, to reflect the particular features of cities better. The urbanization process is one of the salient characteristics of the current stage of globalization, so it is imperative to know more about their global economic, social and environmental impacts. MRIO initiatives are defined at the country level, which means that we are potentially losing some key information about cities and their economic structures. In this paper, we fill this gap by putting together the IOT for the city of Bogota (Colombia) into the well-known OECD’s ICIO database. After describing the structure of both IOTs, we document the harmonization and nesting procedures in a step by step approach, focusing on the main challenges and assumptions that we have to make. Additionally, a case study has been carried out to weight the level of integration of Bogota in global value chains. The analysis proves the low level of global integration: the bulk of the valued-added generated in Bogota due to the city’s exports comes from the economy of the rest of the country and presents a significant deficit in its value-added balance. Apart, we hope it could shed some light to conduct similar adaptations for other cities.
Hinweise
Publisher's Note
Springer Nature remains neutral with regard to jurisdictional claims in published maps and institutional affiliations.
1 Introduction
Global multiregional input–output modelling (MRIO) has blossomed in the last decades in parallel with the increasingly available data, computational power and interest among the scientific community for the adequacy of this sort of models to appropriately measure the increasing complexity of global production and consumption through global value chains. MRIO models are mainly used to assess the environmental and social pressures of the global economy (Wiedmann and Lenzen 2018). These models depict at a high-resolution level—country and sectorial—the international trade of goods and services, which allows them to provide detailed and useful information for stakeholders and policymakers (Wiedmann and Barrett 2013).
The unit of analysis of those models is usually the country. Most of the available multiregional input–output databases provide individual country information for major economies, and one or several regional aggregations for the rest of the world (RoW). Subnational units are not considered. This situation has made room for the attempt to nest single regional input–output tables (SRIO) at a subnational level into the MRIO models. The goal is to improve the estimation of regional impacts by increasing the detail and accuracy of the relationships and dynamics between and within regional economies. Economic, social and environmental performance varies between regions because regions show different specializations patterns, inter-industry linkages (both within and across regions), population densities, workers skills, to cite only a few. These aspects determine the region’s vulnerability or resilience to economic downturns and climate change (Thissen et al. 2018) or their position and participation in global value chains (Meng and Yamano 2017). Malik et al. (2018) also highlight the need for a better understanding of within-countries effects of inter-regional interactions. These Spatially Explicit Input–Output models (SIO), as (Sun et al. 2019) called them, are relevant in the case of environmental assessments since they connect global production and trade to local environmental impacts and local consumption (Sun et al. 2019) or urban development (Zheng et al. 2019). These initiatives could be of the most interest in those cases where the region or city are a substantive part of the national economy, and its production systems are strongly intertwined in the global economy; as it happens in the case of Bogota which accounts for more than a quarter of the Colombian economy.
Anzeige
Most of the times, the “nesting” literature rely on non-survey methods to first estimate the regional input–output data due to the lack of information at the subnational level, because full-scale surveys tend to be unaffordable and time-consuming. (Boero et al. 2018) review the most common non-survey approaches, pointing to its main assumptions, such as the technology and final demand preferences homogeneity between the region and the country, and limitations, related to the use of balancing methods that might compound existing previous estimation errors. (Sun et al. 2019) provide an extensive review of SIO focusing on the environmentally extended MRIO models and the disaggregation of final demand and the environmental extensions. Examples of nested MRIO tables have increased in recent years (Sun et al. 2019) and take two main spatial directions: region-based and city-based studies. An example of the first ones is Wang et al. (2015) for the provinces of the Chinese economy, Hasegawa et al. (2015) for Japanese regions and Athanassiadis et al. (2018) for Brussels capital region. Among the second ones, the studies are mainly directed to Chinese, Australian and Japanese cities: for Melbourne city (Wiedmann et al. 2016), Hebei’s cities (Zheng et al. 2019), for Tokyo in the context of interregional aspects of waste (Tsukui et al. 2015) or also combinations of them: five Chinese cities and five Australian cities (Chen et al. 2016).
In the case of the city of Bogotá, the advantage is the disposal of a survey-based input–output table of Bogotá, which avoids the limitations related to the use of non-survey methods before the nesting procedure. This paper aims to nest the single region input–output table of the city of Bogota (Secretaria de Hacienda Distrital 2015) into the Inter-Country Input–Output (ICIO) Table provided by the Organization for Economic Co-operation and Development (OECD) (OCDE 2018). This will allow us to have a powerful tool in order to assess and unravel the complex relationships of Bogotá with the rest of the country and other countries of South America and the rest of the world, how the city is involved in global value chains and its sustainability.
2 Nesting Bogota’s IOT into an MRIO table
2.1 Data requirement
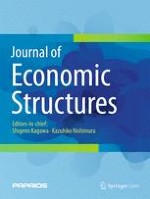
Only two free available MRIO databases include individual data for Colombia, i.e., EORA (Lenzen et al. 2013) and ICIO (OCDE 2018). The greater sectorial disaggregation (36 versus 26) of the latter led us to choose this dataset as the mother matrix. It consists of a time series of MRIO tables ranging from 2005 to 2015 (11 years), covering 36 harmonized industries for 64 countries—36 OECD and 28 Non-OCDE economies—and a RoW Region. It also provides two split tables for China and Mexico with processing activities (see Fig. 1).
Fig. 1
Structure of ICIO Tables, 2018 edition. The ICIO table includes a 2484 square intermediate transaction matrix (Z); a 65 × 2848 taxes less subsidies on intermediate and final products matrix (TLS); a 1 × 2484 vector of value added—including net taxes—(VA), a 1 × 2484 vector of total output (X); a 2484*414 final demand matrix—6 final demand categories for each country
In turn, the input–output information for the city of Bogotá is available only for 2012 (Secretaria de Hacienda Distrital 2015), and it is expressed in local currency (Colombian peso, COP). The city IOT features three agriculture sectors, two mining sectors, 21 industrial sectors, three sectors for Electricity, Gas and Water and 19 services, for a total of 48 sectors. Final demand identifies household consumption, government consumption, and spending on the gross formation of capital. Imports and exports are disaggregated into international trade and trade with the rest of the country.
Anzeige
It is worth noting that imports and exports are treated very differently in the SRIO and MRIO models selected in this article. Specifically, Bogota’s SRIO table is the competitive-imports type (Miller and Blair 2009), so domestic production and imports are indistinctly included in intermediate and final consumption blocks; moreover, the table does not distinguish between Bogota’s intermediate and final exports. This structure posits some particular problems in the nesting process.
2.2 Data harmonization
Since Bogota’s IOT and ICIO-OECD tables have different features and structure, harmonizing both datasets is a necessary step before starting the nesting process. Harmonization starts by selecting 2012 as the central period of our analysis: although ICIO-OCDE latest release includes more recent years (until 2015), as said above Bogota IOT is only available for 2012, so we found ourselves forced to work with 2012 data. Afterward, we converted Bogota IOT units (originally in COP million) to USD million using the average exchange rate for 2012 (1 USD = 1796.9 COP). Once we have homogenized currency and years, we applied some transformations to ICIO tables in order to simplify the nesting process.
In a first step, focusing on ICIO tables, we aggregated the information of processing exports from Mexico and China to the corresponding main entries of each country. We found this distinction not relevant given the aim of this work, which is to shed light on topics related to Bogota. The second modification made on ICIO tables was to change the placement of Colombia’s data within the ICIO tables. Colombia is originally placed on 43th position in the ICIO regional arrangement (counting from left to right and from top to bottom), we re-located it on the first position for practical reasons as such relocation simplifies our calculations and the presentation of the results. Eventually, Bogota’s entries will be inserted first in the nested table, and Colombia will be placed in the second position.
2.3 Sectorial correspondences
The final step to complete the harmonization was to find correspondences in the sectorial arrangement of ICIO and Bogota IOT and make them consistent in one sectorial classification. ICIO tables originally have 36 industries based on ISIC REV. 4 (United Nations 2008) while Bogota IOT has 48 sectors based on an adaptation of ISIC REV. 3.1 to the Colombian economy made by DANE (2009). Since differences in descriptions of activities and sectors of both classifications are significant, in order to find appropriate correspondences, we had to reduce both sets of data to a sectoral arrangement of 32 sectors, following, as far as possible, the classification of the ICIO tables (mother matrix). Tables 1 and 2 depict sectorial concordances applied for each dataset:
Table 1
Sectorial correspondences for ICIO tables.
Source: own elaboration
ICIO Code
ICIO industries
Harmonized industries for nesting process
Code
D01T03
Agriculture, forestry and fishing
Agriculture, forestry and fishing
c1
D05T06
Mining and extraction of energy producing products
Mining and quarrying
c2
D07T08
Mining and quarrying of non-energy producing products
D09
Mining support service activities
D10T12
Food products, beverages and tobacco
Food products, beverages and tobacco
c3
D13T15
Textiles, wearing apparel, leather and related products
Textiles, wearing apparel, leather and related products
c4
D16
Wood and products of wood and cork
Wood and products of wood and cork
c5
D17T18
Paper products and printing
Paper products and printing
c6
D19
Coke and refined petroleum products
Coke and refined petroleum products
c7
D20T21
Chemicals and pharmaceutical products
Chemicals and pharmaceutical products
c8
D22
Rubber and plastic products
Rubber and plastic products
c9
D23
Other non-metallic mineral products
Other non-metallic mineral products
c10
D24
Basic metals
Basic metals
c11
D25
Fabricated metal products
Fabricated metal products
c12
D26
Computer, electronic and optical products
Computer, electronic and optical products
c13
D27
Electrical equipment
Electrical equipment
c14
D28
Machinery and equipment, nec
Machinery and equipment, nec
c15
D29
Motor vehicles, trailers and semi-trailers
Motor vehicles, trailers and semi-trailers
c16
D30
Other transport equipment
Other transport equipment
c17
D31T33
Other manufacturing; repair and installation of machinery and equipment
Other manufacturing; repair and installation of machinery and equipment
c18
D35T39
Electricity, gas, water supply, sewerage, waste and remediation services
Electricity, gas, water supply, sewerage, waste and remediation services
c19
D41T43
Construction
Construction
c20
D45T47
Wholesale and retail trade; repair of motor vehicles
Wholesale and retail trade; repair of motor vehicles
c21
D49T53
Transportation and storage
Transportation and storage
c22
D55T56
Accommodation and food services
Accommodation and food services
c23
D58T60
Publishing, audiovisual and broadcasting activities
Telecommunications and other information services
c24
D61
Telecommunications
D62T63
IT and other information services
D64T66
Financial and insurance activities
Financial and insurance activities
c25
D68
Real estate activities
Real estate activities
c26
D69T82
Other business sector services
Other business sector services
c27
D84
Public admin. and defence; compulsory social security
Public admin. and defence; compulsory social security
c28
D85
Education
Education
c29
D86T88
Human health and social work
Human health and social work
c30
D90T96
Arts, entertainment, recreation and other service activities
Arts, entertainment, recreation and other service activities
c31
D97T98
Private households with employed persons
Private households with employed persons
c32
Table 2
Sectorial correspondences for Bogota IOT table.
Source: own elaboration
BOG code
Bogota IOT industries
Harmonized industries for nesting process
Code
1
Productos agropecuarios
Agriculture, forestry and fishing
c1
2
Productos de la silvicultura
3
Productos de la pesca y la acuicultura
Mining and quarrying
c2
4
Carbón, petróleo, gas y minerales metálicos
5
Minerales no metálicos
6
Productos alimenticios y bebidas
Food products, beverages and tobacco
c3
7
Productos textiles
Textiles, wearing apparel, leather and related products
c4
8
Tejidos de punto y ganchillo; prendas de vestir
9
Curtido y preparado de cueros, productos de cuero y calzado
10
Productos de madera, corcho, paja y materiales trenzables
Wood and products of wood and cork
c5
11
Productos de papel, cartón y sus productos
Paper products and printing
c6
12
Edición, impresión y artículos análogos
13
Productos de la refinación del petróleo y combustible nuclear
Coke and refined petroleum products
c7
14
Sustancias y productos químicos
Chemicals and pharmaceutical products
c8
15
Productos de caucho y de plástico
Rubber and plastic products
c9
16
Productos minerales no metálicos
Other non-metallic mineral products
c10
17
Productos metalúrgicos básicos
Basic metals
c11
18
Productos elaborados de metal (excepto maquinaria y equipo)
Fabricated metal products
c12
20
Maquinaria de oficina, contabilidad e informática
Computer, electronic and optical products
c13
22
Equipo y aparatos de radio, televisión y comunicaciones
23
Instrumentos médicos, ópticos y de precisión, fabricación de relojes
21
Maquinaria y aparatos eléctricos ncp
Electrical equipment
c14
19
Maquinaria y equipo
Machinery and equipment, nec
c15
24
Vehículos automotores, remolques y semirremolques
Motor vehicles, trailers and semi-trailers
c16
25
Otros tipos de equipos de transporte
Other transport equipment
c17
26
Muebles; industrias manufactureras ncp; reciclaje
Other manufacturing; repair and installation of machinery and equipment
c18
27
Energía eléctrica
Electricity, gas, water supply, sewerage, waste and remediation services
c19
28
Gas domiciliario
29
Agua
30
Servicios de alcantarillado y eliminación de desperdicios, saneamiento y otros servicios de protección del medio ambiente
31
Trabajos de construcción de edificaciones; acondicionamiento de edificaciones
Construction
c20
32
Trabajos de construcción de obras de ingeniería civil
33
Comercio
Wholesale and retail trade; repair of motor vehicles
c21
34
Servicios de reparación de automotores, de artículos personales y domésticos
36
Servicios de transporte terrestre
Transportation and storage
c22
37
Servicios de transporte por vía aérea
38
Servicios complementarios y auxiliares al transporte
35
Servicios de alojamiento, suministro de comidas y bebidasv
Accomodation and food services
c23
39
Servicios de correos y telecomunicaciones
Telecommunications and other information services
c24
40
Servicios de intermediación financiera, de seguros y servicios conexos
Financial and insurance activities
c25
41
Servicios inmobiliarios y de alquiler de vivienda
Real estate activities
c26
42
Servicios a las empresas excepto servicios financieros e inmobiliarios
Other business sector services
c27
43
Administración pública y defensa; dirección, administración y control del sistema de seguridadsocial
Public admin. and defence; compulsory social security
c28
44
Servicios de enseñanza de mercado
Education
c29
45
Servicios de enseñanza de no mercado
46
Servicios sociales y de salud de mercado
Human health and social work
c30
47
Servicios de asociaciones y esparcimiento, culturales, deportivos y otros servicios de mercado
Arts, entertainment, recreation and other service activities
c31
48
Servicios domésticos
Private households with employed persons
c32
3 Methods
The simplest way to undertake the process of nesting a subnational matrix—a city table in our case—into an MRIO is to split the original national set of data in the latter into two separated units. On the one hand, it means that we need to make room for Bogota (i.e., to add a set of rows and columns) in the original ICIO table, spaces that will be filled with the IO data from the city table and, on the other hand, to replace the original Colombian information with re-calculated data coming from the subtraction of Bogota data from the original Colombian ones. We will call these regions Rest of Colombia (RoC hereafter).
To proceed, we set up an augmented MRIO table, including a Z matrix of intermediate consumption, another matrix for final demand denoted by Y, and two row vectors of value added (V) and total output (X). All of their elements indexed by exporting country r, importing country s, supplying sector i, and demanding sector j. With this at hand, \(Z^{rs}\) accounts for the 32 × 32 intermediate consumption matrix from region r to region s; \(Y^{rs}\) is the 32 × 1 vector of final demand from region r to region s; \(V^{r}\) and \(X^{r}\) represent region r value added and gross output vectors, respectively, both of dimensions 1 × 32. We place Bogota data in the first block of rows and columns, the Rest of Colombia in the second position, and the rest of the world countries from positions 3 to 66. Hence, the augmented intermediate matrix Z accounts for 66 countries or regions (65 from the original ICIO plus the city of Bogota) and 32 sectors. Figure 2 shows the general structure of the augmented MRIO table, where the information in the green areas needs to be calculated. Recall Bogota is region 1, and that RoC is region 2.
Fig. 2
The augmented MRIO table source: own elaboration. Bogotá is region 1, RoC is region 2
×
The task ahead is about filling the green areas of Fig. 2, corresponding to intermediate and final consumption as well as the value added and total output vectors, with the information of Bogota’s SRIO and ICIO’s MRIO. The blank areas are those of the rest of the world countries, which remain unchanged with respect to the original ICIO. In what follows, we first address the treatment of re-exports, to then undertake these tasks in the subsequent sections.
3.1 Dealing with re-exports (imported goods eventually exported)
A competitive input–output table includes the re-exported, i.e., those imported goods that are re-exported to the rest of the regions of the country, or even, to rest of the world without further processing. In the specific case of Bogota, this could be particularly intense in some sectors such as “Agriculture, Forestry and Fishing” or “Computer, electronic and optical products” for they show a high volume of total supply, but a low local production, 2%, and 4%, respectively. To deal with this accounting issue, we first identify if there are re-exports in the sectors by comparing the imports in each sector with the total output (Zheng et al. 2019). If imports were larger than local output, we would assume the existence of re-exports. Otherwise, there will be zero. In equivalent terms, re-exports will be calculated using the following equation:
where \({\text{RX}}_{i}^{\text{B}}\) are sector i re-exports of the city of Bogota; \(M_i^{{\text{RoC}}}\) and \(M_i^{{\text{RoW}}}\) the city imports of sector i from the Rest of Colombia (RoC) and the rest of the world (RoW), respectively; \(Z_{i}^{B}\) the intermediate consumption of sector i; and \(A_{i}^{B}\) denotes sector i domestic absorption of the city of Bogota, which includes total final consumption (by households and the government) and fixed capital formation.
Once the presence of re-exports is detected, they will be proportionally subtracted from sectorial imports, as well as exports, in a way that takes into account the share of regional and international imports. To do that, we first define the share of imports from the Rest of the World as
where \(\bar M_i^{{\text{RoW}}}\) and \(\bar M_i^{{\text{RoC}}}\) are the imports net of “re-exports” from RoW and RoC, respectively. We proceed in a similar way to subtract re-exports from exports according to the following equations:
where \(\bar{X}_{i}^{\text{RoW}}\) and \(\bar{X}_{i}^{\text{RoC}}\) are net exports of “re-exports” from RoW and RoC, respectively.
Results on corrected imports are presented in Table 3.
Table 3
Trade flows excluding re-exports (millions of dollars).
Source: own elaboration
Industry
RX
\(r_{i}^{m}\)
Net row imports
Net RoC imports
\(r_{i}^{X}\)
Net row exports
Net RoC exports
1
Agriculture, forestry and fishing
163.8
19%
713.2
3109.5
–
0.0
88.1
2
Mining and quarrying = 2 + 3+4
0.0
–
45.7
532.4
–
2.1
116.7
3
Food products, beverages and tobacco
0.0
–
1036.2
3178.8
–
107.2
3257.6
4
Textiles, wearing apparel, leather and related products
0.0
–
1973.3
781.2
–
335.9
1783.0
5
Wood and products of wood and cork
0.0
–
97.9
102.5
–
0.2
11.2
6
Paper products and printing
0.0
–
377.8
928.1
–
130.2
700.5
7
Coke and refined petroleum products
0.0
–
772.1
2210.0
–
14.8
121.5
8
Chemicals and pharmaceutical products
0.0
–
4080.4
261.7
–
504.0
3035.0
9
Rubber and plastic products
0.0
–
832.0
0.0
–
214.0
715.4
10
Other non-metallic mineral products
653.0
12%
171.8
1224.1
3%
25.2
710.8
11
Basic metals
274.3
74%
674.4
233.9
0%
2.1
429.1
12
Fabricated metal products
0.0
–
793.4
65.7
–
84.9
437.5
13
Computer, electronic and optical products
705.6
100%
1201.0
0.0
0%
0.1
82.1
14
Electrical equipment
2246.7
99%
2489.8
30.2
3%
31.7
894.5
15
Machinery and equipment, nec
251.3
94%
2581.9
169.1
6%
42.6
659.3
16
Motor vehicles, trailers and semi-trailers
242.2
84%
3315.3
629.4
33%
478.9
953.3
17
Other transport equipment
133.2
100%
1076.4
0.0
0%
0.3
141.0
18
Other manufacturing; repair and installation of machinery and equipment
0.0
–
442.8
371.0
–
59.0
332.2
19
Electricity, gas, water supply, sewerage, waste and remediation services
0.0
–
0.0
716.3
–
0.0
412.1
20
Construction
0.0
–
0.0
0.0
–
0.0
0.0
21
Wholesale and retail trade; repair of motor vehicles
0.0
–
0.0
0.0
–
1.6
3338.0
22
Transportation and storage
0.0
–
885.2
279.9
–
796.9
2175.8
23
Accommodation and food services
0.0
–
0.0
883.1
–
2.7
1018.1
24
Telecommunications and other information services = 26 + 27 + 28
0.0
–
0.0
0.0
–
146.1
1883.9
25
Financial and insurance activities
0.0
–
1.1
0.0
–
50.3
2909.8
26
Real estate activities
0.0
–
0.0
0.0
–
0.0
0.0
27
Other business sector services
0.0
–
0.1
0.0
–
610.5
6775.5
28
Public admin and defence; compulsory social security
0.0
–
0.0
0.0
–
0.0
0.0
29
Education
0.0
–
0.0
0.0
–
0.0
0.0
30
Human health and social work
0.0
–
0.0
0.0
–
0.0
696.0
31
Arts, entertainment, recreation and other service activities
0.0
–
2.8
0.0
–
35.5
242.8
32
Private households with employed persons
0.0
–
0.0
0.0
–
0.0
0.0
Figure 3 provides a more detailed focus on our augmented MRIO, identifying some key parts that will be addressed in the next pages.
Fig. 3
Zones to fill in the augmented MRIO table
(source: own elaboration)
×
3.2 Extraction of domestic and imported information
A competitive table such as Bogota’s SRIO does not distinguish between domestically produced and imported products, i.e., imports are included in both intermediate and final consumption. In this subsection we deal with this issue, applying a procedure that will allow us to identify intermediate imports (areas [4] and [7] in Fig. 3) and final imports (areas [12] and [15] in Fig. 3), in both cases distinguishing between the Rest of Colombia and other countries sources. Once those components are identified, local results are going to be obtained by differences (areas [1] and [9]).
To do that, and absent further information, we assume that the distribution of geographical origins of goods and services is the same for both intermediate and final uses (Weber et al. 2008; Meng et al. 2016; Zheng et al. 2019). In other words, for any given product used in the city, there is a fixed share of origins (local, regional and from third countries) that applies for both intermediate and final uses. Following Weber et al. (2008), we calculate the share of imports from a given country or region r on the total (net) supply of good and services as
where \(Z^{B}\) is the original SRIO for Bogota, which, as said before, includes domestic and imported information, and \(Z^{r1}\) are the intermediate consumption matrices from each of the r regions to Bogota (region 1) in the augmented MRIO table (i.e., areas [4] and [7] of Fig. 3). In Eq. (10), \(\iota\) is the unitary vector, and it is straightforward to see the intermediate consumption matrix for Bogota in the augmented MRIO (\(Z^{11}\)) is obtained as a residual.
As mentioned above, we use the same approach to separate the original SRIO’s final demand vector, \(Y_{i}^{\text{B}}\) into 66 vectors of the final demand the city faces. We apply the same coefficients of Eqs. 8–10 to compute the city’s final demand vectors by replacing \(Z^{B}\) by the original SRIO’s \(Y^{B}\) vector. With that, we fill the areas [9], [12] and [15] in Fig. 3.
4 Processing intermediate and final exports of Bogota
The competitive SRIO table of Bogota provides information about the regional exports, i.e., to the rest of the country and exports to the rest of the world, but without differentiation between intermediate and final. To fill this gap, we need to incorporate additional exogenous information. In our case, this information is provided by the National Administrative Department of Statistics of Colombia (DANE), which offers import and export microdata information for the city of Bogota, from which we identify final and intermediate imports and exports for 18 sectors belonging to Agriculture, Mining and Industry (DANE 2019). The information for the rest of the sectors (Electricity, Gas, Water, Construction and Services) is extracted from the Colombian data in ICIO (see Table 4).
Table 4
Shares of intermediate and final exports and imports.
Source: authors calculations based on DANE (2009) and ICIO (OCDE 2018)
Industry
Exports
Intermediate (%)
Finals (%)
1
Agriculture, forestry and fishing
21
79
2
Mining and quarrying = 2 + 3+4
50
50
3
Food products, beverages and tobacco
95
5
4
Textiles, wearing apparel, leather and related products
86
14
5
Wood and products of wood and cork
100
0
6
Paper products and printing
37
63
7
Coke and refined petroleum products
86
14
8
Chemicals and pharmaceutical products
98
2
9
Rubber and plastic products
100
0
10
Other non-metallic mineral products
93
7
11
Basic metals
26
74
12
Fabricated metal products
65
35
13
Computer, electronic and optical products
39
61
14
Electrical equipment
61
39
15
Machinery and equipment, nec
90
10
16
Motor vehicles, trailers and semi-trailers
13
87
17
Other transport equipment
11
89
18
Other manufacturing; repair and installation of machinery and equipment
100
0
19
Electricity, gas, water supply, sewerage, waste and remediation services
28
72
20
Construction
0
0
21
Wholesale and retail trade; repair of motor vehicles
33
67
22
Transportation and storage
51
49
23
Accommodation and food services
100
0
24
Telecommunications and other information services = 26 + 27 + 28
57
43
25
Financial and insurance activities
64
36
26
Real estate activities
97
3
27
Other business sector services
37
63
28
Public admin and defence; compulsory social security
43
57
29
Education
100
0
30
Human health and social work
67
33
31
Arts, entertainment, recreation and other service activities
94
6
32
Private households with employed persons
0
0
Once the shares of Bogota’s intermediate and final exports are calculated, we proceed to allocate them among destinations. We start with intermediate exports to RoC (submatrix [2] in Fig. 3), to do that we assume that the city of Bogota’s exports follows the same sectorial pattern as the intermediate consumption of the original SRIO table. For the exports to the rest of the world (submatrix [3] in Fig. 3), we take a different avenue by assuming that the city of Bogota behaves as Colombia in the original ICIO MRIO table.
In what concerns final exports, we first apply the distribution of regional to total exports to the calculated final exports to identify exports to the Rest of Colombia (area [10] of Fig. 3). Then we apply the distribution of destinations obtained from ICIO to calculate final exports to each of the represented countries of the world (area [11] of Fig. 3). This ends the adjustments required to nest the Bogota information into our augmented ICIO model.
5 Dealing with the Rest of Colombia data
When adding a sub-region within an existing MRIO framework, it is necessary to somehow subtract the sub-region data from the aggregated one, i.e., the city of Bogota from Colombia in this paper. The simplest way to address that is by “reversing” the usual aggregation process, i.e., completing the added rows and columns with city data and then replacing the original spaces of the whole country with those of the rest of the country, calculated by subtracting the city figures to the original country ones, in the adequate sectoral and country position. This method could, nevertheless, result in negative elements, particularly in those sectors in which the city highly contributes to the total output of the national sector.
In order to overcome those issues, we choose an alternative option: We use the technical structure of Colombia in the original ICIO table as a proxy for the technical structure of RoC in the new, augmented matrix. Thus, by multiplying the output of RoC to the corresponding technical coefficients of ICIO for Colombia, we can fill the domestic RoC matrix and the intermediate imports of RoC from the rest of the world (areas [5] and [8], respectively, in Fig. 3). Mathematically, it could be expressed as follows:
where \(\overline{{z_{ij}^{r2} }} {\mkern 1mu}\) are region 2 (i.e., RoC) imported intermediate consumptions from region r, \(q_{j}^{2}\) is sector j’s output of RoC (computed as the difference between the total output provided by ICIO and the output of the city of Bogota) and \(a_{ij}^{r2}\) represent the technical coefficients of Colombia from the original ICIO data.
The intermediate exports of RoC to RoW (section [6] in Fig. 3) have been addressed differently. To fill this block, we have assumed that the distribution of destinations of RoC is the same as Colombia’s in the original ICIO, that is
where \(c_{ij}^{2s}\) are the coefficients of distribution and \(z_{ij}^{{{\text{COL}},s}}\) the intermediate consumption of Colombia in the original ICIO matrix. Therefore, the intermediate exports of RoC to RoW will be obtained by applying the following equation:
Finally, final demand data for the Rest of Colombia have been computed by differences (areas [13], [14] and [16]).
5.1 Balancing the matrix
To balance the matrix, we use a GRAS method (Junius and Oosterhaven 2003; Temurshoev et al. 2013) using as restriction a vector composed by the output of Bogota, in the first position, the output of the RoC—the difference between the output of Bogota and Colombia—in the second position, and the output of ICIO original table for the rest of countries/regions
6 A case study: the role of Bogota and Colombia in global value chains
Nesting Bogota’s IOT into an MRIO model allows us to analyze the city participation in global value chains, in this particular case study we will focus on value added. The relevance of that participation stems from the fact that the economic and social benefits of international trade for a country, region or city depends not only on trade volumes but also on its ability to generate value added within the territory.
A first conclusion we reach by analyzing the value added associated to global production chains is that this is more important in small regions compared to larger ones (Table 5). Indeed, while for Bogota and the Rest of Colombia the value added in exports represents, respectively, 29% and 26% of total domestic value added, the average for the five regions of the world represented in the same table is just about 13% (similar results are obtained for imports). The size of the economy is important given that the smaller the production of a given city or region, the smaller the possibilities of enjoying scale economies and the smaller the likelihood of having natural resources, implying a larger need of trading with other partners, both domestically or internationally.
Table 5
Domestic value added, value added in trade and balance of value added, millions of US dollars, 2012
Domestic
Exports (%)
Imports
VA balance
% Balance/exports
BOG
64,675
71%
25,939
29%
31,496
33%
− 5557
− 21%
RoC
190,088
74%
68,053
26%
70,701
27%
− 2648
− 4%
RoSA
2844,893
87%
414,507
13%
450,679
14%
− 36,172
− 9%
NAFTA
17,112,617
92%
1550,282
8%
2154,168
11%
− 603,886
− 39%
EU
13,889,825
86%
2351,109
14%
2051,893
13%
299,216
13%
CHN
6507,256
81%
1531,727
19%
1350,410
17%
181,317
12%
RoW
21,998,412
87%
3404,988
13%
3237,258
13%
167,729
5%
Total
62,607,766
87%
9346,606
13%
9346,606
13%
The value-added balance informs about the difference between the value added generated in exports and those generated in imports for a given region. The city of Bogota has a negative balance that reaches − 5557 million dollars, a large value that represents a 21% of the value added in exports of the city. It is also high compared to the Rest of Colombia (RoC), that features a balance of − 2648 million dollars, equivalent to 4% of its total value added in exports of that region (Table 5).
The flows of the city’s value added in exports and imports are very dependent on the trade with the rest of the country (Fig. 4): Practically 87% of the value added generated in Bogota due to the city’s exports comes from the economy of the Rest of Colombia (RoC), followed by NAFTA with a 5% share and the Rest of the World (RoW) with 4%. This contrasts with the RoC, where given the different composition of its exports with respect to Bogota, the main sources of value added in exports are NAFTA (37%), followed by the RoW (21%), while Bogota is in the third place with 17%.
Fig. 4
Value added in trade, Bogota and the Rest of Colombia, in %, 2012
×
However, turning to the analysis of value added in imports, we verify that both Bogota and the Rest of Colombia have similar patterns (Fig. 4). While a 37% of Bogota’s value added in imports is generated in the RoC, a 32% of RoC’s value added in imports is created in Bogota. After RoC, the places where more value added is generated by the imports of Bogota are NAFTA, RoW, China and the European Union. In both cases, the Rest of South America (RoSA) occupies the last place. This is just another way to highlight the low level of integration of Latin American countries, a well-known feature already mentioned in the literature (Torres and Gilles 2013; Banacloche et al. 2020; Gilles 2018). Overall, the evidence for the case of Bogota shows the high significance of both exports to and imports from the Rest of Colombia, relative to foreign countries.
In order to identify the role of Bogota in global value chains, we next focus on international trade, i.e. we do not take into account trade to the Rest of Colombia. It should be clear from Fig. 4 that these economic relationships with the world are small in absolute terms, particularly in what concerns to exports. See Table 6 for a complete overview of these results.
Table 6
Value added in exports and imports. Bogotá, millions of US dollars, 2012
Bogota industries
Code
Value added in exports
Value added in imports
Rest of Colombia
World
Total VAiX
Rest of Colombia
World
Total VAiM
Agriculture, forestry and fishing
c01
64
6
70
1 141
361
1 503
Mining and quarrying
c02
115
10
126
–
–
–
Food products, beverages and tobacco
c03
877
34
910
2 822
1 501
4 323
Textiles, wearing apparel, leather and related products
c04
693
133
826
504
1 444
1 948
Wood and products of wood and cork
c05
9
1
10
3
4
8
Paper products and printing
c06
251
76
327
213
155
368
Coke and refined petroleum products
c07
54
13
67
672
427
1 099
Chemicals and pharmaceutical products
c08
1 440
236
1 676
76
1 167
1 242
Rubber and plastic products
c09
251
64
315
7
168
175
Other non-metallic mineral products
c10
252
13
264
22
6
28
Basic metals
c11
173
25
198
–
–
–
Fabricated metal products
c12
176
43
218
33
293
326
Computer, electronic and optical products
c13
14
1
15
0
730
731
Electrical equipment
c14
488
43
531
17
1 790
1 807
Machinery and equipment, nec
c15
236
18
254
124
2 065
2 189
Motor vehicles, trailers and semi-trailers
c16
174
90
264
215
2 352
2 567
Other transport equipment
c17
23
3
26
1
1 011
1 012
Other manufacturing
c18
181
32
214
314
482
797
Electricity, gas, water supply
c19
538
62
600
437
76
512
Construction
c20
57
8
65
1 287
1 656
2 943
Wholesale and retail trade; repair of motor vehicles
c21
2 591
357
2 949
458
818
1 276
Transportation and storage
c22
1 182
410
1 592
613
974
1 586
Accommodation and food services
c23
570
20
590
1 599
511
2 110
Telecommunications and other information services
c24
1 264
175
1 439
89
120
209
Financial and insurance activities
c25
2 472
185
2 656
63
87
150
Real estate activities
c26
1 104
164
1 268
42
45
87
Other business sector services
c27
6 660
1 019
7 679
18
24
42
Public admin. and defence; compulsory social security
c28
–
–
–
544
644
1 188
Education
c29
2
0
2
63
102
165
Human health and social work
c30
322
5
328
160
751
910
Arts, entertainment, recreation and other services
c31
407
53
460
56
138
194
Private households with employed persons
c32
–
–
–
–
–
–
Total
22,641
3298
25,939
11,593
19,904
31,496
In relation to the sectors of the economy of Bogotá that participate in global value chains, first measured by their generation of value added in exports, it should be noted that they constitute a very narrow set, as it can be seen in panel (a) of Fig. 5. Indeed, three sectors belonging to the services already account for 54% of the total value added generated by exports: other business sector (31%), transportation (12%) and wholesale and retail trade (11%). The list follows with the chemical industry (7%), financial and insurance (6%) and telecommunications and real estate activities, each one with a 5% share. The importance of the services of Bogotá in generating value added, compared to industrial sectors, shows the high specialization level of the city of Bogotá in the former.
Fig. 5
Value added in international trade, Bogota industries, 2012
×
Turning now to the analysis of the value added included in imports, the city industries that contributes the most to its generation are motor vehicles (12%), machine and equipment (10%), electrical equipment (9%), construction (8%) and food and beverage products (8%). The comparison between results presented in panel (a) and (b) allows us to conclude that there are no clear correspondences between sectors that are at the same time competitive (measured by their ability to generate value added in exports) and sectors that require a large amount of imports. In other words, contrary to what it is usually seen in sectors integrated to global value chains, Bogota’s industries do not “import to export”.
To deepen the analysis, let us now present the above information expressed in relative terms. We ask which is the amount of foreign value added that each sector imports or exports compared to the total value added generated. This is shown in Table 7. For example, foreign demand accounts for 33.4% of the total value added generated in the Motor vehicles industry of Bogota; or also, the value added generated by the Computer industry of Bogota is 99.9% foreign value added. In this way, we identify the industries that are more integrated to the global economy.
Table 7
Bogota top 10 industries according to their foreign share in value added
Value added in exports
Value added in imports
Bogota sector
% Foreign
Bogota sector
% Foreign
Motor vehicles, trailers and semi-trailers
33.4
Computer, electronic and optical products
99.9
Rubber and plastic products
14.3
Other transport equipment
99.9
Paper products and printing
13.8
Electrical equipment
99.0
Chemicals and pharmaceutical products
13.6
Machinery and equipment, nec
94.2
Basic metals
12.5
Motor vehicles, trailers and semi-trailers
91.4
Textiles, wearing apparel, leather and related products
11.8
Chemicals and pharmaceutical products
90.7
Fabricated metal products
11.8
Fabricated metal products
71.9
Transportation and storage
10.1
Rubber and plastic products
69.2
Other transport equipment
9.8
Textiles, wearing apparel, leather and related products
60.9
Agriculture, forestry and fishing
8.2
Wood and products of wood and cork
40.5
The information in this table permits to say, first, that there is a large difference in terms of participation of foreign value added in exports and in imports, consistent with the relatively closed economy of Bogotá. Second, even that there are some sectors that appear in both top ten lists (motor vehicles, rubber and plastics, chemical and pharmaceutical, textiles, fabricated metal products, other transport equipment), the low records of foreign value added in exports implies those sectors are poorly integrated to the international economy. In other terms, the city of Bogota needs imports to produce goods and services that are ultimately consumed in its own domestic market.
7 Conclusions
Endowed with the input–output table for the city of Bogota and the well-known OECD’s ICIO table, we have shown the process of nesting the former into the latter comprehensively. We consider the incorporation of more detailed geographical analyses is a necessary step to a better understanding of globalization impacts at the city scale. Moreover, in a world increasingly characterized by the urbanization of economic activity and social relationships, having such details is a ‘must’ in order to propose better policies and conduct higher quality assessment analyses.
In the particular case we have addressed, we have benefitted from the fact that Bogota’s IOT has a broader disaggregation than ICIO’s, which undoubtedly facilitated our elaboration of sectoral correspondences between both tables. We have faced with diverse issues concerning data availability (e.g., lack of an updated table for Bogota) and required assumptions (to decide, for example, how to split sectorial aggregates into their intermediate and final components). However, we are confident that the result of our approach has yielded a robust representation of the city of Bogota in the international context given by the ICIO table.
We consider this article can inspire similar analyses for other cities in the world, in particular in Latin America’s Mexico City and Sao Paulo or even Buenos Aires, Santiago and Lima. The countries these cities belong to are called to have an increasing role in the near future, which, together with the abovementioned urbanization process, invites to have a better understanding. Despite being integrated into global value chains only in their initial stages, these countries and cities have an essential stake in terms of Sustainable Development Goals given their natural resource endowment and food supply potential for the entire globe. Having tools such as input–output analysis to assess the environmental impacts and footprints (in terms of water use, emissions, waste and the like) of these global phenomena at city levels is an improvement concerning the more available aggregated, national-level approach.
Competing interests
The authors declare that they have no competing interests.
Open AccessThis article is licensed under a Creative Commons Attribution 4.0 International License, which permits use, sharing, adaptation, distribution and reproduction in any medium or format, as long as you give appropriate credit to the original author(s) and the source, provide a link to the Creative Commons licence, and indicate if changes were made. The images or other third party material in this article are included in the article's Creative Commons licence, unless indicated otherwise in a credit line to the material. If material is not included in the article's Creative Commons licence and your intended use is not permitted by statutory regulation or exceeds the permitted use, you will need to obtain permission directly from the copyright holder. To view a copy of this licence, visit http://creativecommons.org/licenses/by/4.0/.
Publisher's Note
Springer Nature remains neutral with regard to jurisdictional claims in published maps and institutional affiliations.
Current development of the multiregional input–output (MRIO) databases has favored the generalization of its implementation in multiple economic and environmental applications (López et al. 2017). The disaggregation level, in terms of both intermediate and final goods and services that the different available MRIO models feature, allows for better identification of global production chains (Tukker and Dietzenbacher 2013). The success of the MRIO models is based on the traceability of current international fragmentation of production processes among industries between different countries. In a MRIO table, the exports of a given sector of a country are the imports of the same or another sector in another country. The detailed direct and indirect linkages derived from that inter industrial relationships have provided institutions, organizations, governments, and countries with a significant amount of useful information to develop different environmental applications (López et al. 2017).
The MRIO table scheme is shown in Fig. 6, which represent a table with two countries and two sectors per country. By columns, in the intermediate goods block, we can differentiate between domestic and imported intermediate inputs. Note that intermediate inputs of region 1 from region 2 are equal to intermediate exports from region 2 to region 1. In the first column of the final demand block, in turn, we can find the domestically supplied final demand of region 1 and the imported final demand of region 1 from region 2 (which is equal to the exports of final goods from region 2 to region 1). The value-added block provides information about the income generation by region and by industry in the production process. The sum-up by rows has to be equal to the sum-up by columns (Peters et al. 2011; López et al. 2017).
Fig. 6
Multiregional input–output scheme
(source: own elaboration)
×
The MRIO model can be easily explained by starting from the fundamental equation of Leontief’s quantity model, an n linear equations system with n variables, shown in Eq. 14:
$$x = \left( {I - A} \right)^{ - 1} y,$$
(14)
where \(x\) is the total output, \(A\) is the technical coefficients matrix, \(\left( {I - A} \right)^{ - 1}\) is the inverse matrix of Leontief and \(y\) is the final demand vector.
Taking into account the production of several regions in a multiregional context (López et al. 2017), the MRIO can be expressed as:
where \(x^{r}\) is the output vector of each of the regions. \(A^{rr}\) is the domestic technical coefficients matrix of region \(r\), and \(A^{rs}\) is region \(r\) technical coefficients matrix of imported intermediate goods from region \(s\). Finally, \(y^{rr}\) stands for the domestic final demand vector of region \(r\), while \(y^{rs}\) are the vectors of final demand of region \(r\) from region \(s\) (i.e., region \(s\) exports of final goods and services to region \(r\).)
Following Peters (2008), expression 15 can be rewritten for two different industries in two different regions as follows:
where \(x_{j}^{r}\) denotes the output of industry \(j\) in each of the regions \(r\); \(a_{ij}^{rr}\) is an element of the domestic technical coefficients matrix for each region \(r\) and the \(i\) and \(j\) industries; and \(a_{ij}^{sr}\) is the analog measure but involving two different regions s and r. Each of the technical coefficient represents a share of the output of the industry in a region \(r\) or \(s\), bought as an intermediate input by the industry \(j\) in a \(r\) or \(s\) region. The final demand components \(y_{i}^{rr}\) and \(y_{i}^{rs}\) are referred to the domestic final demand of a region \(r\) of \(i\) goods, and the imported final demand of region \(r\) from region \(s\) of \(i\) goods, respectively.
The previous expression can be solved in a multiplicative way using the concept of the inverse matrix of Leontief, where \(L = \left( {I - A} \right)^{ - 1}\) (López et al. 2017). The information provided by \(L\) is the same as in a single region model, that is total (direct and indirect) requirements to supply the production of an additional unit of final demand, but now including domestic and imported requirements. The resulting expression would be:
where \(l\) elements represent the components of the domestic \((l^{rr} )\) or imported \((l^{rs} )\) output multipliers of the Leontief inverse matrix. The output multiplier shows the difference between the initial and the total effect of an exogenous impact in an industry. We can define the total effect as the direct and indirect (those generated in other industries) impact generated in the output of an industry \(j\) to supply a unit increase of the final demand in the industry \(i\) (Miller and Blair 2009).
The participation of Bogota and Colombia in the global value chains, developed in the case study of this paper, is going to be showed on next expression:
where \(v_{j}^{r}\) is value added coefficients vector for each region \(r\) and \(j\) industries, and \({\text{va}}_{1}^{1}\), denotes the value added of industry \(j\) in each of the regions \(r\).