There have been three eras of mass international migration: the forced migration of Africans to the Americas during the mercantilist era, the mass movement of free Europeans to the Americas and Oceania during the laissez-faire industrial era, and the global movement of people from varied origins to diverse destinations during the neoliberal post-industrial era. This chapter forecasts the likely course of migration in the 2020s through a review of the demographic, economic, climatic, and governmental circumstances prevailing across world regions. It foresees an acceleration of migration between developing and developed regions composed increasingly of people moving to evade threats at places of origin rather than to access opportunities at places of destination. The coming decade will require a better theoretical integration of refugee and migration studies, close attention to the tradeoffs between internal and international migration, and a greater effort to theorize how states will behave in adapting to the realities of migration in an era of climate change.
Introduction
The world has witnessed three eras of economic globalization in modern times. The first era ran roughly from 1500 to around 1820 and was grounded in a pre-industrial technology with an agrarian economy and a mercantilist ideology. The second era began around 1820 when the advent of industrialism led to an expansion of international trade and investment under an ideology of laissez-faire capitalism that fueled global economic expansion. The second era of globalization ended abruptly with outbreak of the First World War in 1914 and was definitively curtailed by the imposition of immigration restrictions and tariff barriers in the 1920s and 1930s, ending a century of industrial expansion.
Rather than progressing directly to a new era of economic globalization, the second era was followed by a long interregnum that began with the conclusion of Second World War, when new multilateral institutions were created to resurrect industrial capitalism under a Keynesian ideology that slowly restored international trade and global investment, triggering a new wave of cross-border migration. The third era of globalization began in the 1970s, when the shift from analog to digital technologies created a new, knowledge-based economy grounded in services rather than manufacturing, one that spread globally under a neoliberal ideology.
Anzeige
International Migration in the Mercantile Era
Operating under a philosophy of mercantilism, during the sixteenth and seventeenth centuries, the nation states of Europe applied tariffs and erected trade barriers to minimize imports and maximize exports while projecting their power abroad whenever possible to colonize and exploit large swaths of the Americas, Africa, and Asia (Magnusson, 2015). Relatively small numbers of European settlers migrated to the colonies to establish extractive systems of governance that transferred wealth back to the colonizing powers through royally chartered monopolies. Wealth was created by mining precious metals and by cultivating high-value crops on plantations with large inputs of cheap, unskilled labor. Although the colonizing powers experimented with systems of indentured servitude and penal labor to provide this labor, they ultimately came to rely on the institution of chattel slavery, which entailed a massive, forced transfer of enslaved persons from Africa to the Americas.
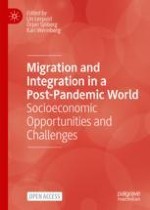
Between 1500 and 1870, some 12 million enslaved Africans were exported as property into the Americas (Klein, 2010). The solid line in Fig. 2.1 shows the number of enslaved migrants exported by year with the scale shown on the left vertical axis (using data from Slave Voyages, 2021). As can be seen, the Atlantic slave trade began modestly in the early 1500s. Through 1696, the number of exports never exceeded 20,000 per year. After 1696, however, the volume of the slave trade expanded rapidly, reaching 84,512 in 1773. Over the ensuing six decades, the outflow fluctuated at relatively high levels, with notable peaks in 1790 (91,127), 1805 (91,677), 1828 (92,253), and 1838 (76,235).
A line graph plots the number of African departures in a single line and the number of European departures in a dashed line over years from 1540 to 1940. The highest peak for African departure is in the year 1805, 91,677. The highest peak for European departure is in the year 1896, 1,874,420.
Fig. 2.1
Enslaved Africans and free Europeans departing their continents of origin from 1540 to 1940 (five-year moving averages). Source: Slave Voyagers (2021), compiled by author
×
After 1838, the number of enslaved migrants exported from Africa dropped in response to political resistance to slavery on both sides of the Atlantic. Although trade in human beings was banned in the British Empire in 1807 and in the United States in 1808, it continued within the Spanish and Portuguese colonies well into the 1860s. Slavery itself was abolished in 1838 by the British, in 1863 by the Dutch, and in 1865 by the United States. Slavery lingered on in the Spanish colonies of Cuba and Puerto Rico until 1886. In 1888, Brazil became the last country to abolish slavery, bringing the mercantilist era to an end (Black, 2021).
International Migration in the Industrial Era
As mercantilism and slavery were dying out over the nineteenth century, a new economic system evolved to generate an even larger outflow of international migrants, this time consisting of free migrants from Europe rather than enslaved persons from Africa. The new economic system was industrialism, which entailed the burning of fossil fuels to power machines staffed by a host of unskilled workers organized to perform specialized tasks under a new division of labor. Its characteristic ideology was laissez-faire capitalism, which eschewed tariffs and trade restrictions in favor of open markets and free international movement. Liberal political philosophers argued that wealth was best created by private individuals and firms relying on the “invisible hand” of the market to allocate capital to its best and highest uses, to match labor supplies to employer demand, and to bring goods and services efficiently to consumers through markets that let competition equilibrate prices (Kanth, 1986).
Anzeige
The industrial revolution began in Britain in the early nineteenth century, spread to Western Europe in the mid-1800s before moving northward into Scandinavia, eastward into Russia, and southward into Mediterranean nations (Massey, 2005). In the mid-nineteenth century industrialization jumped overseas to the United States and Canada, moving later to Argentina and Brazil, before finally arriving in Australia and New Zealand around 1900. As industrialization spread geographically from nation to nation in densely settled Europe, it generated large outflows of peasants and pastoralists from the countryside as communal lands were enclosed, parcels consolidated, and capital-intensive production methods introduced (Massey, 1988).
Rural dwellers leaving the countryside migrated to urban areas to became part of a growing class of unskilled factory and service workers. However, early industrialism was unstable, regularly going through cycles of expansion and contraction. During downturns in Europe, labor markets in cities were unable to fully absorb workers originating in the countryside and the outflows were redirected to rapidly industrializing former colonies in the Americas and Oceania (Thomas, 1973). Overseas destinations like the United States were characterized by relatively low population densities and a chronic scarcity of workers, yielding high wages relative to those in Europe (Hatton & Williamson, 1998).
The resulting wage gap powered recurring cycles of emigration from Europe during the nineteenth and early twentieth centuries (Thomas, 1941). Periods of economic growth in European nations coincided with periods of recession in former colonies, yielding surges of internal migration toward cities during boom times in Europe followed by alternating waves of international migration overseas during recessionary times in Europe (Thomas, 1973). The oscillating outflows grew in number and frequency between 1800 and 1914 (Williamson, 2004a). Although the outflows resumed somewhat in 1919, they never returned to pre-war levels, owing to a widening political reaction against globalization. Seeking to promote national autarky rather than global economic integration, nations imposed restrictive quotas on immigrants, heavy tariffs on imports, and barriers to the mobility of capital (Timmer & Williamson, 1998).
Throughout the nineteenth century and first half of the twentieth, industrialization in Europe and its settler societies in the Americas, Australia, and New Zealand coexisted with holdover colonial institutions associated with the earlier agrarian and mercantilist eras. China existed as a fading agrarian empire dominated by European “concession” enclaves located in port cities such as Hong Kong, Macau, Shanghai, and Tianjin. The rest of Asia and virtually all of Sub-Saharan Africa were carved into extractive colonies ruled by imperial bureaucrats in Britain, France, Belgium, Portugal, and the Netherlands.
Considerable “international” migration occurred within these colonial systems, most notably in the British Empire. From 1842 to 1924, some 1.3 million emigrants departed British India for locations outside of Asia. Meanwhile, in China, European concessions served as ports of embarkation for some 2.9 million Chinese peasants seeking to escape grinding poverty of the countryside between 1871 and 1901 in search of a better life overseas (Ferenczi & Willcox, 1929: 902, 928).
These flows were small, however, compared to those originating from European nations in the throes of industrialization. The only Asian nation to stave off European colonization and industrialize during the late nineteenth and early twentieth centuries was Japan. As in Europe, industrialization in Japan was associated with mass out-migration, with 1.2 million Japanese exiting between 1868 and 1924, first to the United States and Hawaii; subsequent migration was curtailed to Brazil, Peru, Chile, and various European nations (Ferenczi & Willcox, 1929: 934). Our focus here is on the much larger outflows from Europe as industrialization spread across that continent. Figure 2.1 uses data from Palgrave Macmillan (2013) to plot migrant departures from Europe from 1800 to 1940 using five-year moving averages with the scale indicated on the y-axis to the right (see the dashed line).
Over this period more than 71 million emigrants departed Europe for destinations overseas. Around 60% went to the United States, with 10% each going to Canada and Argentina, 7% to Brazil, 3% to Australia, 2% each to New Zealand, Cuba, and Mexico, and 1% to Uruguay. Between1800 and 1891 the volume of emigration from Europe steadily rose, with notable peaks in 1852 (628,180), 1872 (683,580), and 1891 (931,286). After dropping briefly to 741,520 in 1896, it surged to an all-time high of 1.9 million on the eve of First World War before dropping to 331,120 in 1917. Although emigration surged again to 946,160 in 1922, it fell precipitously thereafter, with only 210,200 departures recorded in 1940, the lowest level observed since 1846. The era of mass European emigration was over, never to return.
The Long Interregnum
Industrialism was revived from 1945 to 1975 under a new system of global trade and investment that was constructed on institutional foundations laid in the wake of the Second World War. Rather than laissez faire capitalism, reconstruction of the postwar global economy drew heavily on a Keynesian ideology. As articulated by the British economist John Maynard Keynes, this ideology assigned national governments and international institutions the role of defining and regulating markets, while also providing generous social welfare benefits to mitigate capitalism’s risks and sustain demand during recessions (Eatwell & Milgate, 2011).
Sensing victory over the Axis Powers in 1944, delegates from the Allied nations—including Keynes himself—met in Bretton Woods, New Hampshire, USA, to construct a new institutional framework for global economic growth in the postwar period (Steil, 2013). To ensure international liquidity and the convertibility of currencies, delegates created the International Monetary Fund (IMF); and to provide funds for broad-based economic development around the world, they established the World Bank. In 1945, international delegates met again in San Francisco, California, to establish the United Nations in hopes of forestalling a third world war (Schlesinger, 2003).
In 1948, the United States launched the Marshall Plan, which channeled capital through the World Bank to rebuild the war-torn economies of Europe and Japan, and later to finance economic growth in the developing world (Steil, 2019). Finally, in order to create and manage this new system of global trade and investment, international delegates met in 1947 to create the General Agreement on Tariffs and Trade, a multilateral treaty that established a platform for the gradual reduction of tariffs and other trade barriers. Over eight rounds of negotiations from 1949 to 1994, barriers to international trade were steadily lowered (Narlikar, 2005). The final round of negotiations created the International Trade Organization as a permanent international bureaucracy tasked with enforcing the accepted rules for free trade in goods, commodities, capital, and services.
Although a renewed industrial economy was gradually constructed on these institutional foundations during the 1950s and 1960s, it was not truly global. During this period, a “Cold War” pitted the United States and its allies against the Soviet Union and its allies in an ideological struggle between capitalism and communism. After 1945, the Soviet Union imposed centrally planned economies and authoritarian political systems on nations across Eastern Europe. The communist bloc was further enlarged in 1949 when Mao Zedong founded the People’s Republic of China. Despite the schisms of the Cold War, market relations did expand in regions located away from the Soviet and Chinese spheres of influence.
European imperialism finally came to an end through a process of decolonization that unfolded between 1945 and 1980. Over this period, former European colonies progressively won their independence, increasing the number of United Nations member states from 51 to 150 (UN, 2022). As in the first era of industrial globalization, the postwar reboot entailed a rise in international migration, not only to the traditional destinations in Oceania and the Americas, but also to nations within Europe. This shift partly reflected Europe’s largely completed process of industrialization and urbanization but also stemmed from decolonization, which generated return flows of European colonists as well as new inflows of former colonial subjects (Miège, 1993).
As a result of declining birth rates, rising incomes, and aging populations, Western Europe after 1960 increasingly became a region of labor scarcity. Although refugees and displaced persons emanating from the Second World War initially sufficed to provide needed workers (Gatrell, 2019), as the Cold War deepened and Winston Churchill’s “Iron Curtain” came down, these sources dried up. In response, West European governments adapted by creating guestworker programs (Castles et al., 2014: 104–110). These institutional devices arranged for the entry of workers on temporary visas to work in specific jobs for fixed periods of time at predetermined wages (though durations were often extended and return migration was possible).
Figure 2.2 shows the stock of international migrants defined by place of birth as estimated by the UN Population Division (2022a) from 1950 to 1980 in four key regions of global in-migration: North America (Canada and the United States), South America (Argentina and Brazil), Oceania (Australia and New Zealand), and Western Europe (Belgium, France, Germany, the Netherlands, Sweden, Switzerland, and the United Kingdom). As the graph shows, immigration into Western Europe was flat from 1950 to 1955 as displaced persons and war refugees filled job vacancies. Indeed, the immigrant stock declined slightly from 7.8 million to 7.7 million. Immigration rose from 1955 to 1960, however, as the number of immigrants increased from 7.7 to 8.8 million. Immigration accelerated during the 1960s to reach 14.1 million in 1970, although the increase moderated thereafter. The stock of migrants edged upward from 14.1 to 15.6 million between 1970 and 1975, then from 15.6 million to 16.6 million between 1975 and 1980.
A line graph plots millions of migrants from western Europe, north America, south America, and Oceania over the years from 1950 to 1980. Western Europe and North America have an increasing trend while South America and Oceania have a constant trend.
Fig. 2.2
Stock of international migrants in four world regions, 1950–1980. Source: UN Population Division (2022a), compiled by author
×
The slowing of immigration during the 1970s came in response to the termination of guestworker recruitment during the global economic recession of 1973–1975. However, Europe never returned to an era of low immigration like that which prevailed between 1950 and 1955. Although guestworker migration ended, once the possibility of regular back-and-forth migration disappeared, guestworkers dug in their heels to stay and petitioned for the entry of spouses, children, and other relatives. After 1975, family migration increasingly came to dominate the flow of immigrants into Western Europe (Reichert & Massey, 1982).
Although immigration restrictions implemented in the 1920s were still in place during the 1950s and early 1960s, the immigrant populations of Canada and the United States nonetheless increased steadily throughout the postwar period, rising from 9.5 to 10.9 million between 1950 and 1955 then accelerating to reach 13.6 million in 1960. These increases occurred because immediate relatives of citizens were exempt from numerical limitations and refugees were admitted outside of quotas through special legislation. Nevertheless, immigration slowed in the 1960s, with the immigrant stock rising from 13.6 million to just 15.2 million over the ensuing decade, an increase of only 12%.
Not included in these figures, however, are agricultural guestworkers who entered Canada (Satzewich, 1991) and the United States (Calavita, 1992) on annual work permits, which peaked in the United States at around 450,000 per year in the late 1950s (Massey et al., 2002). As in Europe, when this category of entry was curtailed at the end of 1964, migration simply shifted to another modality, this time undocumented migration, underscoring the interplay between different categories of migrants, in which reductions in one category simply yield increases in another category, and vice versa. Likewise, the dwindling of undocumented migration to the United States between 2008 and 2018 was accompanied by a concomitant increase in guestworker migration (Wassink & Massey, 2022), while the refusal of the Trump administration to accept applications for asylum at ports of entry after 2016 simply turned asylum seekers into unauthorized border crossers, thus spurring a resurgence of undocumented migration in 2018 and 2019 (Massey, 2020).
In the 1960s, both countries liberalized their immigration laws to expand quotas and eliminate restrictions based on race and nationality. As a result, the stock grew to reach 20.2 million in 1980, an increase of 33% since 1970. Although immigration into the immigrant-receiving nations of South America also rebounded during postwar period, the increases were smaller than those in North America and Western Europe. After 1960, this was insufficient to offset losses from mortality and emigration. In Argentina and Brazil, the immigrant stock declined from four to three million between 1960 and 1980. In contrast, the stock of immigrants in Australia and New Zealand steadily grew, rising by an average of 6.5% per year as the foreign population climbed from 1.1 to 3.4 million between 1950 and 1980.
International Migration in the Post-industrial Era
In the immediate postwar period, the recovering international economy remained industrial in nature, with manufacturing constituting not just the core productive activity but also the principal source of wealth and economic growth. The capitalist economy also was not global in scope. With the Soviet Union and China, along with their client states, relying on a system of state socialism to manage centrally planned economies, huge segments of the world’s population and geography lay outside the capitalist system of international trade and investment. The standoff of the Cold War was ultimately broken not by events in the West but by political developments within China and the Soviet Union, which set the stage for the emergence of a truly global economy during the 1990s, one built on post-industrial rather than industrial foundations.
The first political transformation unfolded in China following Chairman Mao’s death in 1976, when his successor Deng Xiaoping led a peaceful transition from a command to a market economy. Chairman Deng progressively used China’s powerful authoritarian state to build an institutional structure within which markets could develop gradually alongside the existing command economy, which was dismantled only after market mechanisms had become fully functional (Qian, 2017). Much of the new economy was constructed by small independent entrepreneurs working from below, who innovated institutional solutions drawing on private social networks of funders, suppliers, and distributors to expand and gradually develop markets that operated separately from the state and its institutions (Nee & Opper, 2012). In this way, markets evolved gradually as path-dependent processes, slowly building a capitalist infrastructure to replace communist-era institutions and practices that were ultimately retired as the markets became functional.
In contrast, the transition from a command to a market economy occurred far more abruptly in the Soviet Union and with little planning. Rather than a strong government acting gradually to build market institutions, the Soviet transition stemmed from the sudden collapse of a weak and ineffective state, thereby foisting radical change on an unprepared cadre of bureaucratic leaders (Åslund, 2014). The stagnant Soviet economy and the Kremlin’s ossified leadership began to lose control as the digital revolution transformed the economic structure of markets in the West and quickened the pace of change throughout the world. As a result, the Soviet Union found itself losing ground in the global arms race and falling behind the West economically.
Mikhail Gorbachev came to power in 1985 intending to reform the Soviet political economy and in so perestroika (restructuring), he authorized state enterprises to pursue foreign trade, sponsored the creation of private banks, and permitted state managers to borrow from the new banks to purchase agencies they headed. Instead of improving economic productivity and efficiency, however, Gorbachev’s reforms encouraged challenges to central authority within the Soviet power structure and enabled discontent to bubble up from below in Warsaw Pact nations (Åslund, 2014).
The Soviet bloc began to crumble in 1989 with the fall of the Berlin Wall, cutting the nations of Eastern Europe free from Russian tethers. In late 1991, the Soviet Union collapsed, releasing its 14 republics from political union with Russia. Rather than unfolding gradually as in China, Russia’s turn toward market economics was achieved by means of “shock therapy.” Early in 1992, the new post-Soviet government under Boris Yeltsin suddenly ended government subsidies, abolished price controls, and authorized the rapid and full privatization of state enterprises, carried out by former apparatchiks using funds borrowed from newly founded banks.
Thus, the dawn of the twenty-first century witnessed a remarkable transformation: the creation of the world’s first truly global market economy. One by one, nations in the Third World gave up their dalliances with socialist economics and joined the World Trade Organization (WTO). China entered in 2001 and Russia followed in 2012. Of the 193 member states in the United Nations, 164 are presently full members of the WTO and another 25 have observer status, comprising 98% of all the nations on earth. This political transformation, however, was accompanied by an even more consequential economic transformation from an industrial to a post-industrial base, a shift hastened by a powerful technological revolution.
Beginning in the mid-1970s, technology began a profound shift away from analog to digital information technologies, creating a global knowledge economy in which economic growth was produced not by economies of scale in the production of goods but by economies of agglomeration in the creation of knowledge within a growing number of “global cities” (Krugman, 1991; Abrahamson, 2004). Digitization increased the pace of social change to bring about a radical reorganization of economic life. Tubes and transistors gave way to silicon chips; land lines led to smart phones; and mechanical adding machines were replaced by hand-held calculators. Warehouses came to house server farms for storing and processing information rather than goods and commodities, while computerized global supply chains enabled rapid, just-in-time, deliveries throughout the world.
As the twentieth century drew to a close, manufacturing shrank as a share of global GDP and the portion devoted to services rose, creating a new political economy dominated by a “creative class” of highly skilled and educated knowledge workers who were supported by a larger class of workers in labor-intensive service occupations (Florida, 2004). In the course of this economic transition, the reigning political ideology shifted from Keynesianism to neoliberalism. In opposition to the precepts championed by Keynes, neoliberal policy prescriptions entailed reducing the state’s role in the economy through government downsizing, privatization, deregulation, tax reductions, as well as the elimination of barriers to international trade and investment (Harvey, 2005). This package of policies came to be labeled the Washington Consensus for its association with neoliberal actors in the US Treasury, the World Bank, and the IMF (Williamson, 2004b).
During the 1980s and 1990s, neoliberal ideology increasingly dominated social and economic policy making in both the developed and developing world, led by economic evangelists in the United States and Britain (Centeno & Cohen, 2012). As in the earlier industrial era, post-industrial global expansion was accompanied by an increase in international migration. The solid line in Fig. 2.3 shows changes in the global stock of international migrants according to the scale indicated on the right vertical axis (data from UN Population Division, 2022a). The trend line reveals a sharp spurt in migration after 1985. Whereas the global migrant stock rose from 82.7 to 104.6 million persons from 1975 to 1985 (just 2.2 million per year), from 1985 to 1990 it rose from 105.6 to 152.3 million (9.5 million per year). Growth then settled down to a steady increase of 2.6 million persons per year through 2005, when the global stock of migrants reached 190.8 million.
A line graph plots trillions of U S dollars per millions of refugees and millions of migrants over the years from 1975 to 2005. The migrants and global G D P have an increasing trend while refugees have a decreasing trend followed by an increase.
Fig. 2.3
International migrants, refugees, and global GDP at the end of history. Source: UN Population Division (2022a), compiled by author
×
The peaceful resolution of the Cold War and the promise of political stability was seemingly confirmed by a drop in the global population of refugees after decades of growth during the Cold War. As shown by the dotted line in Fig. 2.3, after rising from 3.5 million in 1975 to 17.4 million in 1990, the number of refugees plateaued and dropped from 17.8 million in 1992 to 8.7 million by 2005 (using data from the UNHCR, 2022a). Consequently, the turn of the millennium was a heady time for western democracies. Not only had the Cold War ended, but refugee populations were also declining and state socialism had been discredited by the collapse of the USSR and China’s embrace of market economics. Further, goods, capital, information, services, and commodities were freely flowing across borders in ever greater quantities over shorter periods of time (Friedman, 1999, 2007).
US President George H.W. Bush went so far as to declare a “new world order” defined by “new ways of working with other nations [. . .] peaceful settlement of disputes, solidarity against aggression, reduced and controlled arsenals and just treatment of all peoples” (Nye Jr., 1992: 83). Scholars foresaw a peaceful future in which global governance would occur through a dense web of governmental and nongovernmental people and organizations (Slaughter, 2006). The digital age had created “the world’s most prosperous decade” (Stiglitz, 2003), heralding a “new economy” of unlimited growth that would render boom-and-bust cycles of the industrial age a dim memory (Oxford Economics, 2011).
The zeitgeist of the era is best captured by Fukuyama’s (1992) proclamation of “the end of history,” by which he meant the end of the ideological struggles that had characterized human affairs since the dawn of the modern era. For Fukuyama, the collapse of the USSR, China’s turn toward the market, and globalization under the Washington Consensus signaled “not just the end of the Cold War, or the passing of a particular period of postwar history, but the end of history as such: that is, the end point of mankind’s ideological evolution and the universalization of Western liberal democracy as the final form of human government” (Fukuyama, 1989: 4), a bright future made possible by the paring of “modern liberal democracy and technologically driven capitalism” (Fukuyama, 1992: xii).
From Consensus to Conflict
To paraphrase the American writer Mark Twain, reports of history’s demise are greatly exaggerated. The Washington Consensus proved fleeting, ideological conflicts returned, and history resumed its messy, conflict-ridden course. At the core of neoliberal globalism were a set of inherent contradictions that would soon reveal themselves. The most fundamental internal contradiction was that the architects of twenty-first-century globalization somehow believed they could create an integrated global economy that allowed for the relatively free cross-border movement of all factors of production save one: labor.
Relatively free flows of capital were guaranteed by powerful institutional actors such as the IMF, World Bank, and the SWIFT System (Society for Worldwide Interbank Financial Telecommunications), all relying on binding multilateral agreements to keep money flowing. Likewise, the rules guaranteeing free international trade are enforced by the WTO. In contrast, the management of international migration and labor practices are left to weaker institutions, like the International Organization for Migration and the International Labour Organization. These entities are authorized to monitor flows, measure outcomes, and make policy recommendations, but not to make or enforce policies with respect to immigration policies or labor practices, which are left to individual nation states.
Although national political leaders generally welcome capital investments and look favorably on rising volumes of trade in goods and services, they tend to be wary of immigrants. Despite some liberalization of immigration policies since the 1960s, countries throughout the world continue to place restrictions on the number and characteristics of the immigrants they admit. Workers with skills and education bring valuable human capital into countries seeking a competitive edge in the global knowledge-based economy (Florida, 2005). Although governments may regulate the number of entries by high-skilled workers, they nonetheless support visa programs to facilitate the entry of immigrants bearing human capital (Chiswick, 2011). In contrast, given the surfeit of unskilled workers globally, the same countries strictly limit and control entries by manual workers lacking skills and education (Castles et al., 2014: 215–239).
Consequently, the global labor system is highly segmented, offering multiple and often lucrative pathways to temporary and/or permanent migration for those with technical skills and advanced degrees, but limiting unskilled workers to rigid temporary contracts that offer few or no rights as workers or citizens (Donato & Amuedo-Dorantes, 2020). Such is the situation of migrant workers in the authoritarian monarchies of the Persian Gulf (Hanieh, 2010). In liberal democracies, legal immigrants and skilled guestworkers are often supplemented with a clandestine workforce of unauthorized and vulnerable migrants who work in a shadow sector of irregular, informal labor (Donato & Massey, 2016).
A second structural problem missed by observers in the heyday of the roaring nineties was the very unequal distribution of the costs and benefits generated by economic globalization (Lakner & Milanovic, 2013). When the percentage growth in global income is plotted in percentiles across the global income distribution, the top 1% are seen to receive the bulk of the increase in income witnessed since the 1970s. Those located in the 10th to 50th percentile also made significant gains, enough to pull many in the developing world out of poverty. The fewest gains, however, went to persons below the 10th percentile and those lying between the 50th and 90th percentiles, with the latter being composed mainly of middle- and working-class individuals in the developed world (Alvaredo et al., 2018).
Under post-industrial globalization, in other words, the very poorest have largely been locked out of income growth and the greatest gains went to those with the highest incomes, while the poor in emerging economies such as China and India were lifted out of poverty at the expense of the middle and working classes in Europe and North America (Milanovic, 2016). Increases in the economic insecurity of workers during periods of rapid demographic change from immigration are a well-known formula for sparking nativist, xenophobic reactions (Timmer & Williamson, 1998; Meyers, 2004; Massey, 2020), helping to explain the rise of white nationalist movements in Europe, North America, and elsewhere (Geary et al., 2020). The framing of immigrants as a threat is greatly facilitated, of course, if they are “illegal,” since by definition they can then be labeled as criminals and lawbreakers, thus framed as racialized “others” (Menjívar, 2021).
Intergroup tensions are exacerbated by two other unanticipated features of twenty-first-century globalization. First, the optimists of the 1990s failed to realize that globalization was powered by the burning of fossil fuels, which was driving climate change, creating new threats to societal stability. Second, they failed to appreciate the disruptive social and political effects of the internet and social media in a digitized world (Rahman et al., 2017; Zuboff, 2019; Cosentino, 2020). With climate change comes more variable weather conditions that generate extreme weather events that trigger migration in the short term while producing environmental degradations that yield further displacements in the long run (Perch-Nielsen et al., 2008; Kaczan & Orgill-Meyer, 2020). At the same time, the arrival of “environmental refugees” carries considerable potential to heighten nativist sentiments and intergroup conflict within developed nations during a time of rising inequality and growing economic insecurity.
Climate change also potentially increases the pressures and strains on weak, unstable governments in the developing world, raising the odds of state failure and societal disruptions that trigger still more migration. In a digitized world, the potential for xenophobic reaction is multiplied further by political entrepreneurs using bots and algorithms that make clever use of social media to create political firestorms and moral panics about the purported threats of immigrants and their manipulation by liberal “elites” for nefarious ends that are then reported in the mainstream press (Zhuravskaya et al., 2020).
Thus, Fukuyama’s forecast of an end to history was premature, to say the least. The 2010s demonstrate that the signs of chaos are increasingly prevailing over those of consensus. In addition to rising nativism, xenophobia, and white nationalism, the 2010s also witnessed the emergence of populist politics, the spread of autocracy and authoritarianism, a proliferation of failed states, and the increasing capture of governments by criminal elements (Burgis, 2020). The trend line for refugee migration shown in Fig. 2.3 was somewhat misleading in that it relied on the classic formal definition of a refugee as someone fleeing based on a well-founded fear of being persecuted for reasons of race, religion, nationality, social group, or political opinion. This is an outmoded definition dating back to the early years of the Cold War and taking no account of the manifold sources of forced migration today.
In recent years, many new categories of vulnerable migrants have been added to the list of “persons of concern to the UNHCR,” including asylum seekers, internally displaced persons, stateless persons, and many others, including most recently the multitude of migrants desperately fleeing the societal collapse in Venezuela. Figure 2.4 brings these new categories into the picture, updating information since their addition into UNHCR statistics began in 1992. As foreseen at the turn of the millennium, the global stock of international migrants continued to climb after 2005, rising by around 50% to reach 283 million persons worldwide in 2020. From 1965 to 2020, the share of international migrants worldwide rose from 2.3% to 3.6% of the global population. However, the continued decline in the number of refugees that had been expected ceased in 2005.
A line graph plots thousands of refugees and thousands of migrants over the years from 1965 to 2020. International migrants and other persons of concern to the U N High Commissioner for Refugees U N have an increasing trend while refugees-1951 definition have a decreasing trend followed by an increase.
Fig. 2.4
International migrants, refugees, and other persons of concern to the UN High Commissioner for Refugees, 1965–2020. Source: Metrocosm (Galka, 2016), compiled by author
×
From 2005 through 2012, the number of refugees, as defined by the 1951 Convention on the Status of Refugees, fluctuated around 10 million. Even under that narrow definition, the number then doubled to around 20 million persons between 2012 and 2020, where it remained through 2020. However, once the others of concern to the UNHCR are included in the total, we see that the number of forced migrants reached 20 million in 1993; after 2005 this number shot almost straight upward, reaching 93 million in 2020, the largest number ever recorded. The vision of peaceful globalization defined by orderly flows of international migrants seeking opportunities is fading from view, quite literally (see the visualizations of international migrants versus refugees posted online at Metrocosm, Galka, 2016).
Drivers of International Migration
Since the time of Ravenstein (1885), social scientists have sought to develop a theoretical understanding of human migration. By the early 1990s, theoretical models had proliferated across multiple academic disciplines and, in an effort to develop a common conceptual foundation for studying migration, the International Union for the Scientific Study of Population created the Panel on South–North Migration. Its charge was to undertake a comprehensive review of migration theories and research. The panel published several preliminary reports (see Massey et al., 1993, 1994; Taylor et al., 1996a, 1996b) and later summarized its findings in a comprehensive coauthored book (Massey et al., 1998). The book argues that migration theories proposed up to that point were not inherently contradictory. Indeed, the basic tenets and assumptions underlying each model could all be true, with different models carrying more or less explanatory power depending on the contextual vagaries of time and place, a conclusion later validated by Garip (2016).
In its review of empirical research, the panel consistently found a positive relationship between wage differentials and the rate or volume of international migration, as predicted by Neoclassical Economics (Todaro, 1969) and Human Capital Theory (Sjaastad, 1962). It also found strong evidence that, apart from higher wages, migration could also be motivated by a desire to manage risks to wellbeing by diversifying household labor portfolios, as predicted by the New Economics of Labor Migration (Stark, 1991). The panel likewise concluded that structurally divided labor markets in developed nations created a persistent demand for immigrant workers, as predicted by Segmented Labor Market Theory (Piore, 1979; Portes & Manning, 1986). In developing nations, meanwhile, structural transformations associated with economic development displaced workers from traditional livelihoods to create mobilized populations prone to migrating in search of alternative means of support, as predicted by World Systems Theory (Sassen, 1988).
The foregoing theoretical models offer explanations for how and why migration is initiated, but no matter how migratory flows originate, they tend to persist and expand over space and time via various self-feeding mechanisms, the most important of which is the accumulation of social capital through the extension of migrant networks, as predicted by Social Capital Theory and the Theory of Cumulative Causation (Massey, 1990). Finally, although population growth does not directly drive migration (see Zlotnik, 2004), it is nevertheless important in assessing migratory potential because it shapes a population’s size and age structure (Preston & Coale, 1982). Size determines the number of people at risk of migration and, hence, the number of possible migrants, while migration itself is inherently age-dependent, concentrated in the young labor force, aged 18 to 30, and especially among men (Rogers & Castro, 1981). Further, the initial migration of working-age males often triggers later outflows by spouses, children, and other dependents, for purposes of both work and family reunification.
Another problem is that most of the theories of migration developed so far theorize it as a voluntary decision undertaken to increase individual or family wellbeing. Regardless, history is replete with examples of forced migration: movements triggered not by attractions at points of destination but by threats at places of origin (see Becker, 2022). However, as Becker and Ferrara (2019: 2) point out, “it is important to note that the distinction between voluntary and forced migration is by no means a binary one.” Indeed, “the two extremes of completely voluntary and forced migration mark two ends of a spectrum, where the former typically ignores physical threats, and the latter considers force the determining factor” (Becker & Ferrara, 2019: 13). The impact of both forced and voluntary migrants on sending and receiving societies depends, of course, on rates of return migration, which are generally lower for forced migrants, but with considerable variance across specific historical cases (Becker, 2022).
Building on earlier work by Massey et al. (1998) and Carling (2002) as well as drawing on concepts articulated by Berlin (1969) and Sen (1999), de Haas (2021: 25) offers a consolidated model that incorporates both threats and attractions into migration decision-making. He sees migration decisions as occurring within a dynamic, multilevel context in which people observe positive and negative features of the structural circumstances prevailing at places of origin in comparison to the plusses and minuses of opportunity structures at places of destination. Then, considering their own aspirations and capabilities (which may be endogenously shaped by the origin context), rational actors decide whether to leave or stay.
The migration decision then feeds back to influence each actor’s future capacities and aspirations; subsequently, when combined with the individual migration decisions taken by many others, the structural circumstances at the places of origin and destination are also altered. The negative features of the origin context that de Haas (2021: 24) specifically mentions include “obstacles, barriers, or constraints […] on people’s freedom or even […] outright threat[s] to people’s lives, for instance through regulation, oppression, violence, or war.” To this list of maladies, one must add threats linked to global climate change: extreme weather events, wildfires, floods, famines, and environmental degradation.
To assess the potential for international migration in the coming decades, this chapter undertakes a region-by-region survey of factors deemed by extant theories to predict emigration and immigration. The factors considered fall under four broad rubrics—demographics, economics, climate, and governance—and the regions examined are categorized by level of development. The specific developing and developed nations included in each region are listed alphabetically in Appendix A (Tables 2.5 and 2.6). Regional classifications generally follow those used by the United Nations Sustainable Development Programme, with several notable departures. For example, the oil-rich nations of the Gulf Cooperation Council are extracted from the rest of West Asia and placed into a separate category within the developed world. Likewise, Australia and New Zealand are categorized separately from other nations in Oceania which are considered under the heading South Pacific (though some of the smaller island nations located there as well as in the Caribbean are excluded for lack of data).
East Asia is here classified as a developed region anchored by China, given the size of its economy and its rapid ascent into the ranks of middle-income countries. In addition to China proper, the region also contains Hong Kong, Macau, Taiwan, South Korea, and Japan, all clearly developed entities. Although North Korea and Mongolia are clearly not developed, they are nonetheless included in the region. Owing to their small size, their presence has no significant effect on the value of regional averages, which are computed by weighting each country’s contribution according to its population size.
Demographic Indicators
Table 2.1 begins the analysis by offering a demographic profile of the world’s principal regions circa 2019 using data from the UN Population Division (2022b). Although, as noted above, population growth does not have a direct effect on international migration, it strongly influences migratory potential through its effect on population size. Column (1) considers the total number of inhabitants in each region and uses boldface to highlight those with populations at or above the global average (shown at the bottom of the table), thus signaling an elevated demographic potential for out-migration under the right social and economic circumstances.
Table 2.1
Demographic characteristics of selected world regions circa 2019
(1)
(2)
(3)
(4)
(5)
(6)
Region
Population (Millions)
Total Fertility Rate
Growth Rate
Median Age
Child Dependency Ratio
Elder Dependency Ratio
Developing world
Sub-Saharan Africa
1093
4.8
2.7
18.8
121.4
6.7
North Africa
245
3.3
1.9
25.7
78.9
10.8
West Asia
221
2.8
1.6
27.2
72.7
11.8
Central Asia
74
2.7
1.6
27.6
66.9
9.4
South Asia
1940
2.4
1.2
27.7
64.8
10.7
Southeast Asia
669
2.2
1.1
30.5
56.7
11.8
Caribbean
39
2.3
0.7
31.6
58.5
16.3
Central America
180
2.2
1.2
28.2
63.5
12.7
South America
431
1.9
0.9
32.1
51.2
15.9
South Pacific
11
3.5
1.9
22.9
88.0
7.7
Developed world
Australia–New Zealand
30
1.8
1.2
37.9
43.3
27.8
East Asia
1654
1.7
0.4
39.3
35.7
21.2
Gulf Coop. Council
59
2.2
2.0
32.2
40.2
4.3
Eastern Europe
293
1.7
−0.1
40.7
35.4
27.4
Northern Europe
106
1.7
0.5
40.8
39.6
32.7
Southern Europe
152
1.3
−0.1
45.4
31.4
35.9
Western Europe
196
1.7
0.4
43.9
36.2
35.9
North America
369
1.8
0.7
38.6
41.5
28.5
Global Average
431
2.3
1.1
32.8
57.0
18.2
Source: UN Population Division (2022b), compiled by author
Note: bold figures indicate elevated propensities for emigration (or immigration in the case of the elder dependency ratio)
The standout regions in the developing world are South Asia (with 1.9 billion inhabitants) and Sub-Saharan Africa (1.1 billion), followed by Southeast Asia (669 million) and South America (431 million). Both South Asia and Southeast Asia are dominated by a few very large countries. In the former case, the nations are India (1.3 billion), Pakistan (199 million), and Bangladesh (146 million). In the latter case, they are Indonesia (258 million), the Philippines (102 million), and Vietnam (93 million). In contrast, Sub-Saharan Africa includes 47 different countries, the largest of which is Nigeria at 181 million. South America contains 12 nations, with Brazil being the largest at 204 million. In the developed world, the largest population is found in East Asia (1.7 billion), which is dominated by China (1.4 billion), followed at a distance by Japan (128 million), South Korea (51 million), with North Korea and Mongolia trailing far behind with just 25 million and 3 million inhabitants, respectively.
The next two columns in Table 2.1 present regional averages for the total fertility rate (TFR) and the population growth rate. Given their large size, India and China naturally carry great weight in computing the regional averages for South and East Asia, respectively. In general, the higher a region’s TFR, the greater is its expected growth rate, as births are generally the most important contributor to the rate of natural increase. Indeed, the correlation between fertility and growth rates across nations in 2019 was 0.875. TFR values above the global average of 2.3 children per woman are in bold, as they have growth rates above the global average growth rate of 1.1%, indicating regions of high fertility and rapid population growth.
Sub-Saharan Africa is clearly the world’s most fecund and rapidly growing region with a TFR of 4.8 and a growth rate of 2.7% per year. This rate translates into a population doubling time of 26 years; a demographic forecast indicates that in 2100 the region’s population will be 3.1 billion and still not have peaked (see Vollset et al., 2020). In terms of growth potential, Sub-Saharan Africa is followed by Oceania, with 3.5 children per woman and a growth rate of 1.9% per year. The latter figure implies a doubling time of 37 years and a population forecast of 34 million and still growing in 2100. Next comes North Africa, where the respective values are 3.3 and also 1.9%, yielding a projected population of 2.1 billion in 2090 (Vollset et al., 2020).
With respective TFRs of 2.8 and 2.7, West Asia and Central Asia share a growth rate of 1.6% and a doubling time of 44 years and are forecast to continue growing through most of the century before peaking in 2077 and 2091, respectively. Elevated fertility and growth rates are also observed in South and Southeast Asia, with growth rates of 1.2 and 1.1%, respectively, with both regions expected to peak in the mid-twenty-first century. India’s population is forecast to peak at 1.6 billion in 2048, surpassing China’s peak population of 1.41 billion forecast to be reached in 2024 (Vollset et al., 2020). Although the Caribbean region displays an above-average TFR of 2.3 children per woman, its growth rate is only 0.7% owing to emigration from small island nations. Nevertheless, it is forecast to peak at 50.3 million in 2040. Australia–New Zealand conversely displays an above-average growth rate but a below-replacement TFR of just 1.8, reflecting the effect of immigration, yielding a peak population of 40.4 million persons around the year 2095 (Vollset et al., 2020).
Fertility and population growth also influence migration by determining a population’s age structure. As birth rates fall and growth declines, population aging occurs and the median age rises, as seen in the fourth column of Table 2.1 (which displays a correlation of −0.891 with both the TFR and the growth rate). Age is important because migration is dominated by people aged 18 to 30, most of whom are moving for work or who are socially connected to a migrant worker (Rogers & Castro, 1981). The rate of out-migration for labor rises sharply in the late teens, peaks at age 22 or 23, and then declines rapidly by age 30 and remains low thereafter.
In Column (4), median ages below the global average of 32.8 are bolded to indicate regions where the age distribution is exceptionally favorable to out-migration. All developing world regions have median ages below this threshold, indicating a strong potential for migration. That potential is greatest in Sub-Saharan Africa (with a median age of 18.8), followed by Oceania (22.9) and North Africa (25.7). Next comes West Asia, Central Asia, South Asia, and Central America (with median ages in the range of 27–28), followed by Southeast Asia, the Caribbean, and South American (age range of 30–32). All developed regions display median ages above the global average, with the sole exception of the Gulf Cooperation Council, which has a median age of 32.2, just below the threshold of 32.8.
Age composition is important for migration not only because of its effect on median age but also because of its effects on the degree of dependency in the population as a whole, here indexed by the child dependency ratio (P0–14/P15–64*100) and the elder dependency ratio (P65+/P15–64*100). These ratios provide information about the likely motives for migration and the direction of the resulting flows (inward or outward). A high child dependency ratio, for example, indicates a burden on workers who must provide for young children too young to work, whereas a high elder dependency ratio signals a burden on workers to provide for older persons who have retired from the labor force. Thus, a high child dependency ratio incentivizes out-migration whereas a high elder dependency ratio incentivizes in-migration.
Bearing these points in mind, Columns (5) and (6) highlight ratios above the respective global averages for child and elder dependency to reveal a complementary pattern. All developed regions display child dependency ratios below the global average. Conversely, with just two exceptions (Southeast Asia and South America), all developing regions have child dependency ratios below the average, indicating strong demographic incentives for out-migration. The incentives for out-migration are by far the greatest in Sub-Saharan Africa (with a child dependency ratio of 121.4), followed by Oceania (88.0), North Africa (78.9), and West Asia (72.7). Next in descending order are Central Asia (66.9), South Asia (64.8), Central America (63.5), and the Caribbean (58.5).
In contrast, all developing regions have elder dependency ratios below the global average and, with one exception, all developed regions have elder ratios above the average, suggesting strong incentives for in-migration. The one outlier is the Gulf Cooperation Council, which essentially controls its own dependency ratio by specifying the number of guestworkers it recruits into the population at any point in time. Elsewhere in the developed world, the elder dependency ratios favor in-migration, especially in Southern and Western Europe where both elder dependency ratios are 35.9, followed by Northern Europe at 32.7 and Eastern Europe at 27.4. In North America and Australia–New Zealand the respective ratios are 28.5 and 27.8.
In East Asia, the elder dependency ratio is only 21.2, a low value that reflects the great weight assigned to China in computing the regional average. In China, the elder ratio is just 18.5 (barely above the global average) and much closer to those that prevail in the developing world. Given its size, China’s exceptionally low level of dependency effectively counterbalances Japan’s truly extreme elder dependency ratio of 52.0, by far the world’s highest (the ratio is 23.6 in South Korea but only 14.7 in North Korea). However, owing to China’s one-child policy, which prevailed from 1980 through 2016, it is about to enter a period of rapid population aging (Feng et al., 2012) after reaching a peak population as early as 2024 (Vollset et al., 2020).
Economic Indicators
Table 2.2 draws on data from the World Bank (2022) to present key economic indicators by region and level of economic development. The first column shows regional averages of GDP per capita in current US dollars (USD) adjusted for purchasing power parity, with values below the global average highlighted in boldface. A quick glance reveals that all regions in the developing world have per-capita GDPs below this threshold and that all developed regions, save one, have per-capita GDPs above it. East Asia is again the one exception, thus reflecting China’s low per-capita GDP of USD 16,847, attributable to the recency of its development. However, in China’s special economic zones of Hong Kong and Macao, the respective GDPs per capita are USD 62,567 and USD 129,428, followed by values of USD 48,638 in Taiwan, USD 42,338 in Japan, and USD 42,728 in South Korea. The comparable averages for Mongolia and North Korea are just USD 12,838 and USD 1700, but they have little influence on the population-weighted regional average.
Table 2.2
Indicators of economic conditions in selected world regions circa 2019
Note: bolded figures indicate elevated propensities for emigration
China notwithstanding, GDPs per capita in all developed regions exceed those in all developing regions, indicating pervasive and strong material incentives for international migration from the developing to the developed world for purposes of either income maximization or risk diversification. The gap in GDP per capita ranges from USD 1766 (between Central America and East Asia) to USD 59,752 (between Sub-Saharan Africa and North America). Taking geographic proximity into account, we see that the potential gains from international migration are quite large within certain migration corridors. In the Western Hemisphere, for example, moves to North America from Central America, South America, and the Caribbean yield potential gains of USD 45,929, 48,405, and 51,492, respectively. In the Afro-European corridor, moves to Western Europe from North Africa and Sub-Saharan Africa yield potential gains of USD 44,748 and 50,918, respectively. Likewise, in the South Pacific corridor moves to Australia–New Zealand from Oceania, South Asia, and Southeast Asia yield gains of USD 45,188, 44,299, and 38,267, respectively.
Earnings only matter if jobs are available, of course, and the second column in Table 2.2 presents regional employment-to-population ratios (Employed Persons/Population ≥ 15*100), with E/P values below the global average once again highlighted boldface. In general, jobs are relatively scarce in the developing world, where six of the ten regions have E/P ratios below the global average. The lowest ratios are observed in North Africa, West Asia, and South Asia, with respective ratios of 37.9, 40.9, and 44.7, followed by Oceania at 48.9 and South America at 52.6. The only developed region with an E/P ratio below the global average is Southern Europe with a value of 46.2.
Perhaps more important than the value of the E/P ratio itself is its change over time: the third column shows changes in the ratio between 2015 and 2019. With respect to this measure, Southern Europe is again an outlier, but in the opposite direction. Although it may have had the lowest E/P of any region in the developed world, with a value of 3.4, it displays the greatest increase in the E/P ratio observed in the table. The most notable finding, however, is the preponderance of negative E/P change scores in the developing world. Across its ten regions, eight have negative E/P change scores, meaning that job growth is not keeping up with population growth.
The degree of change in the negative direction is greatest in Central Asia and South America, both with scores of −1.3, followed by North Africa and South Asia with a common change score of −0.7, and then by Sub-Saharan Africa (−0.4), West Asia and Oceania (both −0.2), and finally Southeast Asia (−0.1). In contrast, only two nations in the developed world show negative E/P change scores: the Gulf Cooperation Council (−0.4) and East Asia (−1.2). As already noted, E/P ratios are under the direct control of GCC governments through their labor recruitment polices. The negative change score in East Asia likely reflects the slowing of economic growth owing to the aging of workers in China and Japan.
The final economic index we consider is the rate of inflation, which captures the rapidity with which a currency devalues over time. It is presented in Column (4), with values above the global average of 3.3% highlighted in bold. High rates of currency devaluation create havoc in any economy, making sound financial planning difficult and decisions about investment and spending precarious, creating incentives for migration to regions where wages are likely to hold their value over time.
Where only one developed region displays an inflation rate above the global average (Eastern Europe at 4.5%), seven developing regions exceed this threshold. Currency inflation is greatest in North Africa, where the rate of 13.6% means that every 5.4 years consumers need two times more currency units to maintain the real value of their incomes. It is followed by Sub-Saharan Africa with a rate of 11.0%, yielding a value half-life of 6.6 years. Next in descending order are West Asia and Central Asia with respective rates of 9.8% and 9.7%, indicating half-lives of around 7.5 years. Although not as dire as the aforementioned examples, the rates of 7.3 and 6.2 in the Caribbean and South Asia are also quite high, yielding value half-lives in the range of 10–12 years.
Climate indicators
The first three columns in Table 2.3 draw on climate indicators developed by researchers associated with the Notre Dame Global Adaptation Initiative (ND-GAIN, 2022). Column (1) shows regional values for an index assessing a region’s vulnerability to climate change in six life-supporting sectors: food, water, health, ecosystems, habitat, and infrastructure. Each sector is represented by six indicators capturing the degree of exposure to climate-related hazards, its sensitivity to the effects of those hazards, and its capacity to cope with those effects (Chen et al., 2015). Across nations, the vulnerability index varies from a minimum of 24.9 to a high of 67.7, with a global average of 39.2. The indices in bold indicate that all ten developing regions display above average climate vulnerability, whereas no developed nation’s ratio exceeds it.
Table 2.3
Climate change and governance indicators, selected world regions circa 2019
Note: bolded figures indicate elevated propensities for emigration
Column (2) shows regional values for an index of climate change readiness constructed to assess a nation’s readiness to make effective use of investments in three domains to adapt to the challenges of global climate change. Economic readiness assesses the degree to which local economic conditions are able to facilitate private sector investments to mitigate. Government readiness considers a nation’s institutional capacity to provide high-quality, reliable public services. Social readiness assesses the degree to which societal arrangements are capable of sustaining efficient and equitable investments (Chen et al., 2015). Across nations, the readiness index varies from 14.0 to 80.5, with a global average of 46.4. As the bolded indices again reveal, all developing world regions have readiness indices below this average, but all developed nations exceed it.
Column (3) shows values of an adaptability index created to assess the balance between the climate threats facing a region and the resources available to mitigate them. The index is computed by subtracting the vulnerability index from the readiness index and then rescaling the resulting values from 0 to 100. In the table, adaptability scores below the global average of 53.4 are in bold, revealing that all developing regions have scores below this threshold while all those in developed regions are above it. While regional indices range from 56.5 to 70.1 in the developed world, in the developing world they range from 37.8 to 51.5.
The lack of any overlap between developing and developed regions means that migration from the developing to the developed world in response to climate change necessarily yields an increase in adaptability, no matter which developing region or which developed destination one considers. Potential increases in the adaptability index range from 5.0 to 32.3 points. Once again taking global geography into account, we see that migration to North America from Central America, South America, and the Caribbean yield respective increase in the climate adaptability index of 19.9, 19.0, and 23.7 points. Likewise, migration to Western Europe from North Africa and Sub-Saharan Africa yield respective gains of 24.9 and 31.7. In the South Pacific, movement to Australia–New Zealand from elsewhere in the South Pacific, Southeast Asia, or South Asia produces respective gains of 30.7, 23.6, and 28.1 points.
Governance Indicators
The final four columns in Table 2.3 address different facets of a region’s capacity to govern effectively and stably. Column (4) presents regional averages for the Fragile States Index, as created by the Fund for Peace (2020). It draws on three sources of information to develop separate indicators of fragility owing to societal divisions, poor economic performance, political instability, and social disequilibrium. The three data sources include content analyses of media articles and research reports collected from over 10,000 different English-language sources around the world, quantitative datasets prepared by international and multilateral statistical agencies, as well as qualitative reviews of the state of affairs within each country by a team of social scientists. These data sources are used to generate multiple quantitative indicators along 12 different dimensions of state instability: security threats, elite factionalization, group grievances, economic decline, uneven development, human flight/brain drain, state legitimacy, quality of public services, human rights/rule of law, demographic pressures, the presence of refugees and displaced persons, and external interventions (for details see Fund for Peace, 2022).
The resulting composite indices were averaged by region to derive the fragile state measures reported in Column (4). Empirically, across countries, the fragile states index ranges from 16.9 to 113.5 with an average of 63.0. The values in bold in the third column highlight that all developing regions display index values above this threshold, whereas only two developed regions do so. Nevertheless, all developed regions display fragility indices below any of those in the developing world, with the differential ranging from 1.2 points (between East Asia and South America) to 72.4 points (between Sub-Saharan Africa and Australia–New Zealand). Once again taking geography into account, we note the large gains in state stability to be had by moving to North America from Central America, South America, and the Caribbean (34.1 points, 32.4 points, and 36.5 points, respectively), as well as to Western Europe from North Africa, Sub-Saharan Africa, and Central Asia (59.4 points, 65.1 points, and 62.5 points) and to Australia–New Zealand from the South Pacific, Southeast Asia, and South Asia (57.0 points, 53.9 points, and 59.3 points).
Column (5) continues the analysis by presenting regional averages for a Rule of Law Index developed by the World Justice Project (2022). This index is based on multiple indicators compiled in eight separate categories: constraints on government powers, degree of corruption, openness of government, respect for fundamental rights, degree of order and security, capacity for regulatory enforcement, and degree of access to civil and criminal justice. Scores and rankings in the eight categories and 44 sub-categories draw on two sources of data: a general population survey conducted on a representative sample of 1000 respondents in each country plus a targeted survey of in-country legal practitioners, experts, and academics with expertise in different sectors of the law—commercial, constitutional, civil, criminal, labor, and public health (World Justice Project, 2021).
The resulting index rates the rule of law on a scale ranging from 28 to 90 with an average value of 55.6. In the table, values below this average are highlighted to indicate low access to the rule of law. Apart from in Australia and New Zealand, the World Justice Project collected no other data in Oceania, so an index for the South Pacific is unavailable. Among the remaining regions, measures of the rule of law in the developing and developed worlds overlap to a considerable degree. Index values range from 44.2 to 64.0 across developing regions and from 49.7 to 81.1 across developed regions. As a result of this overlap, not all moves between developing and developed regions yield increases in the rule of law. Nevertheless, taking geography into account the improvements are quite large in some migration corridors. A move to North America from Central America, South America, and the Caribbean, for example, yields respective rule-of-law gains of 28.4 points, 27.3 points, and 23.3. Similarly, a move to Western Europe from North Africa, Sub-Saharan Africa, or Central Asia would yield potential gains of 35.2, 35.9, and 16.1 points, respectively.
The next facet of governance addressed in Table 2.3 is the degree of respect for human rights, as measured by an index developed by Freedom House (2022). The index, presented in Column (6), is based on data assembled and evaluated by a panel of external analysts, expert advisers, and regional specialists who relied on “a combination of on-the-ground research, consultations with local contacts, and information from news articles, nongovernmental organizations, governments, and a variety of other sources” to generate a consensus index for each country (Repucci & Slipowitz, 2022). The index ranges from a score of 0 (Yemen) to 100 (Finland, Norway, and Sweden) with a global average of 55.9.
Index values below this threshold are highlighted to indicate regions characterized by notably weak protections for human rights, yielding bolded indices in six of the ten developing regions and three of the eight developed regions. In the former region, the index is remarkably low in Central Asia (14.2), North Africa (25.9), and West Africa (28.6), and somewhat higher but still below average in Sub-Saharan Africa (42.2), the Caribbean (46.1), and Southeast Asia (47.8). In the developed world, index values are similarly very low in the Gulf Cooperation Council (13.2) and East Asia (20.0) and only a bit higher in Eastern Europe (45.7).
In the developing world, respect for human rights is greatest in South America (71.2), Oceania (65.8), South Asia (62.8), and Central America (61.4). In the developed world, the human rights index is very high in Australia–New Zealand (98.0), Northern Europe (94.7), and Western Europe (93.3), and only slightly lower in Southern Europe (87.9) and North America (87.3). Given the substantial overlap in the range of index values across developing and developed regions, once again not all moves between the regions would bring an improvement in respect for human rights.
Nonetheless, migration within salient regional corridors potentially yields sizeable gains in the human rights index. Thus, migration into North America from Central America, South America, and the Caribbean generate respective gains of 25.9 points, 16.1 points, and 42.2 points, while movement into Western Europe from North Africa, Sub-Saharan Africa, and Central Asia would yield gains of 67.4 points, 51.1 points, and 64.7 points, respectively. Likewise, movement into Australia–New Zealand from the South Pacific, Southeast Asia, and South Asia would bring gains of 32.2 points, 50.2 points, and 35.2 points, respectively.
The final column in Table 2.3 assesses exposure to violence by presenting homicide rates per 100,000 population, as tabulated by the UN Office on Drugs and Crime (UNODC, 2022). Rates above the regional average are highlighted in bold, revealing three distinct regions of elevated lethal violence: Latin America, Sub-Saharan Africa, and the Caribbean. Central America is by far the most lethal region with a homicide rate of 28.0 homicides per 100,000 population, followed by South America with a rate of 21.0 per 100,000, Sub-Saharan Africa (15.3 per 100,000), and, lastly, Oceania (8.2 per 100,000).
In the rest of the developing world, no rate exceeds 4.2 per 100,000 and in the developed world the highest observed rate is 5.5 per 100,000, with the lowest being 0.6 per 100,000 in East Asia. Again, the degree of overlap in the range of homicide rates in the developing and developed worlds means that not all moves between the two regions would yield a sharp decline in the risk of homicide. The greatest potential reduction in lethal violence comes from migration into North America from regions elsewhere in the Americas. Moving northward from Central America entails a decline of 23.4 points in the rate of homicide, and migration from South America and the Caribbean to North America reduce the murder rate by 16.3 and 6.6 points, respectively. Rising violence can also trigger changes in other drivers of migration, as illustrated by global rise in inflation induced by Russia’s invasion of Ukraine in 2022.
The Present and the Future of International Migration
Table 2.4 offers a schematic summary of the regional propensities toward emigration in the world today. It arrays risk factors predicting greater out-migration in columns delineated across the top, with regions listed in rows down the side in descending order of migration risk. An X is placed in each cell whenever the corresponding indicator was highlighted in Tables 2.1, 2.2, and 2.3. The number of X values given to each region is totaled in the final column to the right. Very clearly, the pressures for out-migration are greatest in Sub-Saharan Africa, which contains an X in each of the 11 possible risk cells. The proliferation of risk factors is especially meaningful in this region given its population of nearly 1.1 billion and the fact that it is projected to reach 3.1 billion by the year 2100.
Table 2.4
Assessment of potential for out-migration from selected world regions
Region
Large Population
Low Median Age
High Child Dependency Ratio
Low GDP per Capita
Declining E/P Ratio
High Inflation Rate
Low Climate Adaptability
High State Fragility
Low Rule of Law
Weak Human Rights
High Homicide Rate
No. of Risk Factors
Sub-Saharan Africa
X
X
X
X
X
X
X
X
X
X
X
11
South Asia
X
X
X
X
X
X
X
X
X
9
North Africa
X
X
X
X
X
X
X
X
X
9
Central Asia
X
X
X
X
X
X
X
X
X
9
Caribbean
X
X
X
X
X
X
X
X
X
9
Southeast Asia
X
X
X
X
X
X
X
X
8
West Asia
X
X
X
X
X
X
X
X
8
South America
X
X
X
X
X
X
X
X
8
Central America
X
X
X
X
X
X
X
X
8
South Pacific
X
X
X
X
X
X
X
7
East Asia
X
X
X
X
X
X
6
Eastern Europe
X
X
X
X
4
Gulf Coop. Council
X
X
2
Australia–New Zealand
X
1
Northern Europe
0
Southern Europe
0
Western Europe
0
North America
0
Source: schematic summary of data assembled in Tables 2.1, 2.2 and 2.3, compiled by author
Next on the list is South Asia, with a total of nine risk factors. Although North Africa, Central Asia, and the Caribbean also exhibit the same number of risk factors, with a population of 1.9 billion, South Asia clearly has the greatest potential for out-migration after Sub-Saharan Africa, followed by North Africa (245 million), Central Asia (74 million), and the Caribbean (39 million). Combining the populations of North and Sub-Saharan Africa, the current population of 1.3 billion (and its projected population of 3.5 billion in 2100) underscores the importance of the African continent as a potential source of international migrants. Moreover, given the realities of global geography and the legacy of European colonialism, the migratory potential of Africa suggests a very high likelihood of future migration to Western Europe, most notably to Britain, France, and Belgium. Given Britain’s widespread colonial occupation of South Asia, out-migration from that region is likely, not only to the United Kingdom but also to other English-speaking countries.
Next in descending order of potential for emigration are Southeast Asia, West Asia, South America, and the Caribbean, each logging eight risk factors, but with quite different populations of 660 million, 221 million, 431 million, and 180 million, respectively. Given the legacies of colonialism in the region, emigration from Southeast Asia is likely to be directed toward France, Portugal, the Netherlands, the United States, and Indonesia. West Asia, which contains countries of established emigration, such as Turkey, and several important sources of refugees and asylum seekers, including Iraq, Jordan, Lebanon, Palestine, Syria, and Yemen, would seem to forecast movement to Western Europe and North America given the region’s former colonial ties and the history of US military intervention in the region.
Further down on the list, with seven risk factors, is the South Pacific, suggesting the potential for significant migration to Australia–New Zealand mitigated only by its small population (just 11 million in 2019 projected to reach 34.2 million in 2100). East Asia displays six risk factors, beginning with large population size but also low GDP per capita, a declining E/P ratio, elevated state fragility, low rule of law, and weak human rights. Here the wellbeing of China is paramount. As noted earlier, China has a long history of global diaspora and a recent history of rising economic penetration throughout the world. At this point, China does not send out migrants proportionate to its great size and its emigrants are found in diverse destinations throughout the world. In addition to population, the potential for Chinese emigration reflects the risks of having a strong but brittle government characterized by a limited rule of law and weak human rights.
Finally, we come to Eastern Europe, which is characterized by high inflation, high state fragility, limited rule of law, and weak human rights, which together encapsulate the risks of its post-Cold War autocratic governance. The lecture upon which this chapter is based was delivered in December of 2021. By the time of its writing in March of 2022, however, two Eastern European nations were at war following the Russian invasion of Ukraine with assistance from Belarus, displacing millions of refugees into Western, Southern, and Northern Europe, underscoring the intrinsic potential for dictatorial powers to intervene in other nations in ways that displace people from otherwise peaceful lives. The spread of autocracy aggravates the risk of migration. When power is concentrated in the hands of one person with few checks and balances, failures of judgment can easily result in actions that produce sizeable waves of out-migration, as seen in the cases of Ukraine and Venezuela.
The remaining regions listed in the table would seem to have a low likelihood of large-scale emigration. The most vulnerable, according to the last column, is the Gulf Cooperation Council, which displays a declining E/P ratio and a low rule of law. As already noted, the former is under the control of GCC governments through their guestworker policies. Again, the greatest risk of emigration stems for the side effects of autocratic governance. Since 2015, Saudi Arabia has sponsored a military intervention in Yemen that, according to the latest data from the UN High Commissioner for Refugees, has produced 3.7 million refugees. The remaining regions listed in the table (Australia-New Zealand, Northern Europe, Southern Europe, Western Europe, and North America) constitute the most likely destinations for migrants.
Figure 2.5 turns from the hypothetical to the real to examine the actual volume of migration from countries in the regions under study, drawing on data from the UN Population Division (2022a) to capture net changes in the number of international migrants from 2015 to 2019. The light gray bars indicate the net outflow of international migrants from countries by region of origin. Consistent with the conclusions derived from Table 2.4, we see that Sub-Saharan Africa is the largest contributor to the global stock of international migrants. The number of migrants originating in a Sub-Saharan African nation but living in a different country at the time of enumeration grew by around 3.6 million persons, followed by South Asia at 3.3 million, West Asia at 3.2 million, South America at 2.6 million, and Southeast Asia at 2.1 million.
A grouped bar graph of millions of migrants over different countries by origin and by destination. The highest bar, by origin, is western Europe, 4.343, and by destination is south Asia, 3.325.
Fig. 2.5
Net change in number of international migrants by world region, 2015–2019. Source: UN Population Division (2022a), compiled by author
×
No single developed region contributes as many migrants to the global stock of immigrants as any one of these four developing regions. The net change in the number of international out-migrants originating in developed regions was greatest for Eastern Europe (1.8 million), followed by Southern Europe (1.5 million), East Asia (816,000), Western Europe (644,000), Northern Europe (464,000), North America (221,000), Australia–New Zealand (89,000), and the Gulf Cooperation Council (79,000). The net contributions of other developing regions to the stock of international migrants are also quite modest. After South Asia, the next closest region is North Africa, with a gain of 885,000 migrants, followed by the Caribbean (498,000), South America (175,000), Central Asia (136,000), and the South Pacific (42,000).
The dark gray bars show changes in the net inflow of international migrants by region of destination. Unsurprisingly, the largest inflows are recorded by nations in Western Europe (4.3 million), the Gulf Cooperation Council (4.1 million), North America (3.0 million), and Northern Europe (1.8 million). Elsewhere in the developed world, the net inflow of migrants never exceeds one million, with flows of 849,000 in Australia–New Zealand, 685,000 in Southern Europe, 469,000 in East Asia, and 437,000 in Eastern Europe. The net inflow of international migrants greatly exceeds the outflow in four world regions—the Gulf Cooperation Council, Western Europe, North America, and Australia–New Zealand—indicating their status as the world’s leading regions of immigration. For East Asia, Eastern Europe, and Southern Europe, the outflow of migrants exceeds the inflow, indicating net losses of population through emigration in these poorer regions of the developed world.
Turning to the developing world, we observe substantial inflows of migrants into the nations of Sub-Saharan Africa (2.2 million), South America (2.1 million), and West Asia (1.6 million). Comparing inflows and outflows within a region reflects the degree to which departing international migrants simply go to other nations in the same region rather than moving further afield. Although 3.6 million Sub-Saharan Africans left their countries of birth between 2015 and 2019, around 2.2 million of went to other Sub-Saharan nations, meaning that some 63% of all the migratory moves were within-region. In South America, the figure was 81% and in West Asia the figure was 50%. In contrast, almost all the departures from countries in South Asia and Southeast Asia were to countries outside the region, principally to nations in the developed world.
Figure 2.6 draws on data from the UNHCR (2022a) to examine net changes in the number of persons of concern to that agency by region between 2015 and 2019. The light gray bars show net changes by region of origin to reveal a rather complex picture. Among developing nations, we see that three regions experienced sizeable net losses of refugees over the period and two show large net gains. Net losses occur when people, who before 2015 had been displaced from their places of original origin to internal or international locations within the region, had by 2015 either moved on to new locations outside the region or died.
A grouped bar graph of thousands of refugees over different countries by origin and by destination. The highest bar, by origin, is south America, 689, and by destination is Sub Saharan Africa, 540.
Fig. 2.6
Net change in number of persons of concern to UNCHR by world region, 2015–2019. Source: UNHCR (2022a), compiled by author
×
North Africa, for example, experienced a net loss of refugees between 2015 and 2019, suggesting that some 242,000 people who had, before 2015, been displaced within North Africa had by 2019 moved on, mostly likely by heading across the Mediterranean with or without authorization and either reaching Europe or dying in the process. The net loss of 241,000 refugees from West Asia likely reflects Syrians or Iraqis who before 2015 had been displaced to locations in Turkey but by 2019 had moved on to Europe via land corridors through the Balkans or by boat to the Greek Islands. Similarly, the outflow of 146,000 refugees from South Asia could reflect the movement of displaced Afghanis across the border into Turkmenistan or Tajikistan, or even relocation to Europe.
In addition to the three regions with net losses of refugees, three had significant gains, including 540,000 persons in Sub-Saharan Africa, 493,000 in South America, and 82,000 in Central America. In each case, however, the net losses were offset by net gains in the same regions (see the dark gray bars), indicating that a large share of these refugee movements are within the same region. In South America, for example, the addition of 689,000 refugee arrivals at places of destination in the region is greater than the 493,000 departures from places of South American origin. This pattern reflects not just the large internal displacement of Colombians within Colombia in response to high levels of civil violence but also the arrival of millions of refugees from neighboring Venezuela, who were fleeing the collapse of its political economy.
Similarly, the relative balance of 540,000 refugee departures and 557,000 refugee arrivals in Sub-Saharan Africa indicates that most refugees in the region are either internally displaced persons or people sheltering in neighboring or nearby countries. In Central America, refugee departures from regions of origin number just 82,000 whereas arrivals by region of destination number 230,000, reflecting the large-scale displacement of Nicaraguans to neighboring Costa Rica as well as the displacement of refugees from El Salvador, Guatemala, and Honduras internally as well as into Mexico. Note that, in North Africa, the net change in the number of migrants by destination is negative, reflecting the use of North Africa as a staging area for Sub-Saharan migrants making their way to Europe. The net loss of 107,000 refugees in North Africa suggests that many refugees from the south who arrived before 2015 had, by 2019, moved on toward uncertain fates at sea or in the European Union.
With two exceptions, there is no significant refugee migration out of regions in the developed world. Although a net outflow of 92,000 refugees departed Eastern Europe and 40,000 left East Asia, these numbers pale in comparison to the roughly half million net departures from Sub-Saharan Africa and South America. Instead, the prevailing pattern among regions in the developed world is the receipt of refugees from other world regions, led by North America with a net gain of 570,000, followed by 468,000 in Western Europe, 100,000 in Southern Europe, and 66,000 in Australia-New Zealand. Very few refugees arrive or depart from the Gulf Cooperation Council or Northern Europe.
In general, the information presented in Figs. 2.5 and 2.6 suggest a complex pattern of international population movements during the 2015–2019 period. Although we see clear evidence of the large-scale movement of both migrants and refugees from developing to developed regions, we also note that much of the movement from countries in the developing world remains within the same region of origin. Among refugees, we also observe the presence of stepwise migration, with the initial displacement of people from countries of origin in the developing world to countries of initial shelter in the same or adjacent regions, followed by subsequent movement to third countries of perhaps more permanent refuge.
Conclusion
This chapter begins by describing three earlier periods of mass international migration that unfolded during the modern era: the forcible removal of some 12 million enslaved persons from Africa to the Americas during the mercantilist period of European colonialism from 1500 to 1888; the mass movement of 71 million persons out of Europe to the Americas and Oceania that accompanied industrialization from 1800 into the 1920s; and the mass international movements associated with the full globalization of markets in post-industrial period that began in the 1970s, leading to an unprecedented global population of 283 million international migrants by 2020, constituting 3.6% of the world’s population. This brief survey, however, begs the question of what the future of international migration might be as the twenty-first century proceeds.
The question is assessed by undertaking a systematic review of data on the likely drivers of migration in four basic categories: demographics, economics, climate, and governance. The analysis of demographic indicators documents the existence young, rapidly growing populations with high youth dependency ratios in the developing world and older, slow-growing population with high elder dependency ratios in the developed world. Economic indicators reveal low per-capita GDPs, slow or negative growth in employment-to-population ratios, and high rates of inflation in the developing world compared with high GDPs per capita, rising employment to population ratios, and lower rates of inflation in the developed world.
These obverse and complementary circumstances in developing and developed regions predict a continuation of the ordered pattern of international labor migration characteristic of the 1990s, when observers proclaimed a new world order of peace and prosperity under shared ideologies of liberal democratic governance and neoliberal economics, a view seemingly affirmed by the collapse of the Soviet Union, China’s turn toward a market economy, the end of the Cold War, and, after 1990, the creation of a truly global market for goods, services, commodities, capital, and information governed by the Bretton Woods institutions.
Despite this optimism, a systematic assessment of different regions’ vulnerability to, and readiness for, climate change reveals a huge gap in the relative adaptability of developed and developing regions. At the same time, a concomitant review of governance around the world reveals an assemblage of fragile state structures, weak rule of law, limited human rights, and high levels of violence across the developing world. Although these circumstances are hardly absent in the developed world, they are far less prevalent there. Where the complementary pairing of economic and demographic factors might presage a pattern of ordered international migration, the pairing of climate change threats and unstable governance in the developing world with climate adaptability and the rule of law in the developed world suggests a more disordered pattern of international movement as people increasingly move to escape threats at places of origin rather than access opportunities at places of destination.
Consistent with this more jaundiced view of the future of international migration, data reveal that, since 2000, the volume of movement by refugees, asylum seekers, and other displaced persons has increased more rapidly that the flow of international migrants. If this pattern of growing threat-based movement relative to opportunity-based migration continues, Sub-Saharan Africa, Western Asia, South Asia, and portions of Central and South America will figure prominently as likely sources of future migration. Given current patterns of movement and historical legacies of trade and colonialism, we are likely to witness accelerating rates of forced as well as elective movement within well-established migration corridors that already connect Latin America and the Caribbean to North America; Africa and the Middle East to Europe; and Southeast Asia and the Pacific to Australia–New Zealand.
As of this writing, the Operational Data Portal of the UN High Commissioner for Refugees lists 24 “situations” around the world that the agency is actively monitoring (UNHCR, 2022b): 11 in Sub-Saharan Africa, four in the Middle East, four in Asia, three in Europe, and two in Latin America. Figure 2.7 shows the number of displaced persons associated with these situations to indicate the scale and geographic dispersion of forced migration in the world as of June 2022. In addition to the specific country cases, the list includes four Regional Bureaus (RBs) and six Camp Coordination and Camp Management Authorities (CCCMs) run by UNHCR. Reading through the agency’s description of these cases, we encounter examples of displacements stemming from military invasion (Ukraine), civil warfare (Syria), genocide (the Rohingya in Bangladesh), interethnic conflict (Burundi), climate change (the Sahel), terrorism (the Boko Haram in Nigeria), criminal violence (Central America), state failure (Venezuela), famine (Ethiopia), and, in some cases, all of the above (West and Central Africa). The number of displacements range from 8000 (in Southern Europe) to 17.6 million (in the East and Horn of Africa and the African Great Lakes Region). Across all situations, this amounts to some 104 million persons in June 2022 (though the categories likely overlap).
A grouped bar graph of thousands of displaced over Africa, the middle east, Asia, Europe, and America. The highest bar in Africa is east and the horn of Africa, great lake bureau, in the middle east is Syria, in Asia is Asia pacific bureau, in Europe is Ukraine, and in America is Venezuela.
Fig. 2.7
Number of displaced persons (000) in situations currently being monitored by the UN High Commissioner for Refugees. Source: UNHCR (2022b), compiled by author
×
The latest worldwide malady to sweep the globe is the Covid-19 pandemic. Between January 2020 and June 2022, it generated an estimated 528.3 million infections and 6.3 million fatalities (WHO, 2022). Available data do not yet permit an assessment of how the pandemic affected the cross-border movement of people globally. Time will tell what the long-term effects might be. However, preliminary indications are that it reduced the volume of international migration, at least initially, given that so many nations closed their borders in an effort to check contagion. As a result, despite the large and growing number of refugees in need of resettlement, UNHCR (2022b) reports that just 23,000 refugees were settled by the agency in 2021, the lowest number in decades. In the United States, the number of immigrant arrivals dropped by 31% between 2019 and 2020, while the number of refugee admissions fell by 61%; the latter number being the lowest total ever recorded since record-keeping began (US Office of Immigration Statistics, 2022).
In addition to posing political and policy challenges to political systems and leaders throughout the world, the rise of threat-based migration poses theoretical challenges to scholars attempting to understand and predict transnational movements in the future. Historically, refugee and migration studies pursues theoretically and substantively different fields of inquiry and scholarship, but the rising tide of threat-based alongside opportunity-driven migration underscores FitzGerald and Arrar’s (2018: 387) admonition that “theorization in the sociology of migration and the field of refugee studies has been retarded by a path-dependent division that […] should be broken down by greater mutual engagement.” Likewise, the longstanding division between research on internal and international migration should also be abandoned given the reality that displacements induced by environmental degradation, extreme weather events, civil violence, and open warfare do not respect political boundaries (Bohra-Mishra & Massey, 2011a, 2011b).
Finally, given the role that government policies play in shaping how migration processes play out in practice (cf. Massey et al., 2016), the field needs greater engagement with political sociology (Waldinger & Soehl, 2013), specifically understanding the spread of autocracy (Swyngedouw, 2019), since autocratic rulers without checks and balances can make unwise unilateral decisions that unleash unexpected surges of migration. Although it took 50 years of migration between the imperfect democracy of Mexico and the more established democracy of the United States for 10% of all persons born in Mexico to end up in the United States, it took just five years for 10% of the population to exit Venezuela in response to decisions taken by the autocrats Hugo Chávez and Nicolás Maduro; and it took just one month for 10% of Ukraine’s population to relocate abroad in response to Vladmir Putin’s autocratic decision to invade.
Open Access This chapter is licensed under the terms of the Creative Commons Attribution-NonCommercial-NoDerivatives 4.0 International License (http://creativecommons.org/licenses/by-nc-nd/4.0/), which permits any noncommercial use, sharing, distribution and reproduction in any medium or format, as long as you give appropriate credit to the original author(s) and the source, provide a link to the Creative Commons license and indicate if you modified the licensed material. You do not have permission under this license to share adapted material derived from this chapter or parts of it.
The images or other third party material in this chapter are included in the chapter's Creative Commons license, unless indicated otherwise in a credit line to the material. If material is not included in the chapter's Creative Commons license and your intended use is not permitted by statutory regulation or exceeds the permitted use, you will need to obtain permission directly from the copyright holder.