This article documents the number of target persons participating in the panel surveys of the National Educational Panel Study (NEPS) as well as the number of respondents who temporarily dropout and of those leaving the panel (attrition). NEPS comprises panel surveys with six mutually exclusive starting cohorts covering the complete life span. Sample sizes, numbers of participants and temporary as well as final dropouts and participation rates are reported in detail for each wave and for subsamples, if applicable. Sample particularities, such as the conversion of temporary dropouts into final ones, are elaborated on. All figures presented are derived from the corresponding Scientific Use Files (SUFs) published by February 1, 2018. Selectivity due to attrition (i.e., final dropouts) is studied. For this purpose, we examine how attrition distorts the NEPS samples with respect to relevant design variables (such as stratification criteria) and panel member characteristics (like sex and birth year). In detail, we study the panel status of each panel member, that is being part of the panel or having dropped out finally, along all of the panel waves with respect to starting cohort and population specific characteristics. We conclude this article with some recommendations for dealing with the detected selection bias in statistical analyses.
Hinweise
Publisher’s Note
Springer Nature remains neutral with regard to jurisdictional claims in published maps and institutional affiliations.
1 Introduction
This article documents the number of target persons participating in the panel surveys of the National Educational Panel Study (NEPS) as well as the number of respondents who temporarily dropout and of those leaving the panel (attrition). We introduce discrete time event history models as proper means to study panel attrition and selectivity in NEPS. For this purpose, we consider all of the six NEPS starting cohorts and their corresponding Scientific Use Files (SUFs) published by February 1st, 2018. NEPS is a nationwide study gathering information about the educational trajectories of people residing in Germany. To cover the complete life span with respect to significant educational transitions, it surveys target persons from six mutually exclusive starting cohorts:
Starting Cohort 1 (SC1)
children born between February and July 2012,
Starting Cohort 2 (SC2)
children in 2010 whose enrollment in school was expected to be in school year 2012/13,
Starting Cohort 3 (SC3)
students in grade 5 in regular and special schools in school year 2010/11,
Starting Cohort 4 (SC4)
students in grade 9 in regular and special schools in school year 2010/11,
Starting Cohort 5 (SC5)
freshmen in 2010/11 at universities and universities of applied sciences,
Starting Cohort 6 (SC6)
adults born between 1944 and 1986 living in Germany.
Detailed information on the objectives, the composition, and the contents of NEPS is given in Blossfeld et al. (2011). The population and the sampling design of all starting cohorts is described in very detail in Würbach et al. (2016) for the SC1, Steinhauer et al. (2016) for the SC2, Steinhauer and Zinn (2016a) for the SC3, Steinhauer and Zinn (2016b) for the SC4, Zinn et al. (2017) for the SC5, and Hammon et al. (2016) for the SC6. Up to now, the following SUFs have been released, see https://www.neps-data.de/:
SC1:
Waves 1 to 4 from 2012 to 2015 (SUF version 4.0.0),
SC2:
Waves 1 to 6 from 2011 to 2015 (SUF version 6.0.0),
SC3:
Waves 1 to 7 from 2010 to 2015 (SUF version 7.0.0),
SC4:
Waves 1 to 9 from 2010 to 2015 (SUF version 9.1.0),
SC5:
Waves 1 to 9 from 2010 to 2015 (SUF version 9.0.0),
SC6:
Waves 1 to 7 from 2009 to 2016 (SUF version 8.0.0).
Taken together all of the SUFs comprise in total 72 studies. Table 1 gives an overview of all of these studies inclusively (NEPS internal) study numbers, study time, survey periods, panel waves, and survey mode. In each study, survey questionnaires have been administered in one of the following survey modes:
CATI: computer assisted telephone interview,
CAPI: computer assisted personal interview,
CAWI: computer assisted web interview,
PAPI: paper and pencil interview.
Some studies allowed respondents to choose between modes, while other studies assigned them randomly. In few studies special groups of respondents were assigned to a particular survey mode to increase the likelihood of participation. For example, SC6 panel members who could not be interviewed on the phone (via CATI) were automatically assigned to the CAPI mode.
Generally, target persons are surveyed in two different contexts, either in groups such as test groups in schools or universities or individually, for example when interviewed on the telephone or personally at home. Comprehensive details on this and the NEPS studies in general are given at the web page of the NEPS data.1
Anzeige
Besides questionnaires, NEPS also administers competence tests to gather information on the development of knowledge, skills and competencies relevant for educational processes and decisions. There are domain-general tests such as cognitive functioning and domain-specific tests such competencies in mathematics and reading. In Table 1, waves with tests are marked by a star. Note that target persons at younger ages, i.e. in SC1 and in SC2 from 2011 to 2013, are tested but questionnaires are answered by their parents. At later ages (i.e., in SC2, SC3 and SC4), both, parents and target persons, are interviewed.
Table 1
Attribution of studies to starting cohorts and panel waves
Wave
Time
Study Number
Mode
Period
Starting Cohort 1
\(1^{\star}\)
6–8 months
B04
CAPI
2012/13
\(2^{\star}\)
16–17 months
B05
CATI & CAPI
2013
\(3^{\star}\)
25–27 months
B91
CAPI
2014
\(4^{\star}\)
37–39 months
B100
CAPI
2015
Starting Cohort 2
\(1^{\star}\)
4–5 years
A12
PAPI
2011
\(2^{\star}\)
5–6 years
A13
PAPI
2012
\(3^{\star}\)
Grade 1
A14/A14A
PAPI
2013
\(4^{\star}\)
Grade 2
A15/A15_L1
PAPI
2013/14
\(5^{\star}\)
Grade 3
A89
PAPI
2014/15
\(6^{\star}\)
Grade 4
A97/B103
PAPI
2015/16
Starting Cohort 3
\(1^{\star}\)
Grade 5
A28/A56/A63
PAPI
2010/11
\(2^{\star}\)
Grade 6
A29/A57
PAPI
2011/12
\(3^{\star}\)
Grade 7
A30/A30A/A58
PAPI
2012/13
4
Grade 8
A31, A59
PAPI
2013/14
\(5^{\star}\)
Grade 9
A94
PAPI
2014/15
6
Grade 9
A98
PAPI
2015
\(7^{\star}\)
Grade 10
B106/A99
(CATI & CAWI)/PAPI
2015/16
Starting Cohort 4
\(1^{\star}\)
Grade 9
A46/A60/A67/A83/A86
PAPI
2010
\(2^{\star}\)
Grade 9
A47/A61/A68/A84/A87
PAPI
2011
\(3^{\star}\)
Grade 10
A48/A62/A69/A85/A88/B37
PAPI/CATI
2011/12
4
Grade 10
B38
CATI
2012
\(5^{\star}\)
Grade 11
A49/B39
PAPI/CATI
2012/13
6
Grade 11
B40
CATI
2013
\(7^{\star}\)
Grade 12
A50/B41
PAPI/CATI
2013/14
8
Grade 13
A96/B93
PAPI/CATI
2014/15
9
Grade 13
B109/B109_O
(CATI/CAPI) & CAWI
2015
Starting Cohort 5
\(1^{\star}\)
1st study year
B52
CATI
2010/11
2
2nd study year
B54
CAWI
2011
3
2nd study year
B55
CATI
2012
4
3rd study year
B56
CAWI
2012
\(5^{\star}\)
3rd study year
B59
CATI
2013
6
4th study year
B58
CAWI
2013
\(7^{\star}\)
4th study year
B94
CATI
2014
8
5th study year
B95
CAWI
2014
9
5th study year
B111
CATI
2015
Starting Cohort 6
1
23–65 years
B72
CATI/CAPI
2009/10
\(2^{\star}\)
24–66 years
B67
CAPI/CATI
2010/11
3
25–67 years
B68
CATI/CAPI
2011/12
\(4^{\star}\)
26–68 years
B69
CAPI/CATI
2012/13
5
27–69 years
B70
CATI/CAPI
2013/14
\(6^{\star}\)
28–70 years
B97
CAPI/CATI
2014/15
7
29–71 years
B115
CATI/CAPI
2015/16
(i) Study numbers starting with ‘A’ mark studies conducted at schools and Kindergartens while study numbers starting with ‘B’ indicate studies conducted via telephone interview, at home, or online. (ii) \({}^{\star}\) marks waves with competence tests. (iii) A forward slash separating survey modes indicates that two modes were offered exclusively and a ‘&’ indicates that persons were interviewed by two modes (e.g. because of add-on studies).(iv) In SC1, parents are interviewed about their children. (v) In the SC2 Waves 1 to 5, children are tested only and not interviewed. (vi) In SC5, test rounds are assigned study numbers, namely B53 in Wave 1, B57 in Wave 5, and B90 in Wave 7. (vii) One subsample of the SC6 builds upon the ALWA study (cf. http://fdz.iab.de/en/FDZ_Individual_Data/ALWA.aspx). Thus, in NEPS there exists an alternative enumeration of the SC6 waves where the ALWA study constitutes Wave 1, and the subsequent NEPS SC6 waves are counted as Waves 2, 3, and etc.
The remainder of this article is structured as follows: first, we detail the number of participants and temporary as well as final dropouts along all of the panel waves and starting cohorts. Second, we present the results of the selectivity analyses in which we study how attrition affects the composition of the NEPS samples. We conclude with some recommendations for dealing with the detected selection bias in statistical analyses.
2 Participants, Dropouts, and Attrition
NEPS surveys target persons together with relevant context persons such as parents, educators, and teachers, where it applies that is at younger ages in SC1, SC2, SC3 and SC4. This article, however, focuses on the target persons only. Information on context persons are provided elsewhere, for example, at the web page of the NEPS data. In the subsequent, a target person is considered to be a participant when that person has provided some information on him- or herself during a study.2
Initially for each starting cohort a gross sample had been established comprising all of the units drawn to be part of the panel survey. In SC1, SC5, and SC6 the whole gross sample has been administered in Wave 1, and each of its members has been asked for panel consent during the first wave. All respondents with positive consent form the panel cohort of the corresponding starting cohort at Wave 1. On the contrary, in SC2, SC3, and SC4 the panel consent had been obtained before the first wave, thus, the sample administered in Wave 1 already constituted the panel sample. In other words, the people asked to participate in the first waves constitute different samples: in SC1, SC5, SC6 the gross sample, and in SC2, SC3, SC4 the panel sample at Wave 1. At the start of a specific wave, the panel sample of each starting cohort consists of all individuals who initially gave their panel consent and did not refuse further participation, or are defined as final dropout because of one of the following two reasons: (i) continuous non-participation over a period of two years3 or (ii) a response code in a previous study defined to be an attrition event. These response codes are:
respondent refuses participation in general/permanent deletion of address/withdraw panel consent (for target person),
death of target person,
target person already surveyed,
respondent refuses new address (for target person),
target person cannot be surveyed/permanently sick or disabled,
communication impossible/respondent does not speak enough German/no communication possible in one of the languages offered,
respondent refuses participation in general/permanent deletion of all of the data/withdraw panel consent (for target person).
Sometimes not all of the members of the panel sample are administered in each panel wave. There are two main reasons for this. First, questionnaires or tests cannot be administered because of missing contact information. This occurs mainly in highly mobile populations such as students graduating from school and leaving home for further training or studying. Second, by design only specific subgroups are considered in a wave, for example, only students of a specific field. Persons who were administered in a study but did not participate and who are not a final dropout are regarded as temporary dropout. Note that final dropouts can occur within and between studies: within waves attrition results from an accordant response code, and between waves attrition arises because of active refusal or continuous non-participation over a period of two years.\({}^{3}\)
Anzeige
Subsequently, the distinct panel samples of NEPS are described, broken down by starting cohort, panel wave, administered sample, number of participants and temporary dropouts as well as final dropouts within and between waves. In, SC2–SC6 sampling particularities allow for the derivation of design specific subsamples which are considered in our presentation. These are:
Starting Cohort 2
K1_AUG
The augmentation sample of Wave 3. These children were surveyed and tested in the Grades 1 to 4 (Waves 3–6) in elementary schools, but were not surveyed or tested in Kindergarten institutions in Waves 1 and 2.
KIGA_IND
The group of Kindergarten children, who were tested only in Kindergarten in Waves 1 and 2. These children did not move to an elementary school sampled in advance and participating. While the children are temporary dropouts by design until Wave 6 the parents were still asked for participation. In Wave 6 these children are surveyed and tested again (at home).
KIGA_PANEL
The group of Kindergarten children being surveyed and tested in Kindergarten in Waves 1 and 2 and transitioned to elementary schools sampled in advance and participating. In Wave 3 they have been surveyed and tested together with the children of subsample K1_AUG in the Grades 1 to 4.
Starting Cohort 3
G7_AUG
The augmentation sample of Wave 3. These children were surveyed and tested in the Grades 7 to 10 (Waves 3–6) in school or at home when they have left school or the school withdrew participation consent for NEPS. They were not surveyed or tested in Grade 5 or Grade 6 (Waves 1 and 2).
G5
The original panel sample. These children were surveyed and tested in the Grades 5 to 10 (Waves 1–6) in school or at home when they have left school or the school withdrew participation consent for NEPS.
Starting Cohort 4 (Waves 3 to 8)\({}^{\text{a}}\)
ACA
All students educated at a secondary school.
VOC
All students and persons in vocational training or in the German transition system.
Starting Cohort 5\({}^{\text{b}}\)
TEA
Freshman students studying for a teacher degree.
UNI
Freshman students at universities without TEA.
AUN
Freshman students at universities of applied sciences without TEA.
PR
Freshman students at private universities.
Starting Cohort 6
ALWA
Persons from the ALWA sample who agreed to participate in NEPS.
NEPS1
Persons born in the years 1944–86 who gave panel consent during NEPS Wave 1.
NEPS3
The augmentation sample of NEPS Wave 3 comprising persons born in the years 1944–86 who agreed to participate in NEPS.
\({}^{\text{a}}\) Beware that in SC4 Wave 1–2 all of the students are surveyed and tested in school, thus in the academic context. At first in Wave 3, students left secondary school to start vocational training or to enter the German transition system. In Wave 9, all SC4 panel members have left secondary school, yielding a sample of persons all surveyed and tested individually (i.e., at home, via telephone, or web-based). \({}^{\text{b}}\) The subsamples of the SC5 are made up by its explicit strata.
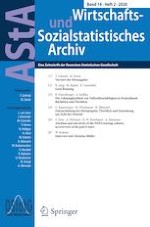
The figures of SC1 and SC2 are given in the Tables 2 and 3. The Tables 4 and 5 summarize the numbers of SC3 and SC4, and the Tables 6 and 7 present the numbers of SC5 and SC6. Participation rates are calculated as the ratio between the size of the administrated sample and the number of participants. The Figs. 1 to 6 illustrate the panel progress of all starting cohorts graphically.
2.1 Starting Cohort 1
The NEPS SC1 (Newborns) started with a gross sample size of 8483 persons (cp. Table 2). In Wave 1, 3481 interviews could be realized corresponding to a participation rate of 41.0%. The panel cohort reduced to 3431 (participation rate 40.4%) since 42 participants gave no panel consent in Wave 1, and 8 participants withdrew their panel consent before Wave 2. The numbers of Wave 2 are reported separately for CATI and CAPI mode. In the parent interview (CATI) we recorded 2849 respondents, the corresponding participation rate is 83.0%. Additionally, direct measurements and another parent interview were applied to a random subsample of the SC1 panel cohort in Wave 2. In total, 1893 persons were asked for participation and 1510 cases could finally be realized corresponding to a participation rate of 79.8%.
Fig. 1
Size of Panel Cohort SC1 along Waves
×
Among the 2616 realized interviews in Wave 3, 2609 are valid (participation rate 79.5%). Seven interviews are considered invalid due to technical problems during the survey. In Wave 4, 2480 interviews were realized, but two interviews had been conducted from interviewers without approval for execution. The data from these two interviews were regarded as not exploitable and thus regarded as temporary dropouts. The corresponding participation rate is 78.8%. Due to continuous non-participation over a period of two years 143 of the 541 temporary dropouts are converted to final dropouts between Waves 4 and 5. Fig. 1 displays these numbers, where the height of each bar gives the initial number of targets with valid panel consent.
Table 2
Panel Progress SC1
Wave
Sub-
Panel
Not
Administered
Participants
Participation
Temporary
Final Dropouts
Final Dropouts
sample
Cohort
administered
Rate
Dropouts
(in Wave)
(between Waves)
1
Total
–
–
8483
3481
0.410
0
5002
50
2
Total
3431
0
3431
2862
0.834
468
101
49
CATI
3431
0
3431
2849
0.830
480
102
48
CAPI
3431
1538
1893
1510
0.798
340
43
21
3
Total
3281
0
3281
2609
0.795
539
133
5
4
Total
3143
0
3143
2478
0.788
541
124
147
Notes: ‘–’ does not apply.
We see that the amount of temporary dropouts remains stable across the panel waves whereas the number of final dropouts is adding up, of course.
2.2 Starting Cohort 2
The NEPS SC2 (Kindergarten) started in 2010 with a panel cohort comprising 3007 Kindergarten children whose school enrollment was expected to be in the school year 2012/13 (cp. Table 2). In the first wave, 2949 Kindergarten children participated together with their parent. The corresponding participation rate is 98.1%. Wave 2 consists of 2727 participants yielding an identical participation rate as in Wave 1.
Fig. 2
Size of Panel Cohort SC2 along Waves. a KIGA (\(n=3007\)), b K1_AUG (\(n=6341\))
×
In Wave 3 in the school year 2012/13, an augmentation sample of Grade 1 students (K1_AUG) was drawn and asked for participation. This augmentation sample is related to the sample of Kindergarten children by the elementary schools to which they pass. The augmentation gross sample contains 19205 students. In total, 6917 students provided panel consent and are followed up through their time in elementary school and beyond. A small proportion of these students constitutes the Kindergarten children who have already been surveyed in Wave 1 and 2 (576 students in KIGA_PANEL). Among the sample with panel consent, 6733 participated in the survey and testing of Wave 3 corresponding to a participation rate of 97.3%. Kindergarten children who did not pass to a NEPS school4 are assigned to the field of individual retracking (KIGA_IND). By design, they are not interviewed and tested until Wave 6 when they are supposed to be in Grade 4. Accordingly, from Wave 3 up to Wave 5 they are defined as temporary dropouts. Among the 6340 realized interviews in Wave 4 (participation rate is 96.1%), 5801 cases belong to K1_AUG and 539 cases to KIGA_PANEL. In Wave 5, 5799 interviews were realized, 5296 cases in the K1_AUG subsample and 503 in the subsample KIGA_PANEL.
Table 3
Panel Progress SC2
Wave
Sub-
Panel
Not
Administered
Participants
Participation
Temporary
Final Dropouts
Final Dropouts
sample
Cohort
administered
Rate
Dropouts
(in Wave)
(between Waves)
1
Total
3007
0
3007
2949
0.981
47
11
0
2
Total
2996
215
2781
2727
0.981
54
0
1
3
Total
9336
2419
6917
6733
0.973
184
0
5
K1_AUG
6341
0
6341
6176
0.974
165
0
2
KIGA_IND
2419
2419
–
–
–
–
–
3
KIGA_PANEL
576
0
576
557
0.967
19
0
0
4
Total
9331
2733
6598
6340
0.961
232
26
23
K1_AUG
6339
296
6043
5801
0.960
217
25
15
KIGA_IND
2416
2416
–
–
–
–
–
2
KIGA_PANEL
576
21
555
539
0.971
15
1
6
5
Total
9282
3118
6164
5799
0.941
204
161
77
K1_AUG
6299
669
5630
5296
0.941
185
149
41
KIGA_IND
2414
2414
–
–
–
–
–
31
KIGA_PANEL
569
35
534
503
0.942
19
12
5
6
Total
9044
554
8490
6943
0.818
1180
367
\(694^{\text{a}}\)
K1_AUG
6109
61
6048
5462
0.903
425
161
\(186^{\text{a}}\)
KIGA_IND
2383
458
1925
998
0.518
735
192
\(497^{\text{a}}\)
KIGA_PANEL
552
35
517
483
0.934
20
14
\(11^{\text{a}}\)
Notes: ‘–’ does not apply. \({}^{\text{a}}\) All parental refusals until Wave 6 are included in these numbers because for the target persons they come into effect at first when leaving the elementary school, which occurs before Wave 7.
The overall participation rate in Wave 5 is 94.1%. All students are asked for participation in Wave 6, including those from subsample KIGA_IND. In sum, 6943 students are tested and surveyed yielding a participation rate of 81.8%. Among these, 5462 students belong to the K1_AUG subsample, 483 to the KIGA_PANEL subsample, and 998 students are part of the subsample KIGA_IND. The number of final dropouts in Wave 6 is far higher for KIGA_IND as compared to the other two subsamples. This might be due to the fact that this particular subsample was not surveyed for three years. The KIGA_IND subsample was tested and surveyed individually in Wave 6. In contrast, students of K1_AUG and KIGA_PANEL are tested and surveyed in their institutional context. We see a considerable decrease in the panel cohort size when the school context was left in Wave 7 and all students together with their parents were tested and surveyed individually. In each subsample, the increase in the final dropouts between the Waves 6 and 7 is very high. This issue is mainly attributable to the summation of all parent withdrawals of the previous studies. Until Wave 6 the affected target persons could be surveyed and tested in spite of parental withdrawal. However, in Wave 7 all students transitioned to the individual field, i.e. questionnaires and tests are passed at home. That is, in case of an existing parent withdrawal, surveying has had to be abandoned. As a result 526 target persons have had to be excluded from the panel sample though they were still willing to participate. Fig. 2 visualizes these numbers, where the height of each bar gives the initial number of targets with valid panel consent.
2.3 Starting Cohort 3
The SC3 panel cohort (Grade 5) comprises the two subsamples G5 and G7_AUG. The G5 subsample has been established in 2010. Its gross sample consisted of 11563 Grade 5 students. Two years later, in 2012, the SC3 sample was enriched by the G7_AUG augmentation sample. For this purpose, 3944 Grade 7 students had been drawn and asked to participate in NEPS.
Fig. 3
Size of Panel Cohort SC3 along Waves. a G5 (\(n=6112\)), b G7_AUG (\(n=2205\))
Table 4
Panel Progress SC3
Wave
Sub-
Panel
Not
Administered
Participants
Participation
Temporary
Final Dropouts
Final Dropouts
sample
Cohort
administered
Rate
Dropouts
(in Wave)
(between Waves)
1
Total
6112
0
6112
5778
0.945
334
0
13
2
Total
6099
0
6099
5537
0.908
561
1
8
3
Total
8295
0
8295
7277
0.882
989
29
10
G5
6090
0
6090
5131
0.843
930
29
10
G7_AUG
2205
0
2205
2146
0.973
59
0
0
4
Total
8256
0
8256
6718
0.814
1505
33
580
G5
6051
0
6051
4783
0.790
1249
19
580
G7_AUG
2205
0
2205
1935
0.878
256
14
0
5
Total
7643
0
7643
5778
0.756
1625
240
0
G5
5452
0
5452
4001
0.734
1273
178
0
G7_AUG
2191
0
2191
1777
0.811
352
62
0
6
Total
7403
0
7403
5586
0.755
1739
78
5
G5
5274
0
5274
3920
0.743
1292
62
5
G7_AUG
2129
0
2129
1666
0.783
447
16
0
7
Total
7320
241
7079
5491
0.776
1542
46
20
G5
5207
150
5057
3924
0.776
1104
29
16
G7_AUG
2113
91
2022
1567
0.775
438
17
6
Notes: Numbers for Wave 7 are different from the numbers in the current SUF version 7.0.1. Corrected numbers will be available in the next SUF version.
×
In sum, 6112 students (i.e., 52.9%) of the G5 gross sample and 2205 students of the G7_AUG gross sample (i.e., 55.9%) provided valid panel consent. Table 4 details the SC3 panel progress, separately for the two samples G5 and G7_AUG. Its third column gives the panel cohort size at the beginning of each wave. The columns four and five show the number of students who had been administered an interview and those who had not. Then, in the columns six to nine the number of participants, temporary, and final dropouts at the end of each wave are given. The last column contains the number of students actively refusing further participation in the SC3 panel study. The basically same information is provided by Fig. 3, where the height of each bar gives the initial number of students with valid panel consent. From both, Table 4 and Fig. 3, the large number of students finally dropping out after Wave 4 is noticeable. This is because 578 students in special-need schools were dismissed from the panel.
2.4 Starting Cohort 4
The gross sample of the SC4 (Grade 9) consists of 26868 students. Of these, 16425 students (61.1%) provided valid panel consent. Table 5 gives details on the SC4 panel progress separated by its two subsamples ACA (academic track) and VOC (vocational track). The table provides the panel cohort size at the beginning of each wave together with the number of students who had been administered an interview and those who had not. For students who had been administered an interview the following columns give the corresponding status (participant, temporary, and final drop out) at the end of each wave. The last column gives the number of students actively refusing further participation in the panel study.
Fig. 4 displays the numbers of Table 5 graphically. Note that the height of each bar gives the initial number of students with valid panel consent. In the Waves 1 and 2, all students are in ACA. From Wave 3 to Wave 8 the students in the academic track (ACA) are located at top of the graphic, whereas the students in the vocational track (VOC) are shown at the bottom of the graphic. Over time, more and more students leave school for vocational education.
Fig. 4
Size of Panel Cohort SC4 along Waves
Table 5
Panel Progress SC4
Wave
Sub-
Panel
Not
Administered
Participants
Participation
Temporary
Final Dropouts
Final Dropouts
sample
Cohort
administered
Rate
Dropouts
(in Wave)
(between Waves)
1
Total
16425
0
16425
16106
0.981
319
0
0
2
Total
16425
0
16425
15215
0.926
1210
0
61
3
Total
16364
8
16356
14011
0.857
2234
111
0
ACA
0
13815
11951
0.865
1842
22
0
VOC
8
2541
2060
0.811
392
89
0
4
Total
16253
14440
–
–
–
–
7
5
ACA
13793
–
–
–
–
–
3
VOC
647
1813
1351
0.745
455
7
2
5
Total
16241
132
16109
12982
0.806
2644
483
4
ACA
0
6305
5768
0.915
522
15
1
VOC
132
9804
7214
0.736
2122
468
3
6
Total
15754
9635
–
–
–
–
60
2
ACA
6289
–
–
–
–
–
1
VOC
3346
6119
5392
0.881
667
60
1
7
Total
15692
185
15507
11830
0.763
3121
556
37
ACA
0
5333
4736
0.888
592
5
22
VOC
185
10174
7094
0.697
2529
551
15
8
Total
15099
1318
13781
9871
0.716
3400
510
1551
ACA
0
688
610
0.885
75
3
16
VOC
1318
13093
9261
0.707
3325
507
1535
9
Total
13038
0
13038
9044
0.694
3262
732
1264
Note: ‘–’ does not apply.
×
Hence, the number of students in the top part (ACA) declines, whereas the number of students in the bottom part (VOC) increases. In Wave 9 all students have left school and thus distinguishing ACA and VOC is not any longer necessary. From both, Table 5 and Fig. 4, some numbers are noticeable. First, in Wave 4 and Wave 6 the majority of students had not been administered. This is because these two waves were targeted only at students in the vocational track who had participated in the previous wave (Wave 3 and Wave 5) to keep in touch. Second, in Wave 8 a large number of students had not been administered. These are mainly students from special-need schools, for whom further financing was unclear. However, starting from Wave 9 financing was secured again and the majority of these students reparticipated. The large number of final dropouts after Waves 8 and 9 is caused by converting temporary dropouts to final ones because of continuous nonparticipation over a period of two years. Due to this, 1396 students were defined as final dropouts and removed from the panel sample after Wave 8, and another 1246 students after Wave 9.
2.5 Starting Cohort 5
For SC5 (First-Year Students), in total 31082 freshmen with valid contact information could be recruited at private and public universities and universities of applied science. These constitute the SC5 gross sample. From these, 17910 persons took part in Wave 1 and gave their panel consent. This corresponds to 57.6% of the administered cases and is the panel cohort of SC5. The remaining cases are ascribed to the final dropouts of Wave 1. Table 6 details the SC5 panel progress separated by its four subsamples TEA (freshman studying for a teacher degree), UNI (freshman at universities without TEA), AUN (freshman at universities of applied sciences without TEA), and PR (freshman at private universities). In the Wave 1 competence tests, only one third (33.2%) of the panel cohort took part. In the Waves 2–9, participation rates fluctuate between 58.8% and 73.5%. We find that the participation rates in the CAWIs (Waves 4, 6, and 8) are generally lower than those in the CATIs conducted earlier in the same year (Waves 3, 5, and 7).
Fig. 5
Size of Panel Cohort SC5 along Waves
Table 6
Panel Progress SC5
Wave
Sub-
Panel
Not
Administered
Participants
Participation
Temporary
Final Dropouts
Final Dropouts
sample
Cohort
administered
Rate
Dropouts
(in Wave)
(between Waves)
1
Total
–
–
31082
17910
0.576
0
13172
0
TEA
–
–
7864
5555
0.706
0
2309
0
UNI
–
–
11904
8024
0.674
0
3880
0
AUN
–
–
7460
3894
0.522
0
3566
0
PR
–
–
3854
437
0.113
0
3417
0
1T\({}^{\text{a}}\)
Total
17910
0
17910
5949
0.332
11955
6
0
TEA
5555
0
5555
2021
0.364
3531
3
0
UNI
8024
0
8024
2715
0.338
5307
2
0
AUN
3894
0
3894
1115
0.286
2778
1
0
PR
437
0
437
98
0.224
339
0
0
2
Total
17904
0
17904
12273
0.685
5604
27
13
TEA
5552
0
5552
3839
0.691
1705
8
2
UNI
8022
0
8022
5609
0.699
2398
15
8
AUN
3893
0
3893
2510
0.645
1380
3
3
PR
437
0
437
315
0.721
121
1
0
3
Total
17864
9
17855
13113
0.735
4561
181
34
TEA
5542
2
5540
4253
0.768
1237
50
11
UNI
7999
4
7995
5841
0.731
2077
77
11
AUN
3887
3
3884
2701
0.696
1135
48
10
PR
436
0
436
318
0.729
112
6
2
4
Total
17649
0
17649
11202
0.635
6432
15
19
TEA
5481
0
5481
3695
0.674
1782
4
2
UNI
7911
0
7911
5003
0.633
2902
6
12
AUN
3829
0
3829
2219
0.580
1605
5
5
PR
428
0
428
285
0.666
143
0
0
5
Total
17615
0
17615
12694
0.721
4626
295
3
TEA
5475
0
5475
4186
0.765
1217
72
0
UNI
7893
0
7893
5615
0.711
2151
127
0
AUN
3819
0
3819
2582
0.676
1148
89
3
PR
428
0
428
311
0.727
110
7
0
5T\({}^{\text{a}}\)
Total
17317
0
17317
8767
0.506
8545
5
59
TEA
5403
0
5403
2907
0.538
2495
1
17
UNI
7766
0
7766
3963
0.510
3801
2
29
AUN
3727
0
3727
1687
0.453
2038
2
10
PR
421
0
421
210
0.499
211
0
3
6
Total
17253
0
17253
10183
0.590
7047
23
7
TEA
5385
0
5385
3352
0.622
2029
4
1
UNI
7735
0
7735
4594
0.594
3126
15
5
AUN
3715
0
3715
1975
0.532
1736
4
1
PR
418
0
418
262
0.627
156
0
0
7T\({}^{\text{a}}\)
Total
17223
16623
600
446
0.743
130
24
2
TEA
5380
5323
57
43
0.667
14
0
0
UNI
7715
7372
343
261
0.761
68
14
0
AUN
3710
3552
158
111
0.703
38
9
2
PR
418
376
42
31
0.738
10
1
0
7
Total
17197
2741
14456
9611
0.665
4426
419
2113
TEA
5380
2741
2639
1924
0.729
652
63
566
UNI
7701
0
7701
5133
0.667
2387
181
980
AUN
3699
0
3699
2277
0.616
1267
155
522
PR
417
0
417
277
0.664
120
20
45
8
Total
14665
1
14664
8629
0.588
6024
11
1
TEA
4751
0
4751
2933
0.617
1817
1
0
UNI
6540
1
6539
3945
0.603
2587
7
0
AUN
3022
0
3022
1546
0.512
1473
3
1
PR
352
0
352
205
0.582
147
0
0
9
Total
14653
1
14652
10096
0.689
4321
235
919
TEA
4750
0
4750
3430
0.722
1252
68
276
UNI
6533
1
6532
4522
0.692
1936
74
411
AUN
3018
0
3018
1898
0.629
1039
81
214
PR
352
0
352
246
0.699
94
12
18
Notes: ‘–’ does not apply. \({}^{\text{a}}\) Tests were conducted in own studies distinct from the survey interviews. In Wave 1 and 5 the testing phase ended after the interview phase, and in Wave 7 testing was conducted before the interviews started.
×
In Wave 7, the oversampling part of the TEA subsample has not been administered (i.e., 15.9% of the Wave 7 panel sample) because at this time its further financing was not secured. However, it was again starting with Wave 8. In Wave 7, for the first time study members are considered as final dropouts because of continuous nonparticipation over a period longer than two years. As a consequence, the proportion of people dropping out from the sample (between the Waves 7 and 8) is noticeably higher than in the waves before. Because of the same reason, after Wave 9 a large proportion of temporary dropouts was declared to be final dropouts. In the Waves 1, 5, and 7 competence tests took place. The Wave 7 competence test was only administered to a particular subgroup of the panel cohort, namely to 600 business administration students. Compared to the participation in the Wave 5 testing (50.6% of the administered cases), participation in the Wave 7 testing was high, i.e. 74.3% of the administered cases. In Wave 9, five years after study start, most students graduated and/or left university. Thus, their propensity to take (further) part in a student sample likely declines. Fig. 5 displays the numbers of Table 6 graphically. Note that the height of each bar gives the initial number of students with valid panel consent, that is, the 17910 students who took part in Wave 1 and gave their panel consent.
2.6 Starting Cohort 6
The sample of the SC6 (Adults) consists of three subsamples: the participants of the ALWA study who agreed to continue to participate in NEPS (ALWA), the newly drawn individuals of the first NEPS wave (NEPS1)5 and the individuals of the refreshment sample in the third wave of the NEPS (NEPS3). Table 7 details the SC6 panel progress separated by its subsamples ALWA, NEPS1, and NEPS3. The column “Not administered” involves individuals who did not actively withdraw their panel consent, but who could not be contacted any more (e.g., because of missing valid contact information).
Fig. 6
Size of Panel Cohort SC6 along Waves. a ALWA/NEPS1 (\(n=11932\)), b NEPS3 (\(n=5208\))
Table 7
Panel Progress SC6
Wave
Sub-
Panel
Not
Administered
Participants
Participation
Temporary
Final Dropouts
Final Dropouts
sample
Cohort
administered
Rate
Dropouts
(in Wave)
(between Waves)
1
Total
8997
0
27009
11649
0.431
1927
13433
1381
ALWA
8997
0
8997
6572
0.730
1927
498
1097
NEPS1
–
0
18012
5077
0.282
0
12935
284
2
Total
12195
0
12195
9323
0.764
2566
306
511
ALWA
7402
0
7402
5639
0.763
1582
181
511
NEPS1
4793
0
4793
3684
0.769
984
125
0
3
Total
11390
0
28501
14112
0.495
1806
12583
414
ALWA
6714
0
6714
5380
0.801
1023
311
204
NEPS1
4676
0
4676
3524
0.754
783
369
210
NEPS3
–
0
17111
5208
0.304
0
11903
0
4
Total
15504
255
15249
11696
0.767
2113
1440
0
ALWA
6199
3
6196
4880
0.788
757
559
0
NEPS1
4097
8
4089
3100
0.758
548
441
0
NEPS3
5208
244
4964
3716
0.749
808
440
0
5
Total
13809
251
13558
10639
0.785
2354
565
528
ALWA
5637
114
5523
4555
0.825
814
154
161
NEPS1
3648
119
3529
2847
0.807
520
162
114
NEPS3
4524
18
4506
3237
0.718
1020
249
253
6
Total
12465
22
12443
9770
0.785
1771
902
344
ALWA
5208
2
5206
4189
0.805
737
280
109
NEPS1
3253
10
3243
2604
0.803
385
254
82
NEPS3
4004
10
3994
2977
0.745
649
368
153
7
Total
11197
10
11187
9236
0.826
1458
493
616
ALWA
4817
2
4815
4099
0.851
554
162
616
NEPS1
2907
4
2903
2450
0.844
322
131
0
NEPS3
3473
4
3469
2687
0.775
582
200
0
Notes: ‘–’ does not apply.
×
Because of convenience, these cases were completely excluded from the panel.6 The column “Administered” contains for the Waves 1 and 3 the gross sample sizes of the newly drawn individuals of the subsamples NEPS1 and NEPS3.7 In total, 11649 individuals participated in Wave 1 and gave their panel consent. This corresponds to 43.1% of the administered cases. In Wave 1, 1927 members of the ALWA sample dropped out temporarily. From these, 833 individuals were readministered in Wave 2 and 283 reparticipated. These cases (i.e., \(N=283\)), combined with the participants of Wave 3, constitute the panel sample of SC6. In Wave 4, 76.4% of the administered cases participated in the interview. In Wave 5, the initial panel sample was augmented by a refreshment sample of 17111 persons. From the drawn gross sample, 30.4% participated in the panel study and gave panel consent. We see that the ALWA members are more likely to participate in the survey than the individuals from the two other NEPS samples. In particular, the NEPS3 subsample shows a strong decline in participation rates: In the latest Wave 7 only 77.5% of the administered persons agreed to participate, compared to 85.1% in the ALWA sample. Fig. 6 illustrates the SC6 panel progress. It is obvious that the temporary dropouts decline more and more as time went by since at latter waves the panel consists mainly of people who are willing to further participate.
3 Selectivity Analyses
Non-random attrition across all of the panel waves is a common issue in non-mandatory panel surveys. It does not pose a problem as long as it is accounted for in statistical inference. Otherwise, biased results might lead to erroneous research conclusions. In NEPS, selectivity (on the level of the respondent) arises at two distinct stages: in the initial sample due to unit-nonresponse in the gross sample (yielding the panel samples at Wave 1) and due to wave nonresponse. Unit-nonresponse in the gross sample is usually handled by weighted analysis using non-response adjusted design weights or by including relevant design variables into the focal model of the substantive research question. Non-response adjusted design weights are part of the SUFs (in the Weights file) and the design variables are described in detail in the sample documentation. For further information see Würbach et al. (2016) for the SC1, Steinhauer et al. (2016) for the SC2, Steinhauer and Zinn (2016a) for the SC3, Steinhauer and Zinn (2016b) for the SC4, Zinn et al. (2017) for the SC5, and Hammon et al. (2016) for the SC6. In a second step, attrition along the panel waves has to be studied and individuals with higher dropout propensities to be revealed. This information can then be used to correct for non-random selection processes in statistical analysis. Corresponding approaches are described in Sect. 4.
The main issue to start with is the examination of the attrition processes present in the NEPS Starting Cohorts 1 to 6. Concretely, we explore how attrition (final dropouts) distorts the NEPS panel samples with respect to relevant design variables (such as stratification criteria) and panel member characteristics (like sex and birth year). For this purpose, we study the panel status of each panel member–being part of the panel sample vs. final dropout–across all of the panel waves with respect to starting cohort and target population specific characteristics. For consistency reasons, we consider some variables in each of the models (corresponding to the distinct starting cohorts). Each model comprises the region where a person is surveyed (Eastern Germany inclusively Berlin vs. Western Germany), her/his gender (female vs. male), the year of birth, the migration background (target person and/or one of her/his parents are born abroad vs. otherwise)8, and the CASMIN of the father and/or the mother (elementary, secondary, and higher level of education according to length of educational experiences).9 If the percentage of missing values in a variable exceeds 5%, we specify a missing category for this variable, otherwise missing values are imputed.10
We use discrete time event history models (see, e.g., Kalbfleisch and Prentice 2002; Hougaard 2000) to capture the dynamic nature of the attrition process. Discrete time event history models are perfectly suited to this kind of problem. Relevant variables are regressed on whether attrition was observed for a panel member or not in a panel wave. Proceeding this way, the impact of time and individual characteristics are considered simultaneously when modeling propensities for final dropouts. Our modeling approach is also well suited to cope with the unbalanced data structure of our data sets that result due to attrition events in each wave. Ignoring this particularity of the data and generating, for example, a balanced panel data set by considering as risk set only those panel members that remained until the last wave likely gives wrong research conclusions. The reason is that the group of panel members who already dropped out at earlier waves are expected to differ with respect to their composition from that panel members of later waves. For example, highly mobile individuals are more prone to dropout earlier since their contact information may be not valid any longer. 11 All models are specified as proportional hazards model, so called Cox models named according to their inventor (Cox 1972). Hence, in our models the unique effect of a unit increase in a covariate is assumed to be multiplicative with respect to the attrition propensity. To preserve the proportional hazard property–as required by the Cox model–we specify our models as generalized linear models with a cloglog link function.12 All models across all starting cohorts are estimated using the glm function of the statistical software R (R Core Team 2017), see for example Broström (2012). Again, each of the starting cohorts is analysed and described in very detail separately.
3.1 Starting Cohort 1
The SC1 panel sample consists of four waves with surveys in an interval of approximately one year covering the time period 2012 to 2015. Starting from a gross sample of 8483 targets, 3481 individuals responded in Wave 1. The corresponding model with the propensities for participation is given in Würbach et al. (2016, Chap. 4.1). This model contains only a restricted set of explaining variables owing to the fact that very limited information was available in advance from the registration offices (asked for providing information on the target population). These are mainly characteristics of the newborns used for sampling. Additional information from the history of contacts was included. That is, the number of contact attempts was used to control for accessibility. This model indicates only modest selectivity of the participants with respect to the gross sample. Respondents with non-German citizenship show a slightly lower propensity for participation than respondents with German citizenship.
Table 8 documents the results of the selectivity analysis regarding the latest published SUF for the SC1 (Waves 1 to 4). The figures are reported in reference to the panel sample of the SC1 at start (\(N=3431\)). In the SC1 the target population are newborns but the respondents are their legal guardians. It is possible that the contact person changes between two waves, for example, in the first two waves we got all information from the mother and in the last two waves the father participated and gave information (both with panel consent). If there was no change of the contact person, all relevant child and parent data was carried over from previous CATI.
Table 8
Selectivity Analysis for the SC1 Panel Sample along Waves 1–4
Variable
Reference category
Hazard Ratio
p-value
Gender (P)
Female
Male
0.828
0.581
Year of Birth (P)
\({}<1976\)
1976–1980
1.044
0.800
1981–1985
0.967
0.822
\({}> 1985\)
0.891
0.447
Month of Birth (T)
February
March
0.986
0.924
April
0.910
0.558
May
0.682
0.018
June/July
1.093
0.552
Region
Eastern Germany
Western Germany
0.800
0.089
BIK
\({}<50{,}000\) inhabitants
50,000 up to 500,000
1.079
0.609
\({}> 500{,}000\) inhabitants
0.983
0.909
CASMIN (P)
1a, 1b, 2b
1c, 2a
0.864
0.331
2c
0.655
0.006
3a, 3b
0.431
\({}<0.001\)
No information
0.488
0.253
Employment Status (P)
Employed
Not employed
3.859
\({}<0.001\)
No information
0.726
0.729
Migration Background (P)
No
Yes
1.571
\({}<0.001\)
Family Status
Married/life partnership
Divorced/widowed
0.893
0.705
Single
1.084
0.517
No information
11.411
\({}<0.001\)
Numbers of Children in Household
1 child
2 children
0.812
0.066
3 children
0.937
0.691
4 children or more
0.643
0.120
\(N\)
3431
Notes: Dependent variable is attrition (yes or no). (P) parent information, (T) target information.
In case of change, usually the parent data was obtained from the new respondent and thus being updated. This updated information is used for modeling. The remaining missing values are imputed as mentioned above. We considered the residential community size, the employment status and the family status of the reporting parent as well as the number of children in the household as relevant variables to model attrition in SC1. All covariates included were regarded as time invariant, because changes–if at all–are only modest.
In detail, Table 8 reports the hazard ratios for attrition across all of the four waves observed so far. The results show a significant increase in the propensity to drop out from the panel sample when the respondent is currently unemployed or has a migration background (generation status lower than three) compared to their reference categories. Moreover, respondents with a higher level of education have a remarkably lower propensity to be a final dropout. Opposed to respondents with school leaving certificate lower or equal to secondary education without vocational training (reference category), respondents of the groups higher education entrance qualification (with or without vocational training) as well as respondents with university degree or a technical college qualification are significantly more willing to participate. Regarding the household and family structure two further outcomes emerge. Missing information on family status is strongly associated with attrition. In addition, we see a tendency for large families to be more willing to participate. That is, having two or more children in the household increases the propensity to stay in the panel sample, though not being significant. The time effects were highly significant, indicating significant attrition at all of the waves following Wave 1.
3.2 Starting Cohort 2
The SC2 panel sample consists of six waves with one survey every year covering the time period 2011 to 2016. In Wave 1 the SC2 panel sample contains 3007 children from kindergarten. Compared to the gross sample (\(N=4515\)), the panel sample has a lower proportion of children not speaking German at home. Furthermore, the panel sample comprises a lower proportion of children raised by a single parent opposed to children being raised by both parents. The corresponding model with the propensities for participation is given in Steinhauer et al. (2015, Chap. 3.1).
The panel sample of the augmentation subsample K1_AUG (\(N=6341\)) reveals only minor selectivity of participating school children compared to the gross sample (\(N=16{,}784\)). We found that the proportion of children being earlier enrolled for school is slightly lower than in the gross sample, see Steinhauer et al. (2016, Chap. 3.2). Again, the set of variables used for analysing selectivity between the gross and net sample is naturally restricted to the sampling information (because no other information was available in advance). Please note, that no general statements can be made regarding the selectivity apart from this.
Table 9 documents the results of the selectivity analysis regarding the latest published SC2 SUF (Waves 1 to 6), in which all subsamples (KIGA_IND, KIGA_PANEL, K1_AUG) were tested and surveyed again. The figures are reported in reference to the SC2 panel samples at start (\(N=9336\) in total) but separately for each of the three subsamples. The number of explaining variables differs between the subsamples. For the children of the augmentation subsample (K1_AUG) a lot of information from the target as well as the school context is available. We considered the level of urbanization, the funding of the school, the time of enrollment for school as well as the presence of special educational needs as relevant variables to model attrition in the SC2 subsample K1_AUG.
Table 9
Selectivity Analysis for the SC2 Panel Sample along Waves 1–6 (KIGA_Panel/KIGA_IND), and Waves 3–6 (K1_AUG), respectively
KIGA_PANEL
KIGA_IND
K1_AUG
Variable
Reference category
Hazard Ratio
p-value
Hazard Ratio
p-value
Hazard Ratio
p-value
Gender (T)
Female
Male
1.649
0.141
1.158
0.270
1.078
0.457
Year of Birth (T)
2004/05
2006/07
1.101
0.789
1.023
0.884
1.176
0.165
Region
Eastern Germany
Western Germany
1.047
0.913
1.145
0.427
1.716
0.002
Urbanization Level
Rural
Semi-urban
0.412
0.047
–
–
0.974
0.883
urban
0.723
0.471
–
–
1.126
0.499
Funding of School
Private
Public
–
–
–
–
0.619
0.023
School enrollment
Earlier
Later
–
–
–
–
0.764
0.440
Regular
–
–
–
–
0.804
0.307
Special educational needs
No
Yes
–
–
–
–
1.342
0.257
CASMIN (P)
1a, 1b, 2b
1c, 2a
0.945
0.940
0.828
0.341
1.645
0.051
2c
0.806
0.784
0.759
0.223
1.347
0.258
3a, 3b
0.397
0.272
0.642
0.068
0.804
0.433
No information
1.168
0.877
0.548
0.017
2.243
0.282
Migration background (P)
No
Yes
–
–
–
–
0.741
0.033
No information
–
–
–
–
0.489
0.335
\(N\)
576
2419
6341
Notes: Dependent variable is attrition (yes or no). (P) parent information, (T) target information.
Similar manifold information is available for the school children from the subsample KIGA_PANEL. However, due to the small overall sample size (\(N=576\)) and the resulting small case numbers in single cells, some variables were intentionally excluded when modeling attrition for the KIGA_PANEL to increase efficiency. Concretely, this applies to the funding of the school, the level of urbanization, the school enrollment, the special educational needs as well as the migration background of the parent. When modelling attrition propensities in the KIGA_IND subsample, we added the urbanization level to the variables described in the introduction of this section. All covariates included were regarded as time invariant, because changes–if at all–are only modest.
Table 9 reports the hazard ratios for attrition across all six waves observed so far (i.e., Waves 3 to 6 for K1_AUG, respectively) in detail. In all three subsamples targets whose parents have a higher level of education show a remarkably lower propensity to be a final dropout, though, not being significant. Opposed to targets of parents with school leaving certificate lower or equal to secondary education without vocational training (reference category), having parents of the groups higher education entrance qualification (with or without vocational training) as well as having parents with university degree or a technical college qualification significantly increases willingness of the target to participate.
In the KIGA_PANEL subsample the propensity to drop out from the panel sample is significantly decreased for targets living in semi-urban areas opposed to those living in a rural area. For the KIGA_IND subsample only the missing information regarding the CASMIN of the parents shows a significant effect on the panel attrition. However, the effect is counterintuitive because the presence of missingness in the CASMIN is related to a lower propensity for attrition here. The results show that in subsample K1_AUG respondents from Western Germany have a significantly increased propensity to drop out from the panel compared to those from Eastern Germany including Berlin. Regarding the funding of the school and the migration background of the parents we observe positive effects on panel willingness. Children from public schools as well as school children with parents having a generation status lower than three are more willing to participate.
The time effects were highly significant at all waves for the KIGA_PANEL and K1_AUG subsamples, indicating a significant loss of panel members at all of the waves following Wave 1 for KIGA_PANEL, and after Wave 3 for K1_AUG, respectively. The time effects for KIGA_IND are insignificant up to Wave 6. This is not surprising, because KIGA_IND was pending in the Waves 3 to 5.
3.3 Starting Cohort 3
The SC3 panel sample covers seven waves, mostly in an interval of one year, ranging from 2010 to 2016. During this time, 6112 students (subsample G5) have been surveyed and tested from Grade 5 to Grade 10. The 2205 students of subsample G7_AUG have been surveyed and tested from Grade 7 to Grade 10. The relevant design variable used for stratification in both subsamples is the school type in which a student had initially been sampled. The corresponding secondary school types (offering education to students in the Grades 5 to 10) are listed in Table 10.
Table 10
School types in Germany
Abbreviation
German name
Englisch name
FS
Förderschulen
Schools offering schooling to students with special educational needs in the area of learning
FW
Freie Waldorfschulen
Rudolf Steiner schools
GS
Grundschulen
Elementary schools
GY
Gymnasien
Schools leading to upper secondary education and university entrance qualification
HS
Hauptschulen
Schools for basic secondary education
IG
Integrierte Gesamtschulen
Comprehensive schools
MB
Schulen mit mehreren Bildungsgängen
Schools with several courses of education
OS
Schulformunabhängige Orientierungsstufen
Schools only covering the orientation stage
RS
Realschulen
Intermediate secondary schools
Some students changed schools and possibly also school types over the course of the panel. Unfortunately, there is no consistent and complete information on the school type histories of the SC3 panel members available. This is why we stick to the sampling information when modelling attrition propensities. In addition to the individual characteristics described in the introduction of this section, we consider the mathematical competence of a student in Grade 5 and Grade 7 (low, medium, high, and no information) as explanatory model variable. All of the considered covariates are time invariant. This also holds for the mathematical competencies in Grade 5 and Grade 7, incorporated as cross-sectional information into the model because there was no testing in Grade 6. Table 11 shows the results of the respective analysis for the two subsamples of SC3. For the subsample G7_AUG there are no estimates displayed for mathematical competence in Grade 5, because this information is not available by design. Further, there are no estimates given for certain school types (special need schools FS, elementary schools GS, and orientation stage schools OS), because either no students were sampled in the corresponding school type (FS), or the school type does not host any students in Grade 7 (GS, OS). In the first four waves, G5 contains students with special needs sampled in school type FS. Since these students were dismissed from the panel after Wave 4 (cp. Table 4), we excluded them from our analysis. The dominant effect of having no information on several variables on the attrition propensity is obvious, although only relevant for mathematical competence among students of the G5 subsample. Besides that, students of the G5 subsample having good or medium mathematical competence show a smaller propensity to drop out of the panel, compared to students with bad mathematical competencies. The same holds for G5 students who have initially been sampled in OS (school type independent orientation stages). This is because these students had to leave OS after Grade 6, and thus, are individually surveyed. Finally, students from the G5 subsample living in Western Germany have a higher attrition propensity than those living in Eastern Germany (incl. Berlin). Characteristics like gender, age group or the migration background do not affect the attrition propensity in G5.
Table 11
Selectivity Analysis for the SC3 Panel Sample along Waves 1–7 (G5), and Waves 3–7 (G7_AUG), respectively
Subsample G5
Subsample G7_AUG
Variable
Reference
Hazard Ratio
p-value
Hazard Ratio
p-value
Gender
Female
Male
0.879
0.231
1.238
0.275
Year of Birth
1994–1999
2000–2003
1.018
0.870
1.116
0.572
Migration background
No
Yes
1.259
0.073
0.986
0.952
No information
1.180
0.389
1.140
0.650
Region
Eastern Germany
Western Germany
1.951
0.010
2.914
0.010
Mathem. Competence
Bad
In Grade 5
Good
1.317
0.113
-
–
Medium
1.242
0.141
-
–
No information
2.058
0.001
-
–
Mathem. Competence
Bad
In Grade 7
Good
0.651
0.028
0.658
0.157
Medium
0.698
0.041
0.618
0.048
No information
1.831
\({}<0.001\)
0.894
0.830
CASMIN (P)
1a, 1b, 2b
1c, 2a
1.344
0.181
0.647
0.242
2c
1.001
0.998
0.586
0.228
3a, 3b
1.042
0.873
0.138
0.004
No information
1.103
0.658
0.477
0.037
School type
GY
FS
–
–
–
–
GS
0.475
0.069
–
–
HS
0.816
0.280
1.192
0.622
IG/FW
0.798
0.387
1.781
0.155
MB
1.093
0.774
2.006
0.061
OS
0.535
0.028
–
–
RS
1.170
0.273
1.351
0.306
\(N\)
5525
2205
Notes: Dependent variable is attrition (yes or no). (P) parent information. Abbreviations for school types are given in Table 10.
We find that students of the G7_AUG subsample living in Western Germany have a higher propensity to drop out of the panel than students from Eastern Germany (incl. Berlin). Compared to G7_AUG students with bad mathematical competencies, students with a medium mathematical competence have a lower attrition propensity. Students with parents having a high educational background (measured by CASMIN), or no information on the educational background have a higher probability for remaining in the panel sample, compared to students whose parents have a lower educational background.
3.4 Starting Cohort 4
The SC4 panel sample covers nine waves, mostly in an interval of one year, ranging from 2010 to 2016. During this time, 16425 students have been surveyed and tested from Grade 9 onwards. Students get to choose their track of education after Grade 10. Here students can either stay in school, enter the academic track (ACA) and do their A‑levels (Abitur) or they can leave secondary school. In the latter case, students start a vocational training or enter the German transition system. Both groups, vocational training and transition system, are summarized in the vocational track (VOC). The relevant design variable used for stratification is the school type where a student had initially been sampled. Here, all secondary school types listed in Table 10 except elementary schools (GS) and orientation stage schools (OS) apply. Compared to the SC3, in the SC4 more students changed schools over the course of the panel and likely also the school type. Unfortunately, there is no consistent and complete information on their school type history available, which is why we stick to the sampling information. Besides the individual and design characteristics mentioned above, we consider the mathematical competence of a student in Grade 9 (low, medium, high, and no information) as explanatory model variable. Because students change their educational track after Grade 9 we incorporated the educational track as a time-varying covariate into the model. Table 12 shows the results of the respective analysis.
The dominant effect of having no information on several variables on the attrition propensity is obvious, although only relevant for migration background and parental CASMIN. Compared to students in the academic track, students in the vocational track have a higher probability to drop out of the panel sample . This is mostly due to the fact that students in VOC are surveyed and tested individually, so that the peer pressure of testing groups in schools is not present any more, making it easier to refuse. Apart from this, the VOC group of students is more mobile and thus harder to track. We find that the school type has a strong effect on panel attrition. Compared to students who have been sampled in schools leading to upper secondary education (GY), students in other school types are more likely to drop out. Commonly, students in GY stay longer in school as students in other school types (who offer schooling mostly until Grade 10). Accordingly, students who have been sampled in schools dominantly passing their students over the vocational track (i.e., schools for basic secondary education HS, comprehensive schools IG, Rudolf Steiner schools FW, schools with several courses of education MB, intermediate secondary schools RS) have a lower propensity to remain part of the panel, compared to students in schools of upper secondary education (GY).
Students in special need schools (FS) are, compared to students in schools of upper secondary education (GY), less likely to leave the panel sample. This might be due to the fact that these students do not switch or leave their schools. Moreover, male students have a higher propensity to drop out of the panel as compared to female students. Students belonging to the younger part of the cohort have a lower probability to drop out. Concerning the mathematical competence, students with medium or high mathematical competencies are more likely to remain part of the panel sample as compared to students with a lower achievement in the mathematical competence tests. Finally, the parents’ educational background (measured by CASMIN) influences panel attrition. Here, students whose parents have at least a secondary school qualification and a completed vocational training (or higher degrees of education) are more likely to remain in the panel as compared to students whose parents do not have at least a completed vocational training.
Table 12
Selectivity Analysis for the SC4 Panel Sample along Waves 1–9
Variable
Reference
Hazard Ratio
p-value
Gender
Female
Male
1.131
\({}<0.001\)
Year of Birth
1991–1995
1996–1999
0.885
\({}<0.001\)
Migration background
No
Yes
1.007
0.850
No information
1.496
\({}<0.001\)
Region
Eastern Germany
Western Germany
0.747
\({}<0.001\)
Mathem. Competence
Bad
In Grade 9
Good
0.644
\({}<0.001\)
Medium
0.865
\({}<0.001\)
No information
0.981
0.813
CASMIN (P)
1a, 1b, 2b
1c, 2a
0.813
0.004
2c
0.558
\({}<0.001\)
3a, 3b
0.483
\({}<0.001\)
No information
1.502
\({}<0.001\)
Educational Track
Academic
Vocational
7.744
\({}<0.001\)
School type
GY
FS
0.522
\({}<0.001\)
HS
1.389
\({}<0.001\)
IG/FW
1.301
0.001
MB
1.383
\({}<0.001\)
RS
1.387
\({}<0.001\)
\(N\)
16425
Note: Dependent variable is attrition (yes or no). (P) parent information. Abbreviations for school types are given in Table 10.
3.5 Starting Cohort 5
The panel sample of SC5 consists of nine waves with one survey every six months ranging from 2010 to 2015. The first wave sample comprises 17910 students. Relevant design variables are the type of university at which a student started her/his studies (i.e., public or private university, and university or university of applied sciences), whether a student studied with the aim of becoming a teacher13 (i.e., yes vs. no), and whether a student has graduated with a degree allowing for traditional university admission14 (i.e., traditional university admission in Germany, traditional university admission abroad, and nontraditional university admission). The field of study is a further stratification criterion. However, over the course of the panel many students changed their study field (in parts or completely). There is strong evidence that many students who dropped out have changed their study field. Consequently, no current information on their study field is available. Including outdated information into our analysis would give a wrong picture. Thus, we decided to omit it. Clearly, students have also changed universities. However, here we could not find evidence for high incidence. Hence, we included this criterion into our analysis. In addition to the individual characteristics described above, we consider the mathematical competence of a student in the winter semester 2010/11 (low, medium, high in comparison to peers) as explanatory model variable. All of the considered covariates are time invariant.
Table 13 shows the results of the respective analysis. We find significant effects of the birth year, the region, the competence score, and the university type. Younger cohorts (i.e., students born later than 1989) are less likely leaving the panel sample than persons born before 1989. Alike, people studying/having studied in Eastern Germany (incl. Berlin) remain more surely part of the panel sample than those in Western Germany. The same applies to students performing well in the mathematical competence test and to students studying at universities (in comparison to students studying at universities of applied sciences). The latter may be explained by students continuing their studies by a doctorate programme at university. Such programmes do usually not exist at universities of applied sciences. Thus, here the chance is higher that students move and are not any longer accessible. Apart from this we see that students with no information on their university admission are surely dropping out. Moreover, we find strong time effects at all waves, mirroring the significant loss of panel members at all of the nine waves. The strongest effect arises at Waves 8, where for the first time all persons who did not participate in NEPS for a period longer than 2 years were not administered since they had been converted into final dropouts after Wave 7. Furthermore, we find evidence that final dropouts occur more often in CATIs than in CAWIs. Overall, the general tendency of more and more students leaving the panel becomes apparent. The obvious reason for this that in Wave 8 most students have finished their studies and move. Thus, they are hard to access, may lose their interest in the study, and stop participating.
Table 13
Selectivity Analysis for the SC5 Panel Sample along Waves 1–9
Variable
Reference
Hazard Ratio
p-value
Gender
Female
Male
1.000
0.998
Year of Birth
\({}<1989\)
1989/1990
0.898
0.008
>1990
0.881
0.010
Migration background
No
Yes
1.024
0.599
Region
Eastern Germany
Western Germany
1.162
\({}<0.001\)
Mathem. Competence in 2010/11
Bad
Medium
0.868
0.144
Good
0.627
\({}<0.001\)
No information
1.375
\({}<0.001\)
CASMIN Mother
1a, 1b, 2b
1c, 2a
1.025
0.714
2c
0.945
0.460
3a, 3b
0.937
0.543
No information
0.970
0.692
CASMIN Father
1a, 1b, 2b
1c, 2a
0.969
0.707
2c
0.949
0.574
3a, 3b
1.028
0.786
No information
0.933
0.424
Studying for Teacher Degree
No
Yes
0.907
0.024
Public Institution
No
Yes
0.971
0.789
Institution
Univ. of Applied Science
University
0.891
0.006
University admission
Non-traditional
Traditional in Germany
0.890
0.642
Traditional abroad
0.827
0.711
No information
27.48
\({}<0.001\)
\(N\)
17910
Note: Dependent variable is attrition (yes or no).
3.6 Starting Cohort 6
The SC6 panel sample covers in total seven waves with surveys in an interval of approximately one year, ranging from 2009 to 2016. The first wave sample comprises 11649 participants, of these 11932 persons gave their panel consent and thus form the panel cohort at Wave 1 (i.e., ALWA/NEPS1). In Wave 3 the panel sample was augmented by a refreshment sample of 5208 participants (i.e., NEPS3). To comply with the different starting times, the SC6 selectivity analysis is conducted separately for ALWA/NEPS1 and NEPS3. Relevant design variables considered in the analysis as covariates are gender, birth cohort, migration background, whether someone lives in Western or Eastern Germany (incl. Berlin), the size of the residential community, marital status as well as highest educational qualification attained (mapped by the CASMIN classification). Furthermore, the household size, the employment status and the presence of children in the household are taken into account.
The ALWA/NEPS1 model additionally considers the subsample membership (i.e., ALWA or NEPS1). All covariates included were regarded as time invariant, because changes–if at all–are only modest (especially concerning the presence of children in the household).
Table 14 shows the results of the respective analyses separated by the two samples ALWA/NEPS1 and NEPS3. In the ALWA/NEPS1 subsample, the individuals from the oldest birth cohort leave the panel with a higher probability than those of the younger cohorts. Respondents who live in Western Germany are more likely to drop out from the panel than those from Eastern Germany (incl. Berlin). Likewise, leaving the panel is more likely for single and married persons as for widowed or divorced ones. Respondents who live in communities with more than 500,000 inhabitants possess a lower dropout rate than individuals who live at locations with less than 50,000 inhabitants. With increasing educational level, the likelihood of leaving the panel study decreases. Furthermore, children in the household lead to higher panel affinity and three or more household members result in a higher dropout probability.
For the NEPS3 sample, we observe–just like for ALWA/NEPS1–a higher probability of leaving the panel for people of the oldest birth cohort and for respondents living in large households. However, there are also some differences in the effects as compared to ALWA/NEPS1. The educational level and whether someone lives in Western or Eastern Germany does not have any significant effect on the attrition propensity in NEPS3. However, we find that individuals with migration background are more likely to drop out from the NEPS3 panel.
4 Summary and Recommendations for Statistical Analyses
Our selectivity analyses have shown that–over the course of the panel–specific groups of individuals have a higher tendency to drop out from the panel sample than others. All in all, highly mobile target persons (such as students leaving their parental home for university or vocational training), people with migration background, and persons with (or parents with) elementary or lower secondary education have higher dropout propensities than their counterparts. Likewise, people living in the Western part of Germany show a higher probability to leave the panel as compared to those living in the Eastern part inclusively Berlin. Furthermore, persons with low mathematical competence scores and those with missing values have a lower tendency to remain part of NEPS. Further findings of our analyses are ambivalent and differ between the starting cohorts.
Table 14
Selectivity Analysis for the SC6 Panel Sample along NEPS Waves 1–7 (ALWA/NEPS1), and NEPS Waves 3–7 (NEPS3), respectively
ALWA/NEPS1
NEPS3
Variable
Reference
Hazard Ratio
p-value
Hazard Ratio
p-value
Gender
Female
Male
0.965
0.328
0.913
0.118
Birth Cohort
1944–1955
1956–1969
0.737
\({}<0.001\)
0.891
0.142
1970–1979
0.721
\({}<0.001\)
0.757
0.004
1980–1986
0.735
\({}<0.001\)
0.656
\({}<0.001\)
Migration background
No
Yes
1.050
0.295
1.168
0.026
Region
Eastern Germany
Western Germany
1.152
0.004
0.982
0.798
BIK
\({}<50{,}000\) inhabitants
50,000 up to 100,000
0.976
0.706
0.989
0.912
100,000 up to 500,000
0.953
0.313
1.032
0.669
\({}> 500{,}000\) inhabitants
0.898
0.027
0.888
0.133
Family Status
Divorced/widowed
Single
1.243
0.006
1.180
0.152
Married
1.188
0.015
1.011
0.919
CASMIN
1a, 1b, 2b
1c, 2a
0.957
0.494
1.033
0.768
2c
0.769
\({}<0.001\)
0.858
0.228
3a, 3b
0.664
\({}<0.001\)
0.814
0.084
Subsample
ALWA
NEPS W1
1.088
0.101
–
–
Children in Household
No
Yes
0.812
0.004
0.861
0.190
Employment Status
Not employed
Employed
0.964
0.432
0.925
0.267
Household size
1 person
2 persons
1.087
0.186
1.351
0.004
3 persons and more
1.479
\({}<0.001\)
1.776
\({}<0.001\)
\(N\)
11932
5208
Notes: Dependent variable is attrition (yes or no).
We see that the composition of the NEPS cohort samples changes over time. Neglecting this feature in statistical analysis likely yields biased results. As a guideline, we recommend applying non-response adjusted design weights when conducting descriptive statistics. Such weights are provided in the Weights file of the NEPS SUF. However, all of the weights provided refer to the group of people who participated in a wave, not to a subgroup which may be of special interest to answer a particular research question. For coping with a special subsample of a cohort, further non-response weighting might be necessary. For this purpose, a non-response model has to be specified, fitted and adjustment factors have to be derived. For the NEPS, the accordant processing is described in very detail in Steinhauer et al. (2015) as well as in Steinhauer (2014). Concerning regression, we advise to include the stratum information–to account for the unequal selection probabilities in the distinct strata–into the focal model. Furthermore, all variables that have been found to have a significant effect on the attrition probability of the considered sample should be included as explanatory variables. Missing values may be imputed using multivariate equation by chained equation (van Buuren and Groothuis-Oudshoorn 2011) or modelled using the full information maximum likelihood approach (Enders 2010). Both approaches work fine under missing at random (MAR) mechanisms. However, the situation complicates if a missing not at random (MNAR) process must be assumed and the missing probability depends on the missing values themselves. Then, sensitivity analyses have to be performed opposing different MNAR models such as selection and pattern mixture models. For the NEPS data, an accordant study with recommendations for the data users has been conducted by Zinn and Gnambs (2018).
Besides the recommendations listed here, users of the NEPS data are invited to use the NEPSforum (https://forum.neps-data.de/) to ask questions answered by either other NEPS data users or the data providers at the Leibniz Institute for Educational Trajectories.
Acknowledgements
This paper uses data from the National Educational Panel Study (NEPS):
From 2008 to 2013, NEPS data was collected as part of the Framework Program for the Promotion of Empirical Educational Research funded by the German Federal Ministry of Education and Research (BMBF). As of 2014, NEPS is carried out by the Leibniz Institute for Educational Trajectories (LIfBi) at the University of Bamberg in cooperation with a nationwide network.
Open Access This article is licensed under a Creative Commons Attribution 4.0 International License, which permits use, sharing, adaptation, distribution and reproduction in any medium or format, as long as you give appropriate credit to the original author(s) and the source, provide a link to the Creative Commons licence, and indicate if changes were made. The images or other third party material in this article are included in the article’s Creative Commons licence, unless indicated otherwise in a credit line to the material. If material is not included in the article’s Creative Commons licence and your intended use is not permitted by statutory regulation or exceeds the permitted use, you will need to obtain permission directly from the copyright holder. To view a copy of this licence, visit http://creativecommons.org/licenses/by/4.0/.
Publisher’s Note
Springer Nature remains neutral with regard to jurisdictional claims in published maps and institutional affiliations.
In SC1 and in SC2 Wave 1–4 this information stems from one parent. In SC2 Wave 1–4 also information on the target provided by the teacher determines the child as participant.
For reasons of panel stability and because of specific study interests, the rule was adapted from time to time, i.e., not applied consistently in all studies and starting cohorts. More information on this can be found in the study methods reports published together with the SUFs.
Imputation was done by multivariate imputation by chained equation with one repetition step. We used the R package mice for this to do, see van Buuren and Groothuis-Oudshoorn (2011).
Theoretically, our modeling approach can also be used to quantify the wave-specific contribution of each considered regressor on a panel member’s attrition probability. To this end, interaction terms between all of the waves and each regressor have to be build. However, in view of the large number of waves that most of the NEPS cohorts have already passed through it is clear that such endeavour does not yield feasible estimates. The cell sizes for the accordant interaction terms are simply too small. Furthermore, statistical power would be heavily impaired by the high number of interaction terms resulting. At first glance, the use of a separate regression model (e.g. a logit model) for each panel wave may appear to be a way out. However, considering the fact that due to attrition the risk sets differ from wave to wave, the estimated effect sizes of these models are not comparable. Thus, this approach neither helps in providing a useful answer to the question of the wave-specific influence of the considered regressors. One valid way to answer this question would be constraining the set of considered regressors and waves and specifying related interaction terms in discrete time event history models. However, this is another research project that requires more detailed and substantiated theoretical consideration and is therefore not tackled in this article.
It can be shown that there is a direct relationship between the Cox model and a binary dependent variable model with a cloglog link function, see for example Beck (2008).
When establishing the sample, all universities were asked providing information on the admission of their students. Those with nontraditional admission were fully surveyed. Thus, university admission is a design criterion of the SC5 sample.