Financial reporting and investor relations serve important roles as a means of communication between corporate management and the company’s stakeholders, including investors. This chapter outlines why reporting matters, and how it falls short. It also shows how integrated reporting (combining financial, social and environmental value) might be an improvement. Integrated reporting is about understanding how an organisation creates integrated value and how its activities affect the capitals (human, social and natural capitals, next to financial capital) it relies upon for this. Emerging international sustainability reporting standards will spur integrated reporting. Ultimately, integrated reporting is related to integrated thinking, which takes into account the connectivity and interdependencies between the financial, social, human and environmental capitals that affect an organisation’s ability to create integrated value over time. But investors are slow to ask questions about this new information, as their main focus is still on the financials.
Overview
Financial reporting serves an important role as a means of communication between corporate management and the company’s stakeholders, including investors. Companies issue several financial statements, like a balance sheet, a profit & loss account, and a cash flow statement. Financial reporting standards ensure comparability of financial statements issued by different companies. Auditors verify the quality of the provided information, but cannot guarantee that they will always detect misstatements.
Financial statements are primarily based on historical cost and show (see Fig. 17.1 for an overview) financial and manufactured capital, which form a company’s tangible assets. Financial reporting faces the challenge of painting a reliable picture of economic reality, which has become increasingly problematic. In the past decades, complexity has increased and intangibles have become a more important part of a company’s asset base (see Chap. 2).
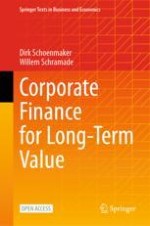
A chart of chapter overview. The first 2 chapters have sustainability unaware. The third chapter has E S G integrated or inward view. The fourth chapter has impact or outward view. The fifth chapter has integrated value.
Fig. 17.1
Chapter overview
×
Anzeige
This chapter outlines why reporting matters, and how it falls short (see Fig. 17.1 for an overview). It also shows how integrated reporting (combining financial, social, and environmental value) might be an improvement. Integrated reporting is about understanding how an organisation creates integrated value and how its activities affect the capitals (human, social, and natural capitals, next to financial capital) it relies upon for this. Emerging international sustainability reporting standards will spur integrated reporting.
Ultimately, integrated reporting is related to integrated thinking, which takes into account the connectivity and interdependencies between the financial, social, and environmental factors that affect an organisation’s ability to create integrated value over time. Some form of integrated reporting is already applied by an increasing number of companies, but it is still far from widespread.
Another component of communication is investor relations. The job of a company investor relations department is to provide investors with an accurate account of company affairs. In addition to annual reports, regular analyst presentations and updates are the main tools to update investors. These presentations are increasing including social and environmental information in addition to financial information. But investors are slow to ask questions about this new information, as their main focus is still on the financials.
Learning Objectives
After you have studied this chapter, you should be able to:
assess the benefits and limitations of financial reporting
analyse financial statements
critically review the role of auditors
explain the corporate investor relations function
assess the emergence and relevance of impact reporting and integrated reporting
illustrate the characteristics of an integrated report
Anzeige
17.1 Financial Reporting and Analysis
Financial reporting matters and is valuable for communication with the outside world, including modelling by analysts. But it is a struggle for financial reporting to meet the needs of users. Intangibles (see Chap. 2), social value, and environmental value are gaining importance but are rarely shown in financial statements. Regulation tries to address this, but its efforts only affect a subset of companies: all public companies and large private companies. Public companies prepare and publish an annual report, as public companies are listed and traded on the ‘public’ stock market. Private companies often prepare an annual report as well, but only large private companies need to publish it. In Europe large companies are defined as companies with more than 250 employees and €20 million in assets. As public companies have difficulties resolving information and agency problems between investors and managers, private companies financed by debt and private equity are gaining in importance (Kahle & Stulz, 2017).
17.1.1 Why Report?
As the joint stock corporation gained popularity in the nineteenth and twentieth century, a need arose to report on performance to shareholders. Over the centuries, accounting has become increasingly sophisticated to facilitate better decision-making, external monitoring, and more complex transactions. Generally Accepted Accounting Principles (GAAP) were developed to make reporting across companies more comparable. While GAAP started at the national level, they are currently set at the international level. This is in line with the global scope of many companies and investors. International Financial Reporting Standards (IFRS) are issued by the International Accounting Standards Board (IASB). IFRS is now the international accounting standard. But there is one major exception. The USA does not recognise IFRS and still uses US GAAP. That means that US companies have to prepare their financial reports according to US GAAP issued by the Financial Accounting Standards Board (FASB). The two standards, IFRS and US GAAP, have converged considerably over recent decades.
Eccles and Saltzman (2011) claim that financial reporting has institutional legitimacy, thanks to a variety of factors:
measurement, reporting, and auditing standards;
effective enforcement mechanisms, including courts of law for redress of fraud in the financial statements;
sophisticated internal control and measurement systems; and
information technologies that enable rapid capture and aggregation of data.
Limits to Financial Reporting
But financial reporting also faces numerous challenges and problems. Figure 17.2 provides an overview. Different user needs make alignment and comparability difficult. Investors tend to be forward-looking, but a significant part of reporting is backward-looking. A board is held accountable for the past but should be prepared for the future. In addition, reporting is focused on manufactured (i.e. physical) and financial assets, not intangibles (see Chap. 2). As Lev (2017) puts it: ‘strategic assets are very different from the kinds of assets that are reported by accountants on corporate balance sheets’. Strategic assets are exactly the ones that bring competitive advantage. For example, Microsoft’s competitive advantages lie in its patents, its proprietary software and its people. But those are not on Microsoft’s balance sheet.
An illustration lists 6 limits to financial reporting. Difficulty in dealing with diverse user needs. Poor comparability. Backward-looking versus forward-looking needs. Focused on manufactured and financial assets, not intangibles. Inconsistencies in regulation. Focus on compliance.
Fig. 17.2
Limits to financial reporting
×
Moreover, there are differences and inconsistencies in reporting, such as different ways for recording items like sales and inventories, while intangibles are sometimes capitalised and reported as assets, but most often not or only partially. This means that important sources of corporate value creation are often not reported. Also, some aspects of reporting are mandatory while others are voluntary. And there are differences in regulation between countries and institutions. Complexity makes it hard to understand reports and often makes them very long.
Eccles and Saltzman (2011) point to the difficulty of finding the most relevant information, the time lag in issuing reports, and the scarcity of information about the risks being taken by the company to create value for shareholders. Moreover, they argue that ‘questions about whether a financial report presents a ‘true and fair view’ of a company cannot be adequately answered, because the reports do not always contain information on nonfinancial performance that can determine a company’s long-term financial picture’.
Financial reporting has improved over the past two decades. There is empirical evidence indicating that investors’ focus on earning announcements has increased since the 2000s, partly due to increased management guidance, disclosure quality, and analyst activity (Beaver et al., 2020).
From the turn of the century, more and more companies started to publish stand-alone corporate social responsibility (CSR) reports. Dhaliwal et al. (2011) find that such companies have lower analyst forecast errors, indicating not just better nonfinancial reporting, but better financial reporting as well. Section 17.3 discusses the advance to integrated reporting, which covers financial as well as nonfinancial (i.e. sustainability) information in a single integrated report.
Financial reports have become complex and difficult to read. This is partly due to compliance with accounting standards. Nevertheless, financial reporting has a central role in communications with investors and analysts. It is in the interest of a company’s management to prepare readable reports. Analysts indicate that the quality of reporting directly influences their opinion of the quality of management.
Financial statements aim to give the user insight into the financial position and performance of a company. They consist of the balance sheet, income statement, cash flow statement, and a statement of changes in equity, which provide past performance information on a company in a standardised format. In addition, financial reports make a segment analysis by business categories and geographical regions to link the financial information more specifically to the company’s activities.
A key concept of reporting is materiality. Materiality is the degree to which certain issues are important for a company. The need to disclose individual items or groups of items separately depends on the nature and the amount of the item. The deciding factor is whether the omission or misstatement could influence the economic decisions that users make on the basis of the financial statements.
Financial reports are meant to be read and analysed by financial analysts and others. Financial statement analysis is the process of reviewing and analysing a company’s financial statements by external stakeholders, in which they calculate financial ratios to gain insights in the company’s ability to generate value.
Internal stakeholders use more detailed internal reports to monitor and improve efficiency and to provide the basis for external reporting. As discussed before, financial statements (almost)1 only reflect historical information, but they can be useful by discovering trends over the years. The number of total sales in 2020 might not be very informative, but the relative change over the years 2010–2020 indicates whether the company is consistently growing, for example. Figure 17.3 shows five categories of financial ratios: profitability, liquidity, leverage, efficiency, and valuation ratios. These are described in more detail in the Appendix.
A block diagram lists 5 types of financial ratios. Profitability ratios like E B I T and R O A. Liquidity ratios like current and quick ratios. Leverage ratios like debt-to-assets, and debt-to-equity ratios. Efficiency ratios like asset turnovers. Valuation ratios like price-earning ratios.
Fig. 17.3
Categories of financial ratios
×
In this section, we review companies’ main financial statements in turn:
the balance sheet;
the income statement, also called the profit & loss (P&L) account;
the cash flow statement.
For all the three, we briefly summarise their components, discuss their limitations, and show some ratios that help in analysing them.
Balance Sheet
The balance sheet, or statement of financial position, lists a company’s assets and liabilities. The difference between assets and liabilities is a company’s net worth, which is called equity. The balance sheet identity is as follows:
Table 17.1 provides the balance sheet of Inditex, the fast-fashion retailer figuring in the case study of Chap. 11. Assets are shown on the left side of the balance sheet. A company’s assets are split between long-term assets and current assets. Examples of long-term assets are property, plant and equipment (PPE), investments and intangible assets (e.g. goodwill or R&D as described in Chap. 2).
Please note that intangible assets are intangible resources that are capitalised in the balance sheet; most intangible resources are not capitalised, as there are strict rules for capitalising intangibles to avoid inflating the balance sheet. While purchased R&D in a merger can be capitalised, internal R&D expenses cannot be capitalised and have to be taken in the income statement as expenses (though there are some exceptions, such as development expenditures). The argument is that the value of internal R&D is not tested in the market, while the value of purchased R&D is established in a market transaction.
Table 17.1
Inditex balance sheet (2020)
A table titled Inditex group, consolidated income statement. It lists the values for 2020 and 2019. The values of net profit and earnings per share are at the bottom.
Current assets represent all the assets of a company that are expected to be sold or used through standard business operations within 1 year. Examples are inventories (goods to be sold), accounts receivable (good and services sold, but not yet paid), and cash held at the bank.
Liabilities
On the right side of the balance sheet, the liabilities are shown. Again, there is a split between long-term and current liabilities. Long-term liabilities include long-term debt with a maturity over 1 year, deferred taxes and provisions. Provisions are funds set aside by a company as assets to pay for anticipated future losses. An example is a provision for pensions. Liabilities can also reflect a company’s future service obligations (contract liabilities).
Current liabilities include short-term debt with a maturity of 1 year or less and accounts payable. The difference between a company’s current assets and current liabilities is the company’s net working capital. The net working capital is the capital available in the short term to run the business. It is a measure to gauge a company’s short-term health. Net working capital is defined as follows:
Inditex has a positive net working capital of €10,957 − €6338 = €4619 million (or €4.6 billion).
Equity
Equity is the difference between a company’s assets and liabilities (see Eq. 17.1). This accounting measure of equity reflects the book value of equity.2 The balance sheet gives an incomplete picture of a company’s equity value for various reasons (see Fig. 17.4). First, it is not meant to give the equity value, but to reflect the shareholders’ investment in the company. Valuation is up to the shareholders themselves. Second, several assets, like buildings, are at historical cost net of depreciation. The actual current value is likely to be higher. Third, several intangible resources, like brand value, are not capitalised on the balance sheet as intangible assets. Fourth, many valuable assets and liabilities are not on the balance sheet. An important one is human capital, which is both the expertise of the company’s employees and the quality of the company’s management. The relationships with customers and suppliers and the damage done to the environment are also not recorded on the balance sheet.
An illustration of a simplified balance sheet and its distortions. Assets are on the left side and liabilities are on the right side of the balance sheet. Equity is equal to the balance of assets and liabilities. Assets and liabilities tend to be understated. Equity is likely to be distorted.
Fig. 17.4
A simplified balance sheet and its distortions
×
The book value of equity is therefore likely to deviate from the market value of equity. The market value of equity is a company’s market capitalisation and depends on what investors expect a company’s assets to produce (or earn) in the future. Eq. (9.15) from Chap. 9 indicates that the total market value of a company’s equity is the number of shares outstanding times the market price per share:
Note, however, that this formula describes the calculation of the market value of equity, but not its drivers, which are investors’ expectations. Example 17.1 shows the difference between the market and book value.
Example 17.1 Market and Book Value
Problem
Inditex has 3.11 billion shares outstanding. These shares trade at €26.4 on 31 December 2020. What is Inditex’s market capitalisation? How does Inditex’s market cap compare to its book value of equity in 2020?
Solution
Using Eq. (17.3), Inditex market capitalisation is:
Inditex’s market capitalisation at €82.1 billion is far higher than Inditex’s book value of equity at €14.6 billion (taken from Table 14.1).
The market-to-book ratio (also called price-to-book ratio) is a valuation metric used to evaluate a company’s current market value relative to its book value:
The difference between market value and book value reflects expected abnormal or residual profitability. A market-to-book ratio above one suggests that the company is expected to generate residual profits in the future. In contrast, a value below one indicates a negative residual profit expectation.
Inditex’s market-to-book ratio is €82.1 billion/€14.6 billion = 5.62. So, investors are prepared to pay 5.62 times the amount of Inditex’s book value per share. The market value is typically higher than the book value of a company’s equity, as explained above. So, market-to-book ratios are often larger than one. Nevertheless, underperforming companies or sectors can have a market-to-book ratio below one. An example is the European banking sector after the Global Financial Crisis of 2007–2009 and the European Sovereign Debt Crisis of 2010–2015. In June 2022, European banks were trading at low market-to-book ratios, for example with BNP Paribas at 0.45, Banco Santander at 0.47, and ING at 0.63.3 Similar to the market-to-book ratio, one could compute leverage ratios (such as in Chap. 15 and in the Appendix to this chapter), including hybrid ratios that combine balance sheet items with items from the income or cash flow statement. An example of such a ratio is the Net Debt/EBITDA ratio, where the numerator consists of balance sheet items (debt minus cash) and the denominator consists of income statement items (operating income plus depreciation and amortisation).
Enterprise Value
As explained in Chap. 9, the enterprise value is the market value of the company’s underlying business before financing by equity and debt and separate from any cash holdings. Equation (9.1) provides the enterprise value:
The enterprise value of Inditex is €82,104 + €4882 − €7398 = €79,588 million. Debt is long-term debt of €3 million and other long-term liabilities of €4879 million, obtained from Table 17.1. The enterprise value is usually higher than the market value of equity due to large debt holdings. But it is not uncommon for family-controlled companies, like Inditex, to have low debt (only €4882 million in the case of Inditex), as investments are typically financed through retained earnings. The enterprise value (EPV) is also used in valuation ratios (see the Appendix), such as EPV/EBITDA.
Income Statement
The income statement, or profit and loss (P&L) account, lists a company’s revenues and expenses (i.e., the costs attributed to the year covered by the P&L). It provides a picture of a company’s performance over the past year. Table 17.2 shows Inditex’s income statement for 2020. The key metrics are earnings before interest and taxes (EBIT) and net profit. EBIT (also called the operating profit) is defined as follows:
EBIT measures a company’s profitability from its operations before financing and taxes. It is widely used to gauge a company’s basic profitability. Its relative version, the EBIT margin (=EBIT/sales), is the favourite metric for comparing the performance of companies within the same industry (see Eq. 17.9 in the Appendix). During 2020, Inditex sold goods worth €20,402 million. The total cost of these sales and operating expenses was €9013 + €6838 = €15,851 million. In addition to these out-of-pocket expenses, Inditex deducted €3045 million for the use of fixed assets in the production process. The result is Inditex’s EBIT at €1507 million over 2020, and an EBIT margin of 7.4% (=€1507/€20,402), which was well below its long-term average.
The net profit shows the profit net of interest payments and corporate taxes. During 2020, Inditex’s interest payments was €106 million due to its low debt (see Table 17.1) and corporate taxes amounted to €297 million. Inditex’s net profit is €1104 million over 2020. Net profit is the amount available for shareholders (see Chap. 16 on payouts). The bottom line in Table 17.2 shows Inditex’s earnings per share (EPS), which is net profit divided by the number of outstanding shares.
Table 17.2
Inditex income statement (2020)
A table titled Inditex group, consolidated income statement lists the values of 2020 and 2019. Gross profit, operating profit, profit before taxes, net profit, and earnings per share are highlighted.
Cash Flow Statement
The balance sheet and income statement are prepared according to accounting standards, like the IFRS. These accounting standards leave room for discretion, as they should. Management can inflate (or deflate) the company’s financial position and performance to smooth profit over the years. That is why investors want to see the underlying cash flows which are not sensitive to accounting policies. Or, as popularly put: ‘Cash is king’.
Table 17.3 shows an example of a cash flow statement. In the case of Inditex, the cash flow statement indicates that Inditex’s cash position improved with €2618 million calculated as the difference between cash at the end of the year €7398 million and cash at the beginning of the year €4780 million. Inditex’s income statement shows a profit of €1104 million. The profit is thus underpinned by an even larger cash improvement.
The cash flow statement has three sections:
Cash from operating activities;
Cash from investment activities;
Cash from financing activities.
Table 17.3
Inditex cash flow statement (2020)
A table titled Inditex group, consolidated cash flow statement lists the values for 2020 and 2019. Cash from operating activities, cash from investment activities, cash from financing activities, and cash at the end of the year are highlighted.
Major differences between the income statement and the cash flow statement are typically caused by a company’s investment and financing activities, and accounting policies. On the investment side, amortisation and depreciation are booked as costs and thus reduce profit. But they do not reduce cash, as the assets have been paid for earlier. By contrast, capital expenditures reduce cash now, but do not yet reduce current profit (only in the future when depreciation starts). At Inditex, depreciation has recently been much higher than capex, which indicates that Inditex is investing less in the future of its business.
The influence of accounting policies is through the line-item amortisation and depreciation. By adjusting accounting policies (for example, increasing depreciation because assets have a shorter lifetime), a company can change its profit (in this example, reducing profit). Another influence is through other non-cash gains/losses (e.g. restructuring costs) and changes in working capital.
On the financing side, major changes in cash can be caused by an increase or decrease in net debt. In contrast, this has only a minor impact on the income statement through increased or reduced interest payments. It should be highlighted that accounting requires management to make many estimates, for example on expected losses and cash flows from intangibles.
17.2 Audits and Investor Relations
This section discusses the auditing of financial statements and investor relations.
17.2.1 Audits
How do we know to what extent a company is truthfully reporting? In accounting, this question is put as follows: do the financial statements give a ‘true and fair’ view of a company’s financial position? Publicly listed companies are required to have their financial statements reviewed or audited by an auditor. An auditor is a chartered accountant that is qualified to audit financial statements. Box 17.1 lists the largest accounting firms, the so-called Big Four. There are limits to what auditors can achieve. The auditor’s objectives are to obtain reasonable assurance about whether the financial statements as a whole are free from material misstatement (due to fraud or error) and to issue an auditor’s report that includes the auditor’s opinion.
There are two levels of audit assurance:
Reasonable assurance is a high level of assurance, but is not a guarantee that an audit will always detect a material misstatement when it exists. Misstatements can arise from fraud or error and are considered material if, individually or in the aggregate, they could reasonably be expected to influence the economic decisions of users taken on the basis of these financial statements.
Limited assurance is a lower level of assurance, whereby the auditor collects less, but sufficient, evidence for a negative form of its conclusion: ‘Based on the procedures performed, nothing came to our attention to indicate that the management assertion on XYZ is materially misstated’. The auditor achieves this by performing fewer tests or using smaller sample sizes for the tests performed than those for reasonable assurance.
Reasonable assurance is required for mandatory reporting on the basis of (international) reporting standards, such as IFRS and FASB in the USA. Limited assurance is typically used for voluntary reporting, for example on sustainability risks and opportunities (see Sect. 17.3).
Box 17.1 The Big Four
The Big Four is the nickname for the four largest accounting firms. Until the late twentieth century, the auditing market was dominated by the Big Eight. Strong competition led to a major consolidation with mergers between these firms as well as the 2002 collapse of Arthur Andersen (see below at accounting scandal).
The Big Four are:
Deloitte;
EY;
KPMG;
PwC.
The auditor evaluates the appropriateness of accounting policies applied and the reasonableness of accounting estimates made by a company’s directors. A key element is the auditor’s judgement on the appropriateness of the directors’ use of the going concern principle. The going concern principle assumes that during and beyond the next reporting period a company will complete its current plans, use its existing assets, and continue to meet its financial obligations. If the auditor concludes that a material uncertainty about the going concern basis exists, the auditor is required to draw attention in their report to the related disclosures in the financial statements or, if such disclosures are inadequate, to modify their opinion (see below).
The auditor’s opinion is the main instrument for an auditor to inform financial statement users about his findings. It also gives him power towards a company’s directors, when directors are dressing up financial statements to make them look better or are not providing the auditor with sufficient information to form an opinion. A modified audit opinion is taken very badly by financial markets. It often triggers a strong decline of the company’s stock price and could even lead to a temporary trading suspension of the company’s stock until the company provides further clarification and information.
During the audit, the auditor needs to obtain sufficient audit evidence about a company’s financial position to form an opinion. There are three categories for an auditor’s opinion:
An unmodified opinion is expressed when the auditor is able to conclude that the financial statements give a ‘true and fair’ view of the company’s financial position and comply in all material respects with the applicable financial reporting framework;
A modified opinion can be given in two ways:
A qualified opinion is given when misstatements are material but not pervasive to the financial statements;
An adverse opinion is given when the auditor concludes that misstatements, individually or in the aggregate, are both material and pervasive to the financial statements.
Sometimes the auditor does not sign off the financial statements at all. For example, KPMG refused to sign off the 2021 financial results of German real estate group Adler, ‘in a rare move that pushes the embattled group into an ever deeper crisis’, the FT reported.4
Accounting Scandals
As explained above, auditors cannot guarantee the reliability of financial statements. They can at most provide reasonable assurance about the ‘true and fair’ view of a company’s financial position. A big accounting scandal involved Enron, an energy company based in Houston, Texas. The collapse of Enron in 2001, the largest corporate bankruptcy at the time in American history, involved the use of accounting loopholes, special purpose entities, and poor financial reporting (see Box 3.1). In that way, management (i.e. the CEO and the CFO) of the energy company was able to hide billions of dollars in debt from failed deals and projects. These practices inflated Enron’s accounts and performance.
Another big accounting scandal concerned Wirecard, a payment processor and financial services provider based in Munich, Germany. The company was part of the DAX index (the German stock market index). Allegations of accounting malpractices culminated in 2019 when the Financial Times published whistle-blower complaints and internal documents. In June 2020, Wirecard filed for insolvency after revealing that €1.9 billion was missing, and the arrest of its CEO. Questions were raised about regulatory failure of the German supervisor, BaFin, and possible malpractice of Wirecard’s long-time auditor EY.
The bankruptcy of Enron led to the closure of its accountant, Arthur Andersen. The US Securities and Exchange Commission (SEC) started an investigation of Enron’s collapse. Arthur Andersen was found guilty of illegally destroying documents (i.e. putting them in the shredder) relevant to the SEC investigation. The SEC revoked Arthur Andersen’s licence to audit public companies and effectively closed the auditing firm.
As a consequence of the Enron scandal, the Sarbanes–Oxley Act was passed by US Congress to expand the accuracy of financial reporting for public companies. This Act contained standards for external auditor independence as well as standards for executive management to take individual responsibility for the accuracy and completeness of company financial reports. On the latter, the company’s principal officers—typically the CEO and the CFO—have to sign the company financial reports, approving the integrity of the reports. In Europe, EU Directives were adopted that achieve similar goals of auditor independence and management responsibility.
Evolution of the Auditor’s Role
The Sarbanes-Oxley Act also started a global movement to put more emphasis on the role of the auditors themselves. Across all major jurisdictions, auditors are now regulated and supervised. The expansion of financial reporting to integrated reporting (discussed in Sects. 17.3–17.5) can significantly expand the role of the auditor, as the expanded reporting standards are subject to mandatory reporting.
17.2.2 Investor Relations
The investor relations (IR) department within a company is tasked with keeping current and prospective investors informed about the company’s financials, strategy, operations, etc., so that investors can make well-informed investment decisions and hold company management accountable for its performance. The investor relations department typically reports to the CFO. At small companies, there is often no formal investor relations department and the function is then filled by the CFO.
Investor relations is involved in publishing the annual report, quarterly or semi-annual reports and other externally oriented material. It organises meetings with investors in which presentation material is used, which is subsequently published on the company’s IR website. For example, the CEO, CFO, or head of IR might go on a roadshow to visit investors in several countries. In addition, IR might organise conference calls on the quarterly or annual results. These are often mainly addressed to sell-side analysts, which are not the investors themselves, but advisors to institutional investors (the buy-side). Figure 17.5 provides an overview of the points typically covered in IR presentations.
An I R presentation lists 4 points. Pitch, why invest in this company? Key products and markets, the company’s competitive edge, and challenges. Looking back to recent earnings history, product introductions, and actions. Looking forward to plans, prospects for growth, or cost cutting.
Fig. 17.5
Typical points made in an IR presentation
×
For example, BMW starts its December 2022 investor presentation with a slide (Fig. 17.6) that asks and answers the question: why invest in BMW? In this 70-page presentation, BMW goes on to discuss its strategy (slides 3–5); its approach to sustainability (slides 6–10); its transformation to becoming a producer of electric vehicles (slides 11–28); digitalisation (slides 29–37); and financial performance (rest of the deck), including sales by segment and geography, market shares, and financial policy (e.g. payout policy, capex).
An illustration of the B M W investor presentation slide. It has details on 6 topics. First-class individual mobility. Sustainability. Innovation and flexibility. Electrification. Digitalization. Financial performance.
Fig. 17.6
BMW investor presentation slide. Source: Adapted from BMW investor relations presentation
×
17.3 Sustainability-Related Financial Reporting
Companies started to issue corporate social responsibility reports in the 1990s. However, these stand-alone reports were mainly read by stakeholders, such as employees, governments, and NGOs, while investors kept focusing on the company’s financial reports. More recently, sustainability is entering financial reports.
This section discusses the inclusion of social and environmental factors that affect financial risks. This single materiality dimension looks at the effect of social and environmental risks on financial and enterprise value and still has an investor focus (the inward view, see Fig. 17.9 below). Section 17.4 analyses impact reporting, which looks at the impact of the company on society and nature and has a stakeholder focus (the outward view).
17.3.1 IFRS Sustainability Standards
Sustainability reporting itself is in transition. Several voluntary reporting initiatives, such as the Task Force on Climate-related Financial Disclosures (TCFD, 2017), the Sustainability Accounting Standards Board (SASB), and Integrated Reporting (<IR>), were consolidated in the International Sustainability Standards Board, a new body of the IFRS, in 2021. Figure 17.7 shows that the IFRS now has two bodies: the International Accounting Standards Board (IASB) and the new International Sustainability Standards Board (ISSB).
A block diagram of I F R S bodies and standards. It includes the I A S B with I F R S standards and I S S B with the I F R S sustainability standards.
Fig. 17.7
IFRS bodies and standards
×
Just like the IFRS standards (see Sect. 17.1), the new IFRS sustainability standards are mandatory, part of financial reports and subject to audit control. The IFRS focus remains on informing investors. The IFRS sustainability standards contain disclosure requirements for sustainability information relevant for the company’s financial value—the single materiality dimension.
IFRS has issued 2 standards in 2023:
1.
IFRS S1 General Requirements for Disclosure of Sustainability-related Financial Information (general sustainability standard)
The first standard (IFRS S1) sets the general framework for disclosure of sustainability risks and opportunities related to the company’s financial value. Subsequent standards provide more detailed requirements on specific topics. Unsurprisingly, the first specific standard (IFRS S2) relates to climate disclosures.
The general sustainability standard (IFRS S1) requires that a company shall provide disclosures about:
(a)
governance—the governance procedures the company uses to monitor and manage sustainability risks and opportunities;
(b)
strategy—the approach for addressing material sustainability risks and opportunities that could affect the company’s strategy and business model over the short, medium, and long term;
(c)
risk management—the processes the company used to identify, assess, and manage sustainability risks; and
(d)
metrics and targets—information used to assess, manage, and monitor the company’s performance in relation to sustainability risks and opportunities over time.
Interestingly, the required disclosures go beyond providing the relevant metrics and targets. In line with the set-up of this book, the governance (Chap. 3), strategy (Chap. 2), and risk management (Chap. 12) of sustainability risks and opportunities must be incorporated in the new disclosures. The general sustainability standard requires the disclosure of sustainability-related risks and opportunities over the short, medium, and long term. This fosters thinking, and hopefully acting, in terms of long-term value creation. Box 17.2 explains how IFRS defines sustainability topics.
Box 17.2 Disclosure of Sustainability Topics: Taking Industry Context into Account
IFRS builds on the industry-based SASB Standards. With a focus on how sustainability affects value creation, the SASB Standards vary by industry, based on the different sustainability risks and opportunities within an industry. The SASB Standards identify the subset of environmental, social, and governance issues most relevant to financial performance and enterprise value for 77 industries.5
To highlight the differentiation across industries, we give three examples of material topics in an industry. The third example shows that some industries have more material sustainability topics than other industries.
Industry (77 in total, 3 given here)
Material topics identified per industry
Apparel, accessories, & footwear
• Management of chemicals in products
• Environmental impacts in the supply chain
• Labour conditions in the supply chain
• Raw materials sourcing
Hotels and lodging
• Energy management
• Water management
• Ecological impacts
• Labour practices (including average hourly wage)
• Climate change adaptation
Materials & mining
• GHG emissions
• Air quality
• Energy management
• Water management
• Waste & hazardous materials management
• Biodiversity impacts
• Human rights (including those of indigenous people)
• Community relations
• Labour relations
• Workforce health & safety
• Business ethics
• Tailings storage facilities management
IFRS S2
The IFRS S2 climate-related disclosures standard follows the same format of IFRS S1 (governance, strategy, risk management, and metrics/targets), but goes one step further with more detailed requirements for the disclosure of several climate topics (see Fig. 17.8). These topics are discussed throughout this book, such as Scope 1, 2, and 3 GHG emissions in Chap. 5, scenario analysis in Chap. 12, shadow or internal carbon prices in Chap. 5, and management remuneration linked to climate targets in Chap. 3. The good news is that companies have to disclose information on these topics.
On the targets, companies have to report in relation to the planetary boundary of climate change: is a company aligned with the 1.5 °C or 2 °C global warming limit of the Paris Agreement, or is a company aligned with a 3 °C limit?
An illustration lists 7 climate-related disclosure requirements as follows. Scope 1, 2, and 3 G H G emissions. Scenario analysis. Transition and physical risks. Climate-related opportunities. Internal carbon prices. Climate targets. Percentage of management remuneration.
Fig. 17.8
Climate-related disclosure requirements in IFRS S2
×
These detailed requirements allow investors and other stakeholders to make a thorough assessment of a company’s weaknesses and strengths on climate. Box 17.3 provides an example of disclosure on a company’s strategy for stranded assets. These are assets that are ‘stranded’ due to unanticipated or premature write-downs (e.g. a coal-powered steel factory becomes stranded when the use of coal is prohibited or becomes too expensive due to a high carbon tax; see Chap. 2). The detailed requirements will allow for a better calculation of the company’s environmental value by outsiders, which was hitherto very hard to do. Remember the difficulties we experienced in finding the Scope 3 GHG emissions for Inditex in Chap. 11.
Box 17.3 Strategy for Stranded Assets
The strategy section of IFRS S2 has detailed requirements for disclosing information about the effects of material climate-related risks and opportunities on a company’s strategy and business model, including its transition plans. It covers, for example, information on legacy assets, which this book calls stranded assets. This information on legacy assets must include strategies to manage carbon-energy-intensive and water-intensive operations and to decommission carbon-energy-intensive and water-intensive assets.
Current efforts to report on social and environmental topics are already labelled as ‘integrated reporting’ by the industry. Section 17.3.2 provides a frontrunner example of such ‘integrated reporting’ by AkzoNobel. Nevertheless, it is still investor focused. Real integrated reporting (Sect. 17.5) focuses on all stakeholders (including investors) and is based on double materiality: financial materiality (effect on financial value) and impact materiality (impact on society and nature).
17.3.2 Sustainability Reporting Company Case Study
AkzoNobel, a large Dutch paints and coatings manufacturer, provides an example of voluntary reporting on social and environmental topics in its annual report. Under the headings People, Planet and Paint, AkzoNobel provides detailed numerical information on material topics, including some targets for 2025. The external auditor has given limited assurance (see Sect. 17.2) on most of the reported topics. Table 17.4 shows AkzoNobel’s sustainability performance summary. In line with best practice, AkzoNobel does provide information not only on its own operations, but also on its contractors in the supply chain and its products. In this way, investors (and other stakeholders) can analyse the sustainability risks and opportunities of AkzoNobel’s business model.
The information is industry-specific with a focus on work health and safety, gender diversity, and community training on the social side and carbon emissions, waste, and freshwater usage on the environmental side. AkzoNobel also shows to which extent its products contribute to sustainable solutions: 39% in 2021 with more than 50% as target for 2025. On the one hand, this information is relevant to assess how future-proof AkzoNobel’s business model is. On the other hand, it is also vague and hard to compare with other companies, since there are no standards for contributing to sustainable solutions.
In line with best practice, AkzoNobel reports absolute carbon emissions and relative carbon emissions (per ton of production). Scope 1 and 2 emissions amount to 0.237 million tons, while Scope 3 emissions form the bulk of AkzoNobel’s emissions with 14.7 million tons: 98% of total emissions (see Chap. 5 on Scope 1, 2, and 3 emissions). The historical pattern shows that AkzoNobel’s absolute emissions are still increasing from 13.8 million tons in 2019 to 14.7 million tons in 2021. So, AkzoNobel has some work to do to reduce its carbon emissions by 55% in 2030 and to net zero in 2050 (the commonly used targets in Europe). The two indicators, sustainable solutions and Scope 3 emissions, give opposite signals. This is a typical topic for investor relations. Analysts could ask the company to explain the improvement in sustainable solutions, while carbon emissions (a key indicator of sustainability) are still rising.
While AkzoNobel’s reporting is advanced, it still does not give sufficient information to assess the company’s value creation and destruction for society and nature—just like in the case of Inditex, discussed in Chap. 11. AkzoNobel is still able to select the topics on which it reports; human rights breaches are, for example, absent in its sustainability performance report.
A table has 3 sections. The column headers are people, unit, 2017, 2019, 2021, and ambition 2025 in section 1, planet, unit, 2017, 2019, 2021, and ambition 2025 in section 2, and paint, unit, 2017, 2019, 2021, and ambition 2025 in section 2.
17.4 Impact Reporting
Before discussing impact reporting frameworks, this section highlights convergence in reporting on social and environmental issues.
17.4.1 Convergence in Reporting
Whereas sustainability-related financial reporting in Sect. 17.3 takes the inward perspective (how does E and S affect company value?), impact reporting adopts the outward perspective (how does the company affect E and S?). Figure 17.9 (reproduced from Chap. 2) illustrates the concept of double materiality with financial materiality (inward) and impact materiality (outward).
At the time of writing (2023), there are multiple voluntary sustainability reporting frameworks (mentioned in Sect. 17.3 and in this section). Convergence towards mandatory reporting is very welcome to enable comparability. In terms of actually reported metrics by companies, we observe a convergence of the underlying social and environmental factors used for financial and impact materiality, mostly because outward issues are increasingly seen as inwardly relevant as well. This is good news in itself, and it reduces the reporting burden for companies that are subject to multiple reporting regimes.
The inward focus, which looks at sustainability topics relevant for the financial value of the company, is rapidly expanding because of increased internalisation of social and environmental factors by companies. An emerging example is biodiversity loss, which has always been a key indicator for nature and is now entering company sustainability-related financial reporting (Kennedy et al., 2023). Other examples include work health & safety and living wage.
Figure 17.10 shows the expanded list of material factors for the inward perspective. Some topics remain on the fringe, such as human rights. NGOs, like Amnesty International, have been campaigning for human rights since the 1960s (outward perspective), but companies have until now refused to report on human right violations in the supply chain (inward perspective). Such company reporting would, of course, raise awkward questions about why companies continue to let these violations happen in the first place. That highlights the need for mandatory reporting on these topics.
An illustration of double materiality of social and environmental factors. The business and financial value impacts the society and nature. The society and nature's dependencies are on business and financial value.
Fig. 17.9
Double materiality of social and environmental factors
An illustration. 1. Inward focus includes G H G emissions, labor practices, and business ethics with the outward focus on a broad range of material topics. 2. Inward focus includes biodiversity loss, use of scarce resources, and work health with the outward focus on topics like human rights
Fig. 17.10
Expanding list of material topics under inward perspective
×
×
Where the IFRS Sustainability Standards are based on single materiality (inward focus), the European Sustainability Reporting Standards (ESRS) adopt double materiality combining the inward and outward focus. Box 17.4 provides an overview of the European standards.
Box 17.4 European Sustainability Reporting Standards (ESRS)
The Corporate Sustainability Reporting Directive (CSRD) introduces European Sustainability Reporting Standards (ESRS) for disclosure of a company’s sustainability performance. These standards go two steps further than the IFRS Sustainability Standards. First, they are based on double materiality—both the financial and impact materiality. Second, they are far more detailed. Whereas IFRS has so far published only one topical sustainability standard on climate (see Sect. 17.4), the CSRD has a whole range of topical sustainability standards on environmental, social, and governance topics. Each of these topical standards contains detailed disclosure requirements. The ESRS require limited assurance for the first years of implementation (starting in 2024/2025) and reasonable assurance thereafter.
Overview European Sustainability Reporting Standards (ESRS)
Cross-cutting standards
ESRS 1
General requirements
ESRS 2
General disclosures (governance, strategy, risk management, and metrics and targets)
Topical standards—environment
ESRS E1
Climate change
ESRS E2
Pollution
ESRS E3
Water and marine resources
ESRS E4
Biodiversity and ecosystems
ESRS E5
Resource use and circular economy
Topical standards—Social
ESRS S1
Own workforce
ESRS S2
Workers in the value chain
ESRS S3
Affected communities
ESRS S4
Consumers and end-users
Topical standards—Governance
ESRS G1
Business conduct
17.4.2 Impact Reporting Frameworks
The IFRS Sustainability Standards and the ESRS require companies to disclose much needed information on material sustainability topics. The final step of Impact Measurement and Valuation translates the social and environmental metrics (Q) in value or capitals by monetising them with valuation factors or shadow prices (SP), as explained below. Please note that this is not the same definition of impact as typically used in impact investing, where impact also implies intentionality and additionality. See, for example, the impact investing definition of the Global Impact Investing Network in Sect. 14.5 of Chap. 14.
Impact reporting is a recent phenomenon. The major emerging impact reporting frameworks, which are all voluntary, include:
Integrated Capitals Assessments written by the Capitals Coalition, formed by uniting the Natural Capital Coalition and the Social and Human Capitals Coalition;
Impact-Weighted Accounts Framework (IWAF) written by the Impact Economy Foundation with experts from Harvard Business School, Singapore Management University, Rotterdam School of Management and Impact Institute;
Value Balancing Alliance (VBA) written by an association consisting of more than 25 international companies and the big four audit firms.
These frameworks have a similar set-up, but differ in core principles, dimensions of impact and level of detail. We explain the basics of impact reporting in Fig. 17.11, following the Impact-Weighted Accounts Framework (IWAF) (Impact Economy Foundation, 2022). Impact-Weighted Accounts contain impact information for the calculation of SV and EV for stakeholders. Impact frameworks make use of four capitals: financial, social, human, and natural capital. Financial capital forms the financial value (FV), social and human capitals are combined in the social value (SV), and natural capital is the environmental value (EV).6
An illustration lists 6 basics of impact reporting. Identification of material impacts across the value chain. Measurement of impact. Comparability. Aggregation of impact within welfare categories. Attribution of impact across the value chain. Presentation of an impact statement.
Fig. 17.11
Basics of impact reporting
×
Material Impacts
The first step is the identification of impacts that are material for stakeholders, which include investors, employees, suppliers, customers, local communities, nature and future generations. The impacts reflect current and future value enjoyed by stakeholders and are based on welfare considerations. Welfare does include not only the current and future well-being of stakeholders, but also the effects of guaranteeing or non-guaranteeing of stakeholder rights (see Box 5.1 in Chap. 5 on the rightsholders approach). Value chain responsibility means that a company is accountable for the consequences of its own activities (direct impacts) and those of its suppliers and customers (indirect impacts).
Whereas financial reporting takes an investor’s/financier’s perspective (did a company increase (profit) or decrease (loss) its financial value over last year’s period), impact reporting takes a stakeholder perspective (what is the impact of a company’s activities on its stakeholders?; did a company create value for its stakeholders?). An example of value creation (positive impact) is where customers give up financial value (payment for the product) and receive a product (manufactured capital) that represents a larger value for them. Another example of value creation refers to employees, who give up their time (representing a value in human capital) and receive salaries (financial capital) as well as, potentially, well-being from work and future career benefits due to training and work experience (human capital). An example of value reduction (negative impact) is where stakeholders are worse off due to a company’s activities (e.g. pollution reducing natural capital). These examples sound quite abstract. Table 17.5 below provides a company case study showing the company’s positive and negative impacts across the six capitals.
Measurement
Measuring the size of impacts is done with respect to a basis or reference. The Greenhouse Gas Protocol, for example, simply measures a company’s carbon emissions (Scope 1, 2, or 3). Technically, these emissions are then compared to a no-activity reference. In the case of wages, the reference point is a living wage (see Chap. 5). Let’s take the example of a fast fashion company using a foreign garment factory. If this garment factory pays its employees $1 an hour and the living wage of the country in which the factory operates is $1.40, there is an underpayment of $0.40. The number of hours times the underpayment of $0.40 per hour is then the negative social impact (negative social value). As we have seen in the case of Inditex (Chap. 11), it can be difficult in practice to measure the number of hours in Inditex’s supplying garment factories, and the actual wage paid by these factories.
Monetisation for Comparability
An important step for impact reporting is monetising (putting a shadow price, SP, on) the social and environmental factors (quantities, Q) to derive the social and environmental value (Q*SP). The valuation factors (shadow prices) reflect the true price of social and environmental factors (see Chap. 5). The reported impact in terms of SV and EV can then be compared to FV. In addition, this allows for comparing impact reports over time and between companies. As a result, monetisation facilitates integrated valuation and investment decision-making (see Chaps. 5–9 and 18).
Aggregation with Caution
An impact assessment can add up to multiple impacts. Aggregation is then needed to keep an overview. At the same time, aggregation across welfare categories should be avoided. Otherwise, pollution (violating the rights of certain stakeholders) can be offset by creating employment (well-being of employees). So aggregation should only be done within welfare categories (see Table 5.4 for material social and environmental welfare categories), and while remaining conscious of the elements being aggregated.
Attribution
Double counting of impact should be avoided. The direct impact of one company (e.g. a supplier) can be the indirect impact of another company in the same value chain. Attribution distributes shares of the impact to each of the stakeholders in the value chain (see Chap. 5). The company case study below shows how attribution works in practice.
Impact Statements: So Far Only Integrated P&Ls
Impact statements can follow the format of financial statements in Sect. 17.1. The impact or integrated P&L presents a company’s value creation and reduction across the six capitals during the year analysed. Until now, companies that do impact reporting have only published an overview of the past year’s positive and negative impacts. The company case study below shows such an integrated P&L statement.
No Impact Balance Sheets Yet
The impact balance sheet records a company’s assets and liabilities at year end. These assets and liabilities affect a company’s ability to create integrated value for its stakeholders and its responsibility towards its stakeholders. An impact balance sheet thus contains forward-looking elements, while a financial balance sheet records assets and liabilities at historical value which is backward-looking. Section 17.5 discusses the difficulties in producing an integrated balance sheet, which combines financial, social, and environmental assets and liabilities.
Impact Performance
Summing up, material social and environmental factors are inputs for impact reporting. To assess a company’s impact performance, the social and environmental factors need to be placed in context. Does the company stay within social and planetary boundaries? Chap. 14 introduces the footprint method, which translates the social and planetary boundaries into social minimum levels and environmental ceilings at company level (Sect. 14.4.3). The questions are then (1) whether a company is paying a living wage across its supply chain and respecting human rights and (2) whether a company’s GHG emissions are on a downward trajectory in line with the Paris global warming limit of 1.5 °C.
17.4.3 Impact Reporting Company Case Study
Impact reporting is quite challenging for companies. The complexity of the impact data creates process complexity for the organisation. As the Impact Institute (2019, p. 9) puts it: ‘An organisation typically has to undergo a phased process in order to ultimately be able to manage its impact in a manner that fits its purpose and goals. This process is referred to as the impact journey and can take several years. An impact journey typically starts with small-scale internal reporting, then evolves to a state in which thinking about impact is central in the organisation’.
We take the impact report of Alliander, a Dutch electricity and gas grid operator, as an example. The distribution of energy through its networks makes a positive contribution to the economic development of regions and stakeholders. Alliander participates in alliances to use common standards for its impact reporting. The Dutch network operators, for example, agreed to use a common carbon price for impact measurement to make their performance on carbon emissions comparable. The network operators apply a progressively increasing carbon price over time; the shadow carbon price for 2021 was €157.
Table 17.5 shows an excerpt from Alliander’s impact report over 2021. We highlight the main items of the impact report. Remember that impact is considered from the perspective of the company’s stakeholders. So, the payment of salaries to employees is an increase in financial value for employees. Alliander’s employees received €678 million in salaries over 2021. Equity and debt holders received €359 in dividends, repayments, and interests, while Alliander raised capital to the amount of €865 million. Business and household customers had to pay €866 and €1177 million, respectively, for the energy transmission.
Energy distribution and transmission form Alliander’s manufactured capital. Alliander’s share in value for consumers amounted to €5.3 billion (€3.0 billion for gas transmission and €2.3 billion for electricity transmission) and for business customers to €453 million in 2021. This value is measured as increase in consumers’ well-being due to the use of energy. Well-being is calculated on the basis of paid value and consumer surplus (the extra amount that customers are in theory prepared to pay on top of the price for a product). Value of goods procured reflects the value produced by Alliander’s suppliers.
Alliander's impact statement. In financial capital, the capital value decreases more. In produced capital, the capital value increases more. In intellectual capital, only the capital value increases. In natural capital, only the capital value decreases. The social, and human capital increases more.
Note: Amounts are in € millions;
2 dark-shaded bars.
quantified;
2 light-shaded bars.
not quantified
Source: Adapted from Annual Report 2021, Alliander
Natural capital depletion is a major concern for operators in the energy industry. Alliander aims to limit the negative impact of its use of materials (€45 million in 2021) by using recycled materials. The most important negative impact is carbon emissions, which amounted to €223 million in 2021, up from €218 million in 2020. This is largely due to the increase in the number of cold days (more usage of gas for heating) and the higher carbon price in 2021. A fall in carbon intensity per kWh due to a cleaner energy mix reduced the effect of the increase somewhat. The main contributor to carbon emissions is network and leakage losses, which arise during the transmission of electricity and gas. Alliander’s carbon strategy is to reduce network losses and to offset remaining network losses by generating additional renewable energy.
Measuring social impact is work in progress. Alliander reported an increased value of its reputation of €3.5 million in 2021. Alliander’s contribution to social cohesion was not quantified. On human capital, well-being effects of having work amounted to €60 million, while work-related sickness and accidents was €0.6 million in 2021.
Next, Alliander’s impact statement contains backward-looking data on Alliander’s impact, similar to the backward-looking information in financial statements. It would be good for users to include forward-looking information on the business model, strategy, and sustainability policy, including targets and pathways or milestones to reach these targets. The new European Sustainability Reporting Standards require companies to report their targets (see ESRS 2 in Box 17.4).
In sum, Alliander’s impact report provides an overview of its main impacts: the well-being benefits of gas and electricity distribution for its customers on the positive side and the depletion of natural resources on the negative side. This impact report highlights the external focus: it shows the impact on society and the environment (outward view) rather than the impact on the company (inward view). As impact reporting is not (yet) mandatory, the auditor provided limited assurance on Alliander’s impact report.
17.5 Integrated Reporting, Analysis, and Investor Relations
The final step is to bring a company’s financial statements (FV) and impact report (SV and EV) together in an integrated report.
17.5.1 Integrated Statements
The aim of integrated reporting is to provide stakeholders with reliable and comparable company information on material financial, social, and environmental factors. This should allow them to make a good estimate of FV, SV, and EV. Figure 17.12 shows the access to company information: internal management information systems contain a wealth of internal management information, of which only a small subset is externally reported; and these externally reported data are just a subset of the total body of externally available data about the company’s performance, since they are complemented by data from NGOs, researchers, regulators, external consultants, etc.
Traditionally, these internal management information systems are focused on financial information, providing detailed information on the financials of the operations and products/services. Companies are increasingly formulating key performance indicators (KPIs) for social and environmental factors. Examples are Net Promoter Score for customers, Employee Satisfaction or Engagement Score for employees, Carbon Emissions or Energy Savings for climate and Circular Use of Materials or Waste for circularity. These KPIs are included in management information systems and are thus becoming part of the monthly or quarterly management reports for the executive and non-executive board. Advanced companies also measure the impact on social, human, and natural capital, like Alliander in Sect. 17.4.
A subset of the available management information goes into the integrated report in the standardised format according to international reporting standards (see Fig. 17.12). Sections 17.3 and 17.4 show the evolution of international sustainability reporting standards, indicating what new information on social and environmental factors can be expected in integrated reports. Reporting standards promote the comparability of companies’ integrated reports, while mandatory audits improve the reliability of the provided information in integrated reports. Nevertheless, some of the impact information has still low verifiability and thus low reliability. In contrast, a key benefit of financial reporting is comparability, reliability, and verifiability of the financial information (see Sect. 17.1).
A block diagram. The internal management information gives integrated reporting. Integrated reporting gives stakeholders access to information.
Fig. 17.12
Access to company information
×
Stakeholders make their own assessment of a company’s integrated value profile using the integrated report as well as other external sources. These other sources include analyst reports, suppliers, competitors, NGOs, consultants, rating agencies, academic work on science-based targets, and shadow prices to calculate impact, as explained in Chap. 14.
Producing Integrated Statements
It is quite a challenge for companies to produce integrated statements. While accounting records past transactions in company financial statements (backward-looking), finance tries to assess the effect of future events (forward-looking). This distinction is less of a problem for the integrated profit & loss (IP&L) statement. The IP&L shows what happened last year and registers the revenues, expenditures, and impacts over this period. The main challenge is multiyear items: revaluations of assets (because of higher or lower expected future cash flows from an asset) and reorganisations (which make a company more cost-efficient in the future). Revaluations and reorganisation costs are often taken as extraordinary items in the P&L. The separate classification of these gains and losses reflects their unusual and infrequent nature. Several companies already publish an IP&L: ABN AMRO bank, Solvay, Holcim, Novartis, and Volvo. Table 17.5 shows the IP&L from the grid operator, Alliander. It combines the financial, social, and environmental flows over 2021 in an integrated impact statement.
Compiling an integrated balance sheet is more challenging. There is a big tension between the historical value or cost price of assets and the forward-looking earning power of assets. There are a few shortcuts. Marketable assets can be marked-to-market, reflecting the market value (forward-looking earning power) rather than the historical value. Another example is the Mindestwert principle in German accounting, which takes the lowest (‘mindest’) of the historical and market value (‘wert’). Next, some assets, such as intangible resources (see Sect. 17.1 and Chap. 2), are not captured as intangible assets in the balance sheet, but are crucial for a company’s business (and success).
The question is how to incorporate S and E factors in the balance sheet. Should a company report past (realised) carbon emissions or future (expected) carbon emissions based on a company’s business model in its balance sheet, or both? Well-accepted accounting concepts can provide guidance to certain important choices in integrated reporting. For example, accounting for liabilities focuses on ‘future obligations arising from past events’ (e.g. from forbidden cartel agreements). Applying the same concepts and approaches to integrated reporting could help answer questions on reporting on past and future carbon emissions.
At any rate, key financial (F), social (S), and environmental (E) factors should be in the integrated balance sheet. This enables auditors to review the accounting balance sheet and investors to compile a market value-based balance sheet. Although the feasibility of such an integrated balance sheet is low in the short-term, separate impact reporting on the current period in the IP&L is an intermediate step.
The aim of integrated reporting is to inform stakeholders (including shareholders and debt holders) to allow them to form a balanced opinion on the ‘value’ of the company. We are not quite there yet. As a result, the integrated valuation case study of Inditex in Chap. 11 was inevitably going to be an imprecise assessment, as material information on S and E was lacking in Inditex’s financial report. We had to fill in this lack of information with assumptions.
In sum, integrated reporting is work in progress. It is also a mindset. Integrated reporting facilitates integrated thinking (Oliver et al., 2016; Eccles & Krzus, 2014), which takes into account the connectivity and interdependencies between the factors that affect an organisation’s ability to create integrated value over time; it combines the financial, social, and environmental dimensions. Churet and Eccles (2014) interpret integrated reporting (admittedly referring to the regular, less ambitious meaning than that outlined above, but it still applies) as a proxy for management quality:
Companies that are able to articulate the relevance of sustainability issues to their long-term business success are likely to be those that are best equipped to address these issues internally. We therefore consider integrated reporting to be a useful proxy for the overall quality of management, which increasingly involves managing intangible assets while also taking account of any negative effects (or “externalities”) on the environment and society.
Integrated thinking also implies an ability to find an optimal balance between managing short-term business imperatives and on-going value creation.
Finally, the financial statement analysis in Sect. 17.1 can be expanded to an integrated statement analysis. Integrated return (as alternative to return on assets) and the integrated leverage ratio (as alternative to the financial debt-to-assets ratio) are introduced in Eqs. (17.22 & 17.23) in the Appendix. These integrated ratios provide an integrated picture of a company’s performance.
17.5.2 Integrated Audits and Investor Relations
A challenge is that some of the information in integrated reports cannot yet be fully certified by auditors, as there is lack of relevant auditor skills and international standards are still in the process of being adopted. Auditors play an important role in the assurance of integrated reports. In the examples of impact reporting in Sects. 17.3 and 17.4, the auditor provided limited assurance. The European Sustainability Reporting Standards (ESRS) require limited assurance for the first years of implementation (starting in 2024/2025) and reasonable assurance thereafter (see Box 17.4).
The training of auditors is a big challenge. Several institutes, like the Impact Institute, are setting up executive training programmes for impact reporting. Further, auditing integrated statements is more costly than auditing financial statements. Companies will only pay for assurance (limited or reasonable) of impact information, if it is mandatory or valued by the companies themselves. Moreover, auditing requires verifiability, which places boundaries on impact reporting. Nevertheless, advances in impact measurement and valuation have expanded the scope of impact measurement and reporting, as explained in Chap. 5.
Section 17.2 described the role of IR (investor relations) as widely practiced. Integrated IR means that the IR role is expanded to inform investors on the company’s value creation on E, S, and F. Figure 17.13 provides an overview of the messaging by an integrated IR department.
An integrated I R presentation. Pitch, why invest in this company? How does it create value on E, S, and F? Key products and markets, the company’s competitive edge, and challenges. Looking back to recent value creation history on E, S, and F. Looking forward to plans, respects, and growth.
Fig. 17.13
Typical points made in an integrated IR presentation
×
So, instead of just describing the profit potential of a new product, the company would emphasise how it creates value on E and S as well. For example, the product might be reducing CO2 emissions by a certain amount or improving the quality of life for a significant amount of people. These sources of E and S value creation may or may not help or hurt financial prospects in the short and/or long run, as discussed in Chap. 2. To convey that kind of information, companies could show tables like in Table 17.6.
This would allow analysts to make calculations, add their own assumptions, and then add it all up to arrive at value creation per business unit (BU), on F, S, E, and totals. Of course, IR should explain the underlying processes, including the action being undertaken to improve the value creation profile. See also the IR example presented on Inditex at the end of Chap. 11.
Table 17.6
Business unit level analysis of F, S, and E
BU1
BU2
BU3
Overall
F
Size by
• Sales
• Invested capital
Return on invested capital
EBIT margin
Sales growth
S
Annual health benefits in additional life years
Well-being of employment
Damages in human rights violations
Etc.
E
GHG emissions
GHG emissions avoided
Contribution to biodiversity losses
Contribution to biodiversity restoration
Waste generation
Etc.
17.6 Conclusions
Financial reporting serves an important role as a means of communication between corporate management and the company’s stakeholders, including investors. Companies issue several financial statements, like a balance sheet, a profit & loss account, and a cash flow statement. These financial statements are based on book values and show financial and manufactured capital, which form a company’s tangible assets. Financial reporting faces the challenge of painting a reliable picture of economic reality, which has become increasingly problematic. In the past decades, complexity has increased and intangibles have become a more important part of a company’s asset base (see Chap. 2).
This chapter outlines why reporting matters (promoting comparability and verifiability of company information) and how it falls short. It also shows how impact reporting can inform stakeholders about social and environmental factors. The chapter provides some company examples of impact statements. Integrated reporting—which combines financial and impact statements—is about understanding how an organisation creates integrated value and how its activities affect the capitals (intellectual, human, social, and natural capitals, next to financial and manufactured capital) it relies upon for this.
Ultimately, integrated reporting facilitates integrated thinking, which takes into account the connectivity and interdependencies between the financial, social, and environmental factors that affect an organisation’s ability to create integrated value over time. Some form of integrated reporting is applied by an increasing number of companies, but it is still far from widespread.
Another component of communication is investor relations. The job of companies’ investor relations department is to provide investors with an accurate account of company affairs. In addition to annual reports, regular analyst presentations and updates are the main tools to update investors. These presentations are expanding to social and environmental information in addition to financial information. But investors are slow to ask questions about this new information as their main focus is still on the financials.
Key Concepts Used in this Chapter
Accounting is the process of keeping financial accounts
Aggregation refers to combining data to provide an overview
Assurance (or audit) is the independent review of company accounts by a certified auditor
Attribution of impact distributes shares of an impact to each of the stakeholders in the value chain
Auditor is a chartered accountant that is qualified to audit financial statements
Balance sheet is a statement of the assets, liabilities, and equity capital of an organisation
Book value of equity is an accounting measure of equity. It is measured as the difference between a company’s assets and liabilities.
Efficiency ratios evaluate a company’s ability to generate income with its resources
Financial reporting is the process of producing reports that disclose an organisation’s financial status
Financial statement analysis is the process of reviewing and analysing a company's financial statements by external stakeholders, in which they calculate financial ratios to gain insights in the company’s ability to generate value
Going concern principle assumes that during and beyond the next reporting period a company will complete its current plans, use its existing assets, and continue to meet its financial obligations
Impact reflects changes that affect the welfare of a company’s stakeholders; companies create or destroy value for society through their impact
Intangibles are assets or resources that are not physical in nature; examples are human capital, goodwill, brand recognition, and intellectual property, such as patents, trademarks, and copyrights
Integrated reporting integrates financial, social, and environmental metrics and refers to concise communication about how an organisation’s strategy, governance, performance, and prospects, in the context of its external environment, lead to the creation of value over the short, medium, and long term
Integrated thinking refers to taking into account the connectivity and interdependencies between the factors that affect an organisation’s ability to create value over time; it combines the financial, social, and environmental dimensions
Investor relations informs current and prospective investors about the company’s financials, strategy, and operations
Leverage ratios show how the business operations are financed and provide an indication of the company’s solvency
Limited assurance is a lower level of audit assurance than reasonable assurance (see below), whereby the auditor collects less evidence but sufficient for a negative form of its conclusion: ‘nothing came to our attention to indicate that the management assertion on XYZ is materially misstated’
Liquidity ratios reflect the ability to meet the company’s short-term debt obligations
Market value of equity reflects a company’s market capitalisation. It depends on what investors expect a company’s assets to produce (or earn) in the future
Market Value ratios can be used to determine how valuable a company is
Materiality indicates relevant and significant information and refers to the degree to which certain information is important for a company
Net working capital is the capital available in the short term to run the business. It is calculated as the difference between a company’s current assets and current liabilities.
Profitability ratios are meant to reflect a company’s ability to generate profits
Reasonable assurance is a high level of audit assurance, but is not a guarantee that an audit will always detect a material misstatement (due to fraud or error) when it exists
Six capitals are the types of capital distinguished by the International Integrated Reporting Council, namely financial, manufactured, intellectual, social (and relationship), human and natural capital
Valuation ratios are based on a company’s market value and show how valuable a company is
Open Access This chapter is licensed under the terms of the Creative Commons Attribution 4.0 International License (http://creativecommons.org/licenses/by/4.0/), which permits use, sharing, adaptation, distribution and reproduction in any medium or format, as long as you give appropriate credit to the original author(s) and the source, provide a link to the Creative Commons license and indicate if changes were made.
The images or other third party material in this chapter are included in the chapter's Creative Commons license, unless indicated otherwise in a credit line to the material. If material is not included in the chapter's Creative Commons license and your intended use is not permitted by statutory regulation or exceeds the permitted use, you will need to obtain permission directly from the copyright holder.
This Appendix provides more detail on five categories of financial ratios discussed in Sect. 17.1: profitability, liquidity, leverage, efficiency and valuation ratios. Section 17.5 moves from financial statement to integrated statement analysis. Equations (17.21, 17.22 & 17.23) show how financial ratios can be expanded to integrated ratios.
Profitability Ratios
Profitability ratios measure the company’s ability to generate profits. The gross margin and operating margin ratios are measured in relation to a company’s total sales. The gross margin measures how much profit a company makes after subtracting cost of sales from total sales.
In 2020, Inditex’s gross margin is 55.8% = 11,390/20,402 (numbers are taken from Inditex’s income statement in Table 17.2). It is useful to compare the profitability ratios with industry peers to evaluate where the company outperforms or underperforms. If the average industry gross margin is 61%, then Inditex overpays for its cost of sales, resulting in a competitive disadvantage. The next step is the operating margin (also called EBIT margin), which measures a company’s profitability after subtracting operating expenses and depreciation from the gross profit.
Inditex’s operating margin is 7.4% = 1507/20,402 in 2020. In 2019, Inditex’s operating margin was 16.6%, so it is important to investigate the cause of this strong drop. It appears that this drop is due to the Covid-19 pandemic, which started in 2020.
Next, the return on assets (ROA) reflects a company’s ability to generate income for equity and debt investors employing its assets.7
Inditex’ ROA is 4.6% = (1104 + 106)/26,418 in 2020 (numbers taken from Tables 17.1 and 17.2). This means that every €1 in assets converts into €0.046 net income for equity and debt investors. The return on equity (ROE) is important to shareholders because it shows how much net profit is realised with their shareholder equity.
Inditex’s ROE is 7.6% = 1104/14,550 = 7.6%. A potential downside of using ROA or ROE is the sensitivity of profits for extraordinary events or windfalls. Moreover, a high ROE can be achieved by taking excessive debts. In such a case, ROE provides a misleading image when considered as a stand-alone ratio. ROE should therefore be judged together with a company’s leverage.
Liquidity Ratios
Liquidity refers to the company’s ability of meeting its short-term debt obligations. Does the company have enough liquid assets to pay the bills in the upcoming months? Liquidity and solvency are frequently used interchangeably, while they substantially differ from each other. Liquidity is based on the financial health within one year, while solvency reflects the capability to meet long-term debts and financial obligations. The current ratio is measured as current assets divided by current liabilities and shows short-term liquidity.
The current ratio is closely related to net working capital, explained in Sect. 17.1. The difference is that net working capital is calculated by subtracting current liabilities from current assets, and the current ratio by dividing the two. The main benefit from the current ratio is that is shows the relation of current assets to the liabilities, rather than an absolute number. Inditex’ current ratio is 1.73 = 10,957/6338 (numbers taken from Table 17.1), indicating that for every €1 current liability, there is €1.73 available in current assets, which is considered positive.
The quick ratio excludes the inventory from the current asset because in some cases, the inventory is not as liquid as cash or accounts receivable for example.
The quick ratio of Inditex is 1.36 = (10,957 − 2321)/6338, suggesting sufficient liquidity. Finally, the interest coverage ratio reflects a company’s ability to pay the interest on its debt.
To guarantee liquidity, the operating income should be a multiple of the interest expense, usually more than 1.5 times. For simplicity, we assume that the interest expense equals the financial results on the income statement (Table 17.2). Inditex’s interest coverage ratio is then 14.2 = 1507/106. This high number suggests a very healthy liquidity.
Leverage Ratios
Leverage ratios are an indicator of a company’s solvency. These ratios show the proportion of debt used to finance the assets employed in the business operations. A frequently used leverage ratio is the debt ratio, which is calculated as (current liabilities + long-term liabilities) divided by total assets, and strongly varies across sectors.
Inditex’ debt ratio is 44.9% = (6338 + 5529)/26,418 in 2020, which is relatively comparable for the retail industry. Debt ratios vary across sectors. In Europe, the average Air Transport company has a debt ratio of 74.6%, while the average Electronics company only has a debt ratio of 30.5% (Damodaran, 2022).8 A low debt ratio means better coverage of debt by assets for debt holders in financial distress, hence a better solvency. But it can also indicate an inefficient capital allocation, according to the free cash flow theory (see Chap. 15). Leverage should be considered in conjunction with a company’s risk profile. The more volatile a company’s business, the lower the leverage. High-tech companies with a high industry asset beta of more than one (see Fig. 13.4) are typically equity financed with little debt (low leverage). And vice versa: utilities with stable cash flow patterns (industry asset beta of a half) typically have a high leverage.
Next, the debt-to-equity ratio shows the distribution between debt and equity.
In 2020, Inditex’s debt to equity (D/E) ratio is 81.6% = (6338 + 5529)/14,550. A D/E ratio lower than 1 implies that every €1 in debt is backed by at least €1 in equity, which is assumed to be safe.
Efficiency Ratios
Analysts use efficiency ratios to evaluate a company’s ability to generate income with its resources. The commonly used efficiency ratios are asset turnover ratio and the inventory turnover. The asset turnover ratio measures the efficiency of using assets to produce sales.
Inditex’s asset turnover ratio is 77.2% = 20,402/26,418. A high asset turnover ratio signals efficient allocation of assets, which depends on the sector. The inventory turnover ratio shows how many times the company sold its inventory during a year.
The clothing retail industry tends to have a high inventory turnover ratio since every few months, a new collection is being distributed. The inventory turnover also relates to the liquidity ratios, because a high ratio reflects a liquid inventory. In such a case, analysts prefer to use the current ratio over the quick ratio. Inditex’ inventory turnover ratio is 3.9 = 9013/2321, which is quite high.
Valuation Ratios
Finally, analysts use valuation ratios to determine how valuable a company is. These valuation ratios are based on a company’s market value. These ratios tell not only external investors whether the stock is a good buy but also internal teams whether the company is generating enough value per share. Earnings per share (EPS) is the dominant metric to reflect the profitability of a publicly-traded company. EPS shows how much profit can be attributed to one share. Inditex’ EPS is already given in Table 17.2 and is calculated by net profit (earnings)/number of shares outstanding = 1104/3109.86 = €0.355. EPS is frequently used for the stock’s valuation.
The P/E ratio (price-earnings ratio) measures how valuable the company is relative to its EPS. In other words, how much do investors need to pay for €1 of earnings; it is therefore often called the earnings multiple. Via the multiple analysis, analysts compare the P/E to the industry peers to determine whether the stock is over- or under-valued. As explained in Sect. 9.3 of Chap. 9, the relationship for the stock price P is as follows:
$$ P= EPS\ast \frac{P}{E} $$
(17.19)
At the end of 2020, Inditex’ P/E ratio was 74.4 = 26.4/0.355. This means that investors pay 74.4 times the earnings to buy a stock, which seems very high. In 2019, the P/E ratio was just 27.6 = 32.25/1.168. The higher P/E ratio in 2020 is due to far lower earnings as a result of the Covid-19 pandemic in 2020. Fluctuating earnings highlight a major limitation of using multiples. It doesn’t tell anything about a company’s long-term earnings potential or earnings growth. A strong increasing EPS could justify a high P/E ratio. Another shortcoming is that the earnings multiple doesn’t capture the debt financing effect properly. Increasing debt reduces EPS via interest expenses but could have a positive impact on the future earnings if the additional debt is invested properly.
Finally, the market-to-book ratio evaluates the market value of equity in comparison with the book value of equity derived from the balance sheet.
The market value (market capitalisation) is determined by multiplying the stock price with the number of outstanding shares (see Eq. 17.3). It shows how investors value the company. The book value reflects the amount what’s left on paper after selling all assets (at book value) and repaying the liabilities. At 31st December 2020, the market value of Inditex was €82.1 billion = 26.4 * 3.1 billion shares (see Example 17.1). And the book value equals the equity on the balance sheet €14.5 billion (see Table 17.1). Hence, Inditex’s market-to-book ratio is 5.66 = 82.1/14.5. A typical ratio would lie between 1 and 2. As Example 17.1 already indicated, Inditex’s market-to-book ratio Inditex is fairly high.
Integrated Ratios
Sect. 17.5 expands the financial statement analysis from Sect. 17.1 to integrated statement analysis. In Chap. 14, we introduced impact-adjusted return as alternative to financial return on assets (Eq. 17.10), reflecting the financial return and social and environmental impact. Following Eq. (14.5), the impact-adjusted return is calculated by dividing the sum of ΔFV, ΔSV and ΔEV by the financial value FV.
Investors can use impact-adjusted return on assets to assess the effect of a company on society as whole. A reforestation company could struggle to make money but can still have a high integrated return because of its positive environmental impact. Example 14.4 in Chap. 14 calculates the impact-adjusted return of Inditex, as follows:
Impact-adjusted return changes only the numerator in Eq. (17.21): from financial profit to integrated profit (financial profit and impact). Taking financial value in the denominator is an intermediate step; this reflects the investor perspective. Another step would be to take integrated value (defined as IV = FV + SV + EV) in the denominator; this reflects the societal perspective of all stakeholders. We then get integrated return:
Next, Chap. 15 discusses the importance of integrated statements where E and S are explicitly valued. The integrated leverage ratio gives an integrated picture of the company’s capital structure and the implications when analysts focus on integrated value instead of solely financial. Following Sect. 15.6, we define the integrated leverage ratio as follows:
The integrated debt is the sum of F, S and E debt, while integrated assets sum F, S and E assets (see Sect. 15.6). Example 15.6 calculates the integrated leverage of Inditex as follows:
The book value of equity is different from the face or nominal value of shares. The face value of a share is the value per share as stated in the issuing company’s charter.
The International Integrated Reporting Council distinguished earlier six capitals: manufactured capital (which is part of financial value) and intellectual capital (which contributes to each of the three value components).
For ease of exposition, we use total assets at the end of the year. Strictly speaking, we should take average total assets during the year, which is the average of total assets at the beginning and the end of the year.