Open Access 2018 | Open Access | Buch
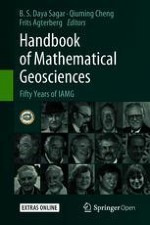
Buchtitelbild

Handbook of Mathematical Geosciences

Fifty Years of IAMG

herausgegeben von: Prof. B.S. Daya Sagar, Qiuming Cheng, Prof. Dr. Frits Agterberg

Verlag: Springer International Publishing

insite
SUCHEN

Über dieses Buch

This Open Access handbook published at the IAMG's 50th anniversary, presents a compilation of invited path-breaking research contributions by award-winning geoscientists who have been instrumental in shaping the IAMG. It contains 45 chapters that are categorized broadly into five parts (i) theory, (ii) general applications, (iii) exploration and resource estimation, (iv) reviews, and (v) reminiscences covering related topics like mathematical geosciences, mathematical morphology, geostatistics, fractals and multifractals, spatial statistics, multipoint geostatistics, compositional data analysis, informatics, geocomputation, numerical methods, and chaos theory in the geosciences.

Inhaltsverzeichnis

Frontmatter

Theory

Frontmatter

Open Access

1. Kriging, Splines, Conditional Simulation, Bayesian Inversion and Ensemble Kalman Filtering

This chapter discusses, from a theoretical point of view, how the geostatistical approach relates to other commonly-used models for inversion or data assimilation in the petroleum industry. The formal relationship between point Kriging and splines or radial basis functions is first presented. The generalizations of Kriging to the estimation of average values or values affected by measurement errors are also addressed. Two algorithms are often used for conditional simulation: the “rough plus smooth” approach consists of adding a smooth correction to a non-conditional simulation, whilst sequential Gaussian simulation allows the point-by-point construction of the realizations. As with Kriging, conditional simulation can be applied to average values or to data affected by measurement errors. Geostatistical inversion generates high-resolution realizations of vertical impedance traces constrained by seismic amplitudes. If the relationship between impedance and amplitude data is linearized, geostatistical inversion is a particular case of Bayesian inversion. Because of the non-linearity of production data vis-à-vis the variables of the earth model, their assimilation is harder than that of seismic data. Ensemble Kalman filtering, if considered from a geostatistical viewpoint, consists of using a large number—or ensemble—of realizations to calculate empirical covariances between the dynamic data and the parameters of the geostatistical model. These covariances are then used in the equations for interpolating the mismatch between simulated and new production data using a coKriging-like formalism. Interestingly, most of these techniques can be expressed using the same generic equation by which an initial model not honouring some newly arrived data is made conditional to these data by adding a (co-)Kriged interpolation of the data mismatches to the initial model. In spite of their similar equations, Bayesian inversion, geostatistics and ensemble Kalman filtering have a different approach to the inference of the covariance models used by these equations.

Olivier Dubrule

Open Access

2. A Statistical Commentary on Mineral Prospectivity Analysis

We compare and contrast several statistical methods for predicting the occurrence of mineral deposits on a regional scale. Methods include logistic regression, Poisson point process modelling, maximum entropy, monotone regression, nonparametric curve estimation, recursive partitioning, and ROC (Receiver Operating Characteristic) curves. We discuss the use and interpretation of these methods, the relationships between them, their strengths and weaknesses from a statistical standpoint, and fallacies about them. Potential improvements and extensions include models with a flexible functional form; techniques which take account of sampling effort, deposit endowment and spatial association between deposits; conditional simulation and prediction; and diagnostics for validating the analysis.

Adrian Baddeley

Open Access

3. Testing Joint Conditional Independence of Categorical Random Variables with a Standard Log-Likelihood Ratio Test

While tests for pairwise conditional independence of random variables have been devised, testing joint conditional independence of several random variables seems to be a challenge in general. Restriction to categorical random variables implies in particular that their common distribution may initially be thought of as contingency table, and then in terms of a log-linear model. Thus, Hammersley–Clifford theorem applies, and provides insight in the factorization of the log-linear model corresponding to assumptions of independence or conditional independence. Such assumptions simplify the full joint log-linear model, and in turn any conditional distribution. If the joint log-linear model corresponding to the assumption of joint conditional independence given the conditioning variable is not sufficiently large to explain some data according to a standard log-likelihood test, its null–hypothesis of joint conditional independence may be rejected with respect to some significance level. Enlarging the log-linear model by some product terms of variables and running the log-likelihood test on different models may provide insight which variables are lacking conditional independence. Since the joint distribution determines any conditional distribution, the series of tests eventually provides insight which variables and product terms a proper logistic regression model should comprise.

Helmut Schaeben

Open Access

4. Modelling Compositional Data. The Sample Space Approach

Compositions describe parts of a whole and carry relative information. Compositional data appear in all fields of science, and their analysis requires paying attention to the appropriate sample space. The log-ratio approach proposes the simplex, endowed with the Aitchison geometry, as an appropriate representation of the sample space. The main characteristics of the Aitchison geometry are presented, which open the door to statistical analysis addressed to extract the relative, not absolute, information. As a consequence, compositions can be represented in Cartesian coordinates by using an isometric log-ratio transformation. Standard statistical techniques can be used with these coordinates.

Juan José Egozcue, Vera Pawlowsky-Glahn

Open Access

5. Properties of Sums of Geological Random Variables

In the absence of empirical data that allows resolution of the vexing problem of how to address probabilistic dependencies among and between elements of large sets of geologic random variables data we need methods that refocus and streamline expert geological judgment inputs along with analytical methods for modeling dependencies that go beyond pairwise correlation and its cousins. Some possibilities are reviewed.

G. M. Kaufman

Open Access

Chapter 6. A Statistical Analysis of the Jacobian in Retrievals of Satellite Data

Remote sensing has become an essential component of the geosciences (the study of Earth and its system components). Remote sensing measurements are almost always energies measured in selected parts of the electro-magnetic spectrum. That is, the geophysical variable of interest is only observed indirectly; a forward model relates the energies to the variable(s) of interest and other elements of the state. The first derivative of that forward model with respect to the state is known as the Jacobian. In this chapter, we review the importance of the Jacobian to inferring the state, and we use it to diagnose which state elements may be difficult to estimate. We develop the Statistical Significance Filter and flag those state elements that consistently fail to get through the filter.

Noel Cressie

Open Access

7. All Realizations All the Time

Geostatistical simulation of mineral deposits is becoming commonplace. The methodology and software are well established and professionals have access to the training and checking steps required for reliable application. Managing multiple realizations, however, remains daunting and unclear for many: (1) the non-uniqueness of multiple realizations is disturbing; (2) many calculations including mine planning algorithms are aimed at a single block model; and (3) there are concerns of excessive computational requirements. The correct approach to managing multiple realizations is reviewed: consider all realizations all the time and base decisions on the appropriate expected value. The principles of simulation and decision making are reviewed for resource management.

Clayton V. Deutsch

Open Access

8. Binary Coefficients Redux

Paleoecologists and paleogeographers still make use of binary coefficients in multivariate analysis decades after being introduced to the geosciences. Among the main groups, similarity, matching and association, selecting a particular coefficient remains a confusing and sometimes empirical process. Coefficients within groups tend to correlate highly when applied to datasets. With increasing interest in a probabilistic approach to grouping taxa or faunal lists, the Raup-Crick measure of association is closely related in purpose and empirically to coefficients of association and works well in cluster analysis and ordination. A reasonable strategy is to compare dendrograms and ordinations calculated with several coefficients, care being taken to select coefficients with different performance characteristics. Above all, the practitioner should understand the purpose of each coefficient.

Michael E. Hohn

Open Access

9. Tracking Plurigaussian Simulations

The mathematical method called Plurigaussian Simulations was invented in France in the 1990s for simulating the internal architecture of oil reservoirs. It rapidly proved useful in other domains in the earth sciences: mining, hydrology and history matching. In this chapter we use complex dynamic networks first developed in statistical mechanics to track the diffusion of the method within academia, using citation data from Google Scholar. Since governments and funding agencies want to know whether ideas developed in research projects have a positive effect on the economy, we also studied how plurigaussian simulations diffused from academia to industry. The literature on innovation usually focusses on patents but as there were few on plurigaussian simulations, we needed criteria for deciding whether an innovation had been adopted by industry. Three criteria were identified: Repeat co-authorship. Many published papers were co-authored by mining or oil companies, or by consulting firms. While this demonstrates interest from industry, in some cases it seemed to be “window-shopping” but companies that continued to publish on this topic (i.e. “repeat co-authors”) had clearly adopted the method.Specialized training. Companies that wanted to build-up inhouse competency, sent their personnel for postgraduate training or to specialized short courses.Bringing in consultants. Rather than investing the time and effort in building up competency in-house, other companies got studies carried out by consulting firms.The second criterion revealed how important master’s level courses are in training geoscientists in the latest techniques. Their role in transferring knowledge to industry is undervalued in current procedures for evaluating university departments.

M. Armstrong, A. Mondaini, S. Camargo

Open Access

10. Mathematical Geosciences: Local Singularity Analysis of Nonlinear Earth Processes and Extreme Geo-Events

In the first part of the chapter, the status of the discipline of mathematical geosciences (MG) is reviewed and a new definition of MG as an interdisciplinary field of science is suggested. Similar to other disciplines such as geochemistry and geophysics, mathematical geosciences or geomathematics is the science of studying mathematical properties and processes of the Earth (and other planets) with prediction of its resources and changing environments. In the second part of the chapter, original research results are presented. The new concepts of fractal density and local singularity are introduced. In the context of fractal density and singularity a new power-law model is proposed to associate differential stress with depth increments at the phase transition zone in the Earth’s lithosphere. A case study is utilized to demonstrate the application of local singularity analysis for modeling the clustering frequency—depth distribution of earthquakes from the Pacific subduction zones. Datasets of earthquakes with magnitudes of at least 3 were selected from the Ring of Fire, subduction zones of Pacific plates. The results show that datasets from the Pacific subduction zones except from northeastern zones depict a profound frequency—depth cluster around the Moho. Further it is demonstrated that the clusters of frequency—depth distributions of earthquakes in the colder and older southwestern boundaries of the Pacific plates generally depict stronger singularity than those obtained from the earthquakes in their hotter and younger eastern boundaries.

Qiuming Cheng

General Applications

Frontmatter

Open Access

11. Electrofacies in Reservoir Characterization

Electrofacies are numerical combinations of petrophysical log responses that reflect specific physical and compositional characteristics of a rock interval; they are determined by multivariate procedures that include principal components analysis, cluster analysis, and discriminant analysis. As a demonstration, electrofacies were used to characterize the Amal Formation, the clastic reservoir interval in a giant oil field in Sirte Basin, Libya. Five electrofacies distinguish categories of Amal reservoir rocks, reflecting differences in grain size and intergranular cement. Electrofacies analysis guided the distribution of properties throughout the reservoir model, in spite of the difficulty of characterizing stratigraphic relationships by conventional means.

John C. Davis

Open Access

12. Shoreline Extrapolations

A morphological approach for studying coast lines time variations is proposed. It is based on interpolations and forecasts by means of weighted median sets, which allow to average the shorelines at different times. After a first translation invariant method, two variants are proposed. The first one enhances the space contrasts by multiplying the quench function, the other introduces homotopic constraints for preserving the topology of the shore (gulfs, islands).

Jean Serra

Open Access

13. An Introduction to the Spatio-Temporal Analysis of Satellite Remote Sensing Data for Geostatisticians

Satellite remote sensing data have become available in meteorology, agriculture, forestry, geology, regional planning, hydrology or natural environment sciences since several decades ago, because satellites provide routinely high quality images with different temporal and spatial resolutions. Joining, combining or smoothing these images for a better quality of information is a challenge not always properly solved. In this regard, geostatistics, as the spatio-temporal stochastic techniques of geo-referenced data, is a very helpful and powerful tool not enough explored in this area yet. Here, we analyze the current use of some of the geostatistical tools in satellite image analysis, and provide an introduction to this subject for potential researchers.

A. F. Militino, M. D. Ugarte, U. Pérez-Goya

Open Access

14. Flint Drinking Water Crisis: A First Attempt to Model Geostatistically the Space-Time Distribution of Water Lead Levels

The drinking water contamination crisis in Flint, Michigan has attracted national attention since extreme levels of lead were recorded following a switch in water supply that resulted in water with high chloride and no corrosion inhibitor flowing through the aging Flint water distribution system. Since Flint returned to its original source of drinking water on October 16, 2015, the State has conducted eleven bi-weekly sampling rounds, resulting in the collection of 4,120 water samples at 819 “sentinel” sites. This chapter describes the first geostatistical analysis of these data and illustrates the multiple challenges associated with modeling the space-time distribution of water lead levels across the city. Issues include sampling bias and the large nugget effect and short range of spatial autocorrelation displayed by the semivariogram. Temporal trends were modeled using linear regression with service line material, house age, poverty level, and their interaction with census tracts as independent variables. Residuals were then interpolated using kriging with three types of non-separable space-time covariance models. Cross-validation demonstrated the limited benefit of accounting for secondary information in trend models and the poor quality of predictions at unsampled sites caused by substantial fluctuations over a few hundred meters. The main benefit is to fill gaps in sampled time series for which the generalized product-sum and sum-metric models outperformed the metric model that ignores the greater variation across space relative to time (zonal anisotropy). Future research should incorporate the large database assembled through voluntary sampling as close to 20,000 data, albeit collected under non-uniform conditions, are available at a much greater sampling density.

Pierre Goovaerts

Open Access

15. Statistical Parametric Mapping for Geoscience Applications

Spatial fields represent a common representation of continuous geoscience and environmental variables. Examples include permeability, porosity, mineral content, contaminant levels, seismic impedance, elevation, and reflectance/absorption in satellite imagery. Identifying differences between spatial fields is often of interest as those differences may represent key indicators of change. Defining a significant difference is often problem specific, but generally includes some measure of both the magnitude and the spatial extent of the difference. This chapter demonstrates a set of techniques available for the detection of anomalies in difference maps represented as multivariate spatial fields. The multiGaussian model is used as a model of spatially distributed error and several techniques based on the Euler characteristic are employed to define the significance of the number and size of excursion sets in the truncated multiGaussian field. This review draws heavily on developments made in the field of functional magnetic resonance imaging (fMRI) and applies them to several examples motivated by environmental and geoscience problems.

Sean A. McKenna

Open Access

16. Water Chemistry: Are New Challenges Possible from CoDA (Compositional Data Analysis) Point of View?

John Aitchison died in December 2016 leaving behind an important inheritance: to continue to explore the fascinating world of compositional data. However, notwithstanding the progress that we have made in this field of investigation and the diffusion of the CoDA theory in different researches, a lot of work has still to be done, particularly in geochemistry. In fact most of the papers published in international journals that manage compositional data ignore their nature and their consequent peculiar statistical properties. On the other hand, when CoDA principles are applied, several efforts are often made to continue to consider the log-ratio transformed variables, for example the centered log-ratio ones, as the original ones, demonstrating a sort of resistance to thinking in relative terms. This appears to be a very strange behavior since geochemists are used to ratios and their analysis is the base of the experimental calibration when standards are evolved to set the instruments. In this chapter some challenges are presented by exploring water chemistry data with the aim to invite people to capture the essence of thinking in a relative and multivariate way since this is the path to obtain a description of natural processes as complete as possible.

Antonella Buccianti

Open Access

17. Analysis of the United States Portion of the North American Soil Geochemical Landscapes Project—A Compositional Framework Approach

A multi-element soil geochemical survey was conducted over the conterminous United States from 2007–2010 in which 4,857 sites were sampled representing a density of 1 site per approximately 1,600 km2. Following adjustments for censoring and dropping highly censored elements, a total of 41 elements were retained. A logcentred transform was applied to the data followed by the application of a principal component analysis. Using the 10 most dominant principal components for each layer (surface soil, A-horizon, C-horizon) the application of random forest classification analysis reveals continental-scale spatial features that reflect bedrock source variability. Classification accuracies range from near zero to greater than 74% for 17 surface lithologies that have been mapped across the conterminous United States. The differences of classification accuracy between the Surface Layer, A- and C-Horizons do not vary significantly. This approach confirms that the soil geochemistry across the conterminous United States retains the characteristics of the underlying geology regardless of the position in the soil profile.

E. C. Grunsky, L. J. Drew, D. B. Smith

Exploration and Resource Estimation

Frontmatter

Open Access

18. Quantifying the Impacts of Uncertainty

This chapter reviews the general concepts of uncertainty and probabilistic risk analysis with a focus on the sources of epistemic and aleatory uncertainty in natural resource and environmental applications together with examples of quantifying both types of uncertainty. The initial uncertainty in these applications arises from the in-situ spatial variability of variables and the relatively sparse data available to model this variability. Subsequent uncertainty arises from processes applied either to extract the in-situ variables or to subject them to some form of flow and/or transport. Various approaches to quantifying the impacts of these uncertainties are reviewed and several practical mining and environmental examples are given.

Peter Dowd

Open Access

19. Advances in Sensitivity Analysis of Uncertainty to Changes in Sampling Density When Modeling Spatially Correlated Attributes

A comparative analysis of distance methods, kriging and stochastic simulation is conducted for evaluating their capabilities for predicting fluctuations in uncertainty due to changes in spatially correlated samples. It is concluded that distance methods lack the most basic capabilities to assess reliability despite their wide acceptance. In contrast, kriging and stochastic simulation offer significant improvements by considering probabilistic formulations that provide a basis on which uncertainty can be estimated in a way consistent with practices widely accepted in risk analysis. Additionally, using real thickness data of a coal bed, it is confirmed once more that stochastic simulation outperforms kriging.

Ricardo A. Olea

Open Access

20. Predicting Molybdenum Deposit Growth

In the study of molybdenum deposits and most other minerals deposits, including copper, lead and zinc, there is speculation that most undiscovered ore results from an increase (or “growth”) in the estimated size of a known deposit due to factors such as exploitation and advances in mining and exploration technology, rather than in discovering wholly new deposits. The purpose of this study is to construct a nonlinear model to estimate deposit “growth” for known deposits as a function of cutoff grade. The model selected for this data set was a truncated normal cumulative distribution function. Because the cutoff grade is commonly unknown, a model to estimate cutoff grade conditioned upon the deposit grade was constructed using data from 34 deposits with reported data on molybdenum grade, cutoff grade, and tonnage. Finally, an example is presented.

John H. Schuenemeyer, Lawrence J. Drew, James D. Bliss

Open Access

21. General Framework of Quantitative Target Selections

Mineral target selection has been an important research subject for geoscientists around the world in the past three decades. Significant progress has been made in development of mathematical techniques and estimation methodologies for mineral mapping and resource assessment. Integration of multiple data sets, either by experts or statistical methods, has become a common practice in estimation of mineral potentials. However, real effect of these methodologies is at best very limited in terms of uses for government macro policy making, resource management, and mineral exploration in commercial sectors. Several major problems in data integration remain to be solved in order to achieve significant improvement in the effect of resource estimation. Geoscience map patterns are used for decision-making for mineral target selections. The optimal data integration methods proposed so far can be effectively applied by using GIS technologies. The output of these methods is a prognostic map that indicates where hidden ore bodies may occur. Issues related to randomness of mineral endowment, intrinsic statistical relations, exceptionalness of ore, intrinsic geological units, and economic translation and truncation, are addressed in this chapter. Moreover, a number of specific important technical issues in information synthesis are also identified, including information enhancement, spatial continuity, data integration and target delineation. Finally, a new concept of dynamic control areas is proposed for future development of quantification of mineral resources.

Guocheng Pan

Open Access

22. Solving the Wrong Resource Assessment Problems Precisely

Samples are often taken to test whether they came from a specific population. These tests are performed at some level of significance (α). Even when the hypothesis is correct, we risk rejecting it in α percent of the cases—a Type I error. We also risk accepting it when it is not correct—a Type II error at β probability. In resource assessments much of the work is balancing these two kinds of errors. Remarkable advances in the last 40 years in mathematics, statistics, and computer sciences provide extremely powerful tools to solve many mineral resource problems. It is seldom recognized that perhaps the largest error—a third type—is solving the wrong problem. Most such errors are a result of the mismatch between information provided and information needed. Grade and tonnage or contained models can contain doubly counted deposits reported at different map scales with different names resulting in seriously flawed analyses because the studied population does not represent the target population of mineral resources. Among examples from mineral resource assessments are providing point estimates of quantities of recoverable materials that exist in Earth’s crust. What decision is possible with that information? Without conditioning such estimates with grades, mineralogy, remoteness, and their associated uncertainties, costs cannot be considered, and possible availability of the resources to society cannot be evaluated. Examples include confusing mineral occurrences with rare economically desirable deposits. Another example is researching how to find the exposed deposits in an area that is already well explored whereas any undiscovered deposits are likely to be covered. Some ways to avoid some of these type III errors are presented. Errors of solving the wrong mineral resource problem can make a study’s value negative.

Donald A. Singer

Open Access

23. Two Ideas for Analysis of Multivariate Geochemical Survey Data: Proximity Regression and Principal Component Residuals

Proximity regression is an exploratory method to predict multielement haloes (and multielement ‘vectors’) around a geological feature, such as a mineral deposit. It uses multiple regression directly to predict proximity to a geological feature (the response variable) from selected geochemical elements (explanatory variables). Lithogeochemical data from the Ben Nevis map area (Ontario, Canada) is used as an example application. The regression model was trained with geochemical samples occurring within 3 km of the Canagau Mines deposit. The resulting multielement model predicts the proximity to another prospective area, the Croxall property, where similar mineralization occurs, and model coefficients may help in understanding what constitutes a good multielement vector to mineralization. The approach can also be applied in 3-D situations to borehole data to predict presence of multielement geochemical haloes around an orebody. Residual principal components analysis is another exploratory multivariate method. After applying a conventional principal components analysis, a subset of PCs is used as explanatory variables to predict a selected (single) element, separating the element into predicted and residual parts to facilitate interpretation. The method is illustrated using lake sediment data from Nunavut Territory, Canada to separate uranium associated with two different granites, the Nueltin granite and the Hudson granite. This approach has the potential to facilitate the interpretation of multielement data that has been affected by multiple geological processes, often the situation with surficial geochemical surveys.

G. F. Bonham-Carter, E. C. Grunsky

Open Access

24. Mathematical Minerals: A History of Petrophysical Petrography

The quantitative estimation of mineralogy from wireline petrophysical logs began as an analytical stepchild. The calculation of porosity in reservoir lithologies is affected by mineral variability, and methods were developed to eliminate these components. Simple inversion methods were applied in pioneer applications by mainframe computers to a limited suite of digital log data. Over time, the value of lithological characterization of reservoirs and resource plays has been recognized. At the same time, the introduction of newer petrophysical measurements, particularly geochemical logs, in conjunction with increasingly sophisticated algorithms, has increased confidence in mineral profiles from logs as a routine evaluation tool.

John H. Doveton

Open Access

25. Geostatistics for Seismic Characterization of Oil Reservoirs

In the oil industry, exploratory targets tend to be increasingly complex and located deeper and deeper offshore. The usual absence of well data and the increase in the quality of the geophysical data, verified in the last decades, make these data unavoidable for the practice of oil reservoir modeling and characterization. In fact the integration of geophysical data in the characterization of the subsurface petrophysical variables has been a priority target for geoscientists. Geostatistics has been a key discipline to provide a theoretical framework and corresponding practical tools to incorporate as much as possible different types of data for reservoir modeling and characterization, in particular the integration of well-log and seismic reflection data. Geostatistical seismic inversion techniques have been shown to be quite important and efficient tools to integrate simultaneously seismic reflection and well-log data for predicting and characterizing the subsurface lithofacies, and its petro-elastic properties, in hydrocarbon reservoirs. The first part of this chapter presents the state of the art and the most recent advances of geostatistical seismic inversion methods, to evaluate the reservoir properties through the acoustic, elastic and AVA seismic inversion methods with real case applications examples. In the second part we present a methodology based on seismic inversion to assess uncertainty and risk at early stages of exploration, characterized by the absence of well data for the entire region of interest. The concept of analog data is used to generate scenarios about the morphology of the geological units, distribution of acoustic properties and their spatial continuity. A real case study illustrates the this approach.

Amílcar Soares, Leonardo Azevedo

Open Access

26. Statistical Modeling of Regional and Worldwide Size-Frequency Distributions of Metal Deposits

Publicly available large metal deposit size data bases allow new kinds of statistical modeling of regional and worldwide metal resources. The two models most frequently used are lognormal size-grade and Pareto upper tail modeling. These two approaches can be combined with one another in applications of the Pareto-lognormal size-frequency distribution model. The six metals considered in this chapter are copper, zinc, lead, nickel, molybdenum and silver. The worldwide metal size-frequency distributions for these metals are similar indicating that a central, basic lognormal distribution is flanked by two Pareto distributions from which it is separated by upper and lower tail bridge functions. The lower tail Pareto distribution shows an excess of small deposits which are not economically important. Number frequencies of the upper tail Pareto are mostly less than those of the basic lognormal. Parameters of regional metal size-frequency distributions are probably less than those of the worldwide distributions. Uranium differs from other metals in that its worldwide size-frequency distribution is approximately lognormal. This may indicate that the lognormal model remains valid as a standard model of size-frequency distribution not only for uranium but also for the metals considered in this chapter, which are predominantly mined from hydrothermal and porphyry-type orebodies. A new version of the model of de Wijs may provide a framework for explaining differences between regional and worldwide distributions. The Pareto tails may reflect history of mining methods with bulk mining taking over from earlier methods in the 20th century. A new method of estimating the Pareto coefficients of the economically important upper tails of the metal size-frequency distributions is presented. A non-parametric method for long-term projection of future metal resource on the basis of past discovery trend is illustrated for copper.

Frits Agterberg

Reviews

Frontmatter

Open Access

27. Bayesianism in the Geosciences

Bayesianism is currently one of the leading ways of scientific thinking. Due to its novelty, the paradigm still has many interpretations, in particular with regard to the notion of “prior distribution”. In this chapter, Bayesianism is introduced within the historical context of the evolving notions of scientific reasoning such as inductionism, deductions, falsificationism and paradigms. From these notions, the current use of Bayesianism in the geosciences is elaborated from the viewpoint of uncertainty quantification, which has considerable relevance to practical applications of geosciences such as in oil/gas, groundwater, geothermal energy or contamination. The chapter concludes with some future perspectives on building realistic prior distributions for such applications.

Jef Caers

Open Access

28. Geological Objects and Physical Parameter Fields in the Subsurface: A Review

Geologists and geophysicists often approach the study of the Earth using different and complementary perspectives. To simplify, geologists like to define and study objects and make hypotheses about their origin, whereas geophysicists often see the earth as a large, mostly unknown multivariate parameter field controlling complex physical processes. This chapter discusses some strategies to combine both approaches. In particular, I review some practical and theoretical frameworks associating petrophysical heterogeneities to the geometry and the history of geological objects. These frameworks open interesting perspectives to define prior parameter space in geophysical inverse problems, which can be consequential in under-constrained cases.

Guillaume Caumon

Open Access

29. Fifty Years of Kriging

Random function models and kriging constitute the core of the geostatistical methods created by Georges Matheron in the 1960s and further developed at the research center he created in 1968 at Ecole des Mines de Paris, Fontainebleau. Initially developed to avoid bias in the estimation of the average grade of mining panels delimited for their exploitation, kriging received progressively applications in all domains of natural resources evaluation and earth sciences, and more recently in completely new domains, for example, the design and analysis of computer experiments (DACE). While the basic theory of kriging is rather straightforward, its application to a large diversity of situations requires extensions of the random function models considered and sound solutions to practical problems. This chapter presents the origins of kriging as well as the development of its theory and its applications along the last fifty years. More details are given for methods presently in development to efficiently handle kriging in situations with a large number of data and a nonstationary behavior, notably the Gaussian Markov random field (GMRF) approximation and the stochastic partial differential (SPDE) approach, with a synthetic case study concerning the latter.

Jean-Paul Chilès, Nicolas Desassis

Open Access

30. Multiple Point Statistics: A Review

Geostatistical modeling is one of the most important tools for building an ensemble of probable realizations in earth science. Among them, multiple-point statistics (MPS) has recently gone under a remarkable progress in handling complex and more realistic phenomenon that can produce large amount of the expected uncertainty and variability. Such progresses are mostly due to the recent increase in more advanced computational techniques/power. In this review chapter, the recent important developments in MPS are thoroughly reviewed. Furthermore, the advantages and disadvantages of each method are discussed as well. Finally, this chapter provides a brief review on the current challenges and paths that might be considered as future research.

Pejman Tahmasebi

Open Access

31. When Should We Use Multiple-Point Geostatistics?

Multiple-point geostatistics should be used when there is either too little or too much information available for other types of geostatistics.

Gregoire Mariethoz

Open Access

32. The Origins of the Multiple-Point Statistics (MPS) Algorithm

First proposed in the early 1990s, the geostatistical algorithm known as multiple-point statistics (MPS) now enjoys widespread use, particularly in petroleum studies. It has become part of the toolkit that new practitioners are trained to use in several oil companies; it has been incorporated into commercial software; and research programs in many universities continue to tap into the central MPS idea of extracting statistical information directly from a training image. The inspiration for the development of a proof-of-concept MPS prototype code owes much to several different researchers and research programs in the late 1980s and early 1990s: the sequential algorithms pioneered at Stanford University, the work of Chris Farmer, then at UK Atomic Energy, and the growing use of outcrop studies by several oil companies. This largely accidental confluence of divergent theoretical perspectives, and of distinct practical workflows, serves as an example of how science often advances through the intersection of ideas that are not only disparate but even contradictory.

R. Mohan Srivastava

Open Access

33. Predictive Geometallurgy: An Interdisciplinary Key Challenge for Mathematical Geosciences

Predictive geometallurgy tries to optimize the mineral value chain based on a precise and quantitative understanding of: the geology and mineralogy of the ores, the minerals processing, and the economics of mineral commodities. This chapter describes the state of the art and the mathematical building blocks of a possible solution to this problem. This solution heavily relies on all classical fields of mathematical geosciences and geoinformatics, but requires new mathematical and computational developments. Geometallurgy can thus become a new defining challenge for mathematical geosciences, in the same fashion as geostatistics has been in the first 50 years of the IAMG.

K. G. van den Boogaart, R. Tolosana-Delgado

Open Access

34. Data Science for Geoscience: Leveraging Mathematical Geosciences with Semantics and Open Data

Mathematical geosciences are now in an intelligent stage. The freshly new data environment enabled by the Semantic Web and Open Data poses both new challenges and opportunities for the conduction of geomathematical research. As an interdisciplinary domain, mathematical geosciences share many topics in common with data science. Facing the new data environment, will data science inject new blood into mathematical geosciences, and can data science benefit from the achievements and experiences of mathematical geosciences? This chapter presents a perspective on these questions and introduces a few recent case studies on data management and data analysis in the geosciences.

Xiaogang Ma

Open Access

35. Mathematical Morphology in Geosciences and GISci: An Illustrative Review

Georges Matheron and Jean Serra of the Centre of Mathematical Morphology, Fontainebleau founded Mathematical Morphology (MM). Since the birth of MM in the mid 1960s, its applications in a wide ranging disciplines have illustrated that intuitive researchers can find varied application-domains to extend the applications of MM. This chapter provides a concise review of application of Mathematical Morphology in Geosciences and Geographical Information Science (GISci). The motivation for this chapter stems from the fact that Mathematical Morphology is one of the better choices to deal with highly intertwined topics such as retrieval, analysis, reasoning, and simulation and modeling of terrestrial phenomena and processes. This chapter provides an illustrative review of various studies carried out by the author over a period of 25 years—related to applications of Mathematical Morphology and Fractal Geometry—in the contexts of Geosciences and Geographical Information Science (GISci). However, the reader is encouraged to refer to the cited publications to gather more details on the review provided in an abstract manner.

B. S. Daya Sagar

Reminiscences

Frontmatter

Open Access

36. IAMG: Recollections from the Early Years

John Cubitt and Stephen Henley, with contributions from T. Victor (Vic) Loudon, EHT (Tim) Whitten, John Gower, Daniel (Dan) Merriam, Thomas (Tom) Jones, and Hannes Thiergärtner.

John Cubitt, Stephen Henley

Open Access

37. Forward and Inverse Models Over 70 Years

The transition over 70 years from qualitative rock description to attempted quantitative description of rocks and rock bodies (inverse modelling) and testing of process models with observation data (forward models) are outlined. Dramatic increases of readily measured variables, combined with almost unlimited computing power, yielded a plethora of varied inverse models, but limited attention has been given to critical sampling, variance, closure, ‘black swan’, and nonlinear issues; recent approaches to closure problems hold promise. Especially for plutonic rocks, paucity of quantitative process modelling left exciting forward-modelling opportunities neglected. Resulting challenges ahead are anticipated.

E. H. Timothy Whitten

Open Access

38. From Individual Personal Contacts 1962–1968 to My 50 Years of Service

The author’s initial personal random contacts with pioneers in introducing mathematics and computers to geology in Russia, USA and France evolved thanks to the 23rd International Geological Congress and the foundation of the IAMG in Prague 1968. An incredibly large set of colleagues from all over the world have continuously contributed to a long series of regular international sessions at the Mining Příbram Symposia—a unique East–West gateway for the IAMG during the period 1968–1989. Very intensive work has been continuing until 2000 with several new peaks. The author has used many positive international organizational experiences from the work for the IAMG in developing geoethics, where many experts of mathematical geology have brought a considerable contribution to this new field.

Václav Němec

Open Access

39. Andrey Borisovich VISTELIUS

This chapter provides a glimpse of the legacy of Professor Andrey Borisovich Vistelius, who served as the first President of the International Association for Mathematical Geoscientists (IAMG) during 1968–1972. Professor Andrey Borisovich Vistelius (1915–1995) was arguably the founder of the field of mathematical geology, and he was the first President of the International Association for Mathematical Geology. As a 1982 recipient of the President’s Prize (later renamed the Andrey Borisovich Vistelius Research Award) I consider it a great privilege to have been invited to contribute this chapter in his honour. The scientific heritage of Professor Vistelius is extremely rich. His active work on fundamental and applied problems of geology, and especially mathematical geology, continued to the last days of his life. He was responsible for more than 200 published works, each representing a significant contribution to science. His works cover a wide range of subjects, with contributions to the development of stratigraphy, mineralogy, petrography, petrology and geochemistry. The mathematical approach to geoscientific research, pioneered by Vistelius, has gained recognition worldwide. As applied in practice, these works also represent building blocks to more effective methods of search for minerals. There have been a number of publications about Vistelius, and in attempting to present a rounded view of his life and works, this chapter quotes from them extensively: particularly Dvali et al. (1970), Romanova and Sarmanov (1970), Dech and Glebovitsky (2000), Merriam (2001), Henley (2003), Dech and Henley (2003), and Whitten (2004). I also wish to acknowledge unpublished sources including Whitten, the late Merriam, Pshenichny, and Dech.

Stephen Henley

Open Access

40. Fifty Years’ Experience with Hidden Errors in Applying Classical Mathematical Geology

Classical mathematical geology is a branch of mathematical geosciences in which mathematical methods and models—not specifically developed for and not exclusive to specific geosciences—are applied to describe, to model and to analyse quantitatively geoscientific subjects and processes. It was the dominant approach in the 1960s to 1980s and it is still used today to solve numerous, mostly limited and less complex problems. The methods have been implemented in the form of algorithms in commercial software packages that are widely used in geological practice. Their application frequently assumes specific pre-conditions, which are often difficult, if not impossible, to verify. This situation can result in significantly spurious output and errors that are often not recognised (hidden errors). In this paper five case studies are used to demonstrate these errors. In particular, they demonstrate that small mistakes can lead to serious, but often unrecognised, misinterpretations. The main conclusion is that there is a need to improve education and training in classical mathematical geology especially for engineering sections of consulting firms, governmental agencies and individual consultants.

Hannes Thiergärtner

Open Access

41. Mathematical Geology by Example: Teaching and Learning Perspectives

Numerical examples and visualizations are presented herein as teaching aids for multivariate data analysis, spatial estimation using kriging and inverse distance methods, and the variogram as a standalone data analytical tool. Attention is focused on the practical application of these methods.

James R. Carr

Open Access

42. Linear Unmixing in the Geologic Sciences: More Than A Half-Century of Progress

For more than a half-century, scientists have been developing a tool for linear unmixing utilizing collections of algorithms and computer programs that is appropriate for many types of data commonly encountered in the geologic and other science disciplines. Applications include the analysis of particle size data, Fourier shape coefficients and related spectrum, biologic morphology and fossil assemblage information, environmental data, petrographic image analysis, unmixing igneous and metamorphic petrographic variable and the unmixing and determination of oil sources, to name a few. Each of these studies used algorithms that were designed to use data whose row sums are constant. Non-constant sum data comprise what is a larger set of data that permeates many of our sciences. Many times, these data can be modeled as mixtures even though the row sums do not sum to the same value for all samples in the data. This occurs when different quantities of one or more end-member are present in the data. Use of the constant sum approach for these data can produce confusing and inaccurate results especially when the end-members need to be defined away from the data cloud. The approach to deal with these non-constant sum data is defined and called Hyperplanar Vector Analysis (HVA). Without abandoning over 50 years of experience, HVA merges the concepts developed over this time and extends the linear unmixing approach to more types of data. The basis for this development involves a translation and rotation of the raw data that conserves information (variability). It will also be shown that HVA is a more appropriate name for both the previous constant sum algorithms and future programs algorithms as well.

William E. Full

Open Access

43. Pearce Element Ratio Diagrams and Cumulate Rocks

While this chapter is about Pearce element ratios, I’ve included some personal reflections as this book is a 50th Anniversary project of the IAMG. Pearce element ratios, Felix Chayes and the Chayes medal, came together on September 11, 2001. As the recipient of the Chayes Medal, I was in Cancún, Mexico on that fateful date to deliver a talk on Pearce element ratios. Pearce element ratios are designed to model processes of fractionation and accumulation in igneous systems. They are frequently used to extract information from analyses of rocks formed from melts produced by fractionation—volcanic suites. Rock bodies formed from the fractionated crystals—the cumulate rocks—have received practically no attention. From the standard paradigm describing the formation of cumulate rocks, based on studies of the Skaergaard Intrusion, one expects a predicted pattern of data points on a Pearce element ratio diagram. Points derived from the mean compositions of the units in the cumulate body should fall up-slope from the point representing the initial melt composition on a diagram that accounts for the cumulate assemblage. Points derived from the compositions of the inferred residual melts present at the beginning of crystallization of a unit in the rock body should fall down-slope from the point representing the initial magma. The distance between a point on the line of a Pearce element ratio diagram and the point representing the initial magma composition depends on (1) the size of the aliquot that crystallized to form the rock unit and (2) the ratio of crystals to melt in the mush that solidified to form the rock unit. Patterns extracted from computer simulations compared to analogous data points from units of the Skaergaard Intrusion indicate that the crystal mushes that formed the units of the Marginal Border Series had a smaller ratio of trapped melt to crystals than did coeval mushes forming the Upper Border Series. Simulation patterns further indicate that the LZa and UZa units of the Layered Series formed from assemblages with larger ratios of melt to crystals than did the respective coeval units, LZa* and UZa*, of the Marginal Border Series.

J. Nicholls

Open Access

44. Reflections on the Name of IAMG and of the Journal

This note is to highlight the transformation of the names of International Association for Mathematical Geologists and its flagship journal Mathematical Geology respectively into International Association for Mathematical Geoscientists and Mathematical Geosciences.

Donald E. Myers

Open Access

45. Origin and Early Development of the IAMG

This chapter is primarily concerned with the first 15 years of our existence (I was a member of the IAMG Founding Committee, and on the 1968–1972 and 1996–1980 IAMG Councils). Daniel Merriam and Richard Reyment are the principal fathers of the IAMG, and many other scientists have contributed significantly to its origin and early development. Personal contacts with them are briefly described. These comments are supplementary to those already provided in earlier chapters by Founding Members and others who have made significant contributions to the IAMG originally. Special attention is paid to inputs by prominent mathematical statisticians with an interest in geology. I am grateful to all pioneers who have helped to establish the IAMG and provided a climate encouraging younger scientists, including myself, to pursue careers in their field of interest.

Frits Agterberg
Metadaten
Titel
Handbook of Mathematical Geosciences
herausgegeben von
Prof. B.S. Daya Sagar
Qiuming Cheng
Prof. Dr. Frits Agterberg
Copyright-Jahr
2018
Electronic ISBN
978-3-319-78999-6
Print ISBN
978-3-319-78998-9
DOI
https://doi.org/10.1007/978-3-319-78999-6